Feature Article: Macro and Asset Allocation Implications of Environmental Trends and Uncertainties
Context
We first wrote about the potential relationships between the evolution of environmental uncertainties and future asset class valuations in 2006 (“Climate Change and Asset Allocation”), shortly after the Stern Review (“The Economics of Climate Change”) was published by the UK Treasury. Thirteen years later, this column will review key macro trends and uncertainties related to the environment, alternative scenarios their interactions could produce, and the implications for asset class valuation and portfolio allocation.
Before delving in, it is critical that we place environmental issues in their proper, and much broader context.
In “The Natural Science Underlying Big History”, the astrophysicist Eric Chaisson concludes that, “A wealth of observational data supports the hypothesis that increasingly complex systems evolve unceasingly, uncaringly, and unpredictably from big bang to humankind. These are global history greatly extended, big history with a scientific basis, and natural history broadly portrayed across ∼14 billion years of time…”
“Quantitative models and experimental tests imply that a remarkable simplicity underlies the emergence and growth of complexity for a wide spectrum of known and diverse systems. Energy is a principal facilitator of the rising complexity of ordered systems within the expanding Universe; energy flows are as central to life and society as they are to stars and galaxies…Rising energy expenditure per capita has been a hallmark in the origin, development, and evolution of humankind…In particular, energy rate density [energy flow per unit of time per unit of mass or area] is an objective metric suitable to gauge relative degrees of complexity among a hierarchy of widely assorted physical, biological, and cultural systems observed throughout the material Universe. Operationally, those systems capable of utilizing optimum amounts of energy tend to survive, and those that cannot are non-randomly eliminated…”
In sum, environmental issues are inextricably bound up in the larger context of energy issues, which are deeply embedded in fundamental technological, economic, national security, social, and political dynamics.
Starting Points
According to NASA, crude global temperature records have only been available since around 1880. And since even today temperature sensors are not evenly distributed around the globe, even today’s global average temperature data remain somewhat noisy estimates. Yet even taking that into account, the evidence indicates that average global temperature has been increasing, at an accelerating rate.
NASA estimates that between 1880 and 2018, average global temperature increased by 0.8 degrees Celsius, or 1.4 degrees Fahrenheit. Moreover, two thirds of this increase has occurred since 1975.
Two hypothesis have been suggested to explain this increase. The first is solar cycles, the most recent of which is coming to its end. It is speculated that the next cycle may be a multicycle minimum (e.g., with low sunspot activity), which, all else being equal, could reduce average global temperatures by 0.3 degrees Celsius.
While solar cycles clearly had an impact, their impact is not sufficient to fully account for the observed rise in average temperature. For example, examination of extremely old ice cores, and other paleohistory techniques, have demonstrated an association throughout the earth’s history of increases in atmospheric and ocean CO2 levels (e.g., due to volcanic activity) with increases in temperatures. However, the operation of the earth’s climate system is extremely complex, with multiple feedback loops and non-linearities at work. Put differently, modeling the world climate system is extremely challenging, and all conclusions contain a degree of uncertainty (which the International Panel on Climate Change – the IPCC – is now expressing systematically).
The inability of solar cycles to fully explain the observed temperature change, and the findings from studies of the earth’s history led to the second hypothesis, that human actions have also had a substantial impact. In particular, this hypothesis has strongly focused on the burning of fossil fuels as a major contributor to the significant increase in carbon dioxide (CO2) and other so-called “greenhouse gases” in the earth’s atmosphere. Specifically, from a pre-industrial age estimated level of 280 parts per million, atmospheric CO2 had reached 407 ppm by 2018. Again, this has been increasing at an accelerating rate, from about 1.0 ppm per year in 1969, to 2.0ppm by 2005, and 2.5ppm most recently. This has been caused not only by accelerating production of CO2 and other GHG emissions, but also a slowdown in the rate at which oceans absorb CO2 from the atmosphere (and in the process become more acidic).
This “anthropogenic” hypothesis has led to calls for restricting CO2 and other GHG emissions, largely by reducing the burning of fossil fuels to generate energy. Most recently, the IPCC has urged policymakers to limit the observed rise in temperature to 1.5 degrees Celsius above the pre-industrial level.
Critical Uncertainties
First, what are the most important potential macro impacts if GHG emissions and average global temperature levels continue to increase?
Published in 2018, “Global Warming of 1.5°C. An IPCC Special Report”, urges policymakers to take more aggressive actions to limit GHG emissions in order to keep the future rise in average global temperature to 1.5 degrees Celsius above the pre-industrial global baseline temperature of about 14c or 57f. The report notes a substantial increase in various risks when the temperature increase is 2 degrees Celsius instead of 1.5. These include:
Extreme heat days are 4.0c hotter rather than 3.0c hotter, and associated reductions in human morbidity and mortality from extreme heat;
Higher frequency and severity of drought in some regions and extreme precipitation events in others;
Potentially lower climate-driven global migration flows;
A reduction of .1 meter (4 inches) in average sea level rise versus the .26 - .77 meter rise (10” to 30”) predicted if average temperatures increase by 2.0 degrees Celsius;
Reduced intensity of wildfires;
Less permafrost thawing;
Reduced spread of invasive species and vector born diseases from hot climates (e.g., malaria and dengue fever);
Reduced increase in ocean acidity and an estimated reduction of 2% rather than 4% in the aggregate annual fisheries catch; and
A lower reduction in global crop yield declines (forecast at 2% - 6% per decade at a 2 degree increase).
After weighing the findings presented in multiple analyses of climate change’s potential effects in many areas, from a macro perspective three loom above the others: food security and water security, and their potential impact on migration flows (with their attendant economic, national security, social, and political impacts)
The effect of climate change on global food production is further compounded by existing concerns regarding soil erosion and the decline in global soil quality (e.g., see, “Soil and Human Security in the 21st Century”, by Amundson et al), and the fact that 70% global phosphate reserves (from which comes phosphorous fertilizer, which is critical for drought resistance) are located in Morocco.
A further concern is the extreme complexity of the global climate system (with all its feedback loops), the inadequacy of current models of it, and therefore the high uncertainty surrounding our understanding of its operations and potential critical or tipping points (e.g., the dramatic slowdown or cessation of the North Atlantic Thermohaline Circulation, which would cause a sharp cooling in eastern North America and Northern Europe, as well as changes in precipitation elsewhere in the world).
Second,to what extent are we theoretically able to reduce GHG emissions and limit the increase in average global temperature?
Over the past fifteen years, there have been a number of analyses that have created supply curves for different means that could be used to reduce greenhouse gas emissions (e.g., see McKinsey’s “Pathways to a Low Carbon Economy: The Global Greenhouse Gas Abatement Cost Curve”). It is also the case that new technologies (e.g., geoengineering of cloud cover, or direct removal of CO2 from air) are constantly appearing, and the cost effectiveness of existing technologies continues to improve.
However, since electric power generation accounts for 25% or more (depending on the source) of global greenhouse gas emissions, and a far greater share of media stories on GHG reduction, it is worth taking a closer look at the current state of possibilities in this area.
To listen to some parties, all that is needed to sharply reduce GHG emissions is much more rapid deployment of renewable generation technologies, particularly wind and solar. Would that it was that easy…
First, consider the following table, which shows global electricity generation in 2018 by fuel source (source: International Energy Agency):
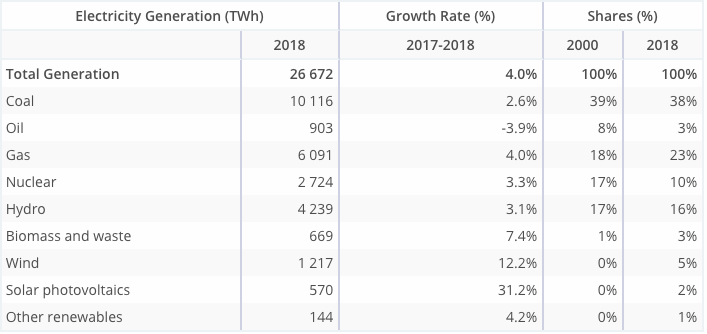
In sum, the major opportunity for GHG reduction from electricity production comes down to replacing coal with some combination of natural gas, nuclear, wind, and solar.
As we know, many people are opposed to increased use of nuclear power, despite the fact that it produces zero GHG emissions and its fuel supply is unconstrained. That leaves increased use of natural gas, wind, and solar. A number of advocacy groups claim that natural gas generation should be reduced (and coal and nuclear closed down) in favor of rapid deployment of wind and solar. However they ignore the technical challenges their plan entails. These include:
- Relatively low power density for wind and solar. In “The Spatial Extent of Renewable and Non-Renewable Power Generation”, van Zalk and Behrens show that given current renewable technologies’ power density (watts generated per square meter of space utilized), implementing the National Renewable Energy Laboratory (NREL) 80% renewable energy scenario by 2050 would require an additional 15 million hectares of land to be used for renewable power generation (an area roughly the size of the state of Illinois). In another study, “Observation-Based Solar and Wind Power Capacity Factors and Power Densities”, Miller and Keith found an average on-shore wind power density of .50 watts/square meter, which has been decreasing as wind generation is installed in more marginal locations. The average power density of solar plants was 5.4 watts/square meter, which has been increasing with time as the technology has improved (by comparison, the average power density of a natural gas generating station is 482 watts/square meter).
- The need for additional transmission lines to serve wind farms. Optimal locations for wind generation are mostly located far from the highest demand for electricity, which necessitates building more high voltage transmission lines. However, approval of these almost always runs into opposition.
- Increased use of variable renewable generation triggers escalating grid control challenges. Current electrical distribution systems were designed on the basis of central (e.g., coal fired) generating stations that would run continuously. When variable renewable generating sources (like wind and solar) are added to the grid at multiple locations, power quality and grid control challenges exponentially increase. While technical solutions are under development, these challenges remain serious obstacles to rapid deployment of wind and solar generation.
- Electricity storage technologies that could smooth power supply from wind and solar generation are still immature. Today, fluctuations in the supply of electricity from wind and solar generators is most often met by a combination of fast-start gas fired “peaker” generation stations, and increased output from coal, gas, and other “baseload” plants. Moreover, when the cost of battery storage to compensate for their intermittent generation is added to the cost of wind and solar generation, their cost per delivered kilowatt hour increases, shrinking their advantage over gas fired generation (and when additional grid control costs are added in, the cost of variable renewable energy increases even more).
Few would disagree that in the future, substantially more electricity will be produced by solar installations with much improved energy densities, backed by much improved battery and other storage technologies, and delivered by a much smarter grid. But we are still a long way off from that scenario becoming reality.
- Third, to what extent will different parties (including governments and companies) actually undertake initiatives to reduce GHG emissions on a meaningful scale?
This uncertainty encompasses three underlying issues:
The first is how different governments will tradeoff allocating scarce resources between mitigating the imperfectly understood causes of global warming (especially GHG emissions) and mitigating the expected consequences of a 1.5c, 2.0c, or even greater increase in average global temperature. The obvious problem is that thus poses a prisoners dilemma. Any individual country will minimize its risk if it invests in consequence mitigation while every other country invests in reducing GHG emissions. Collectively, however, this leads to most countries investing in consequence mitigation and few investing in GHG reduction. For example, consider the following table:
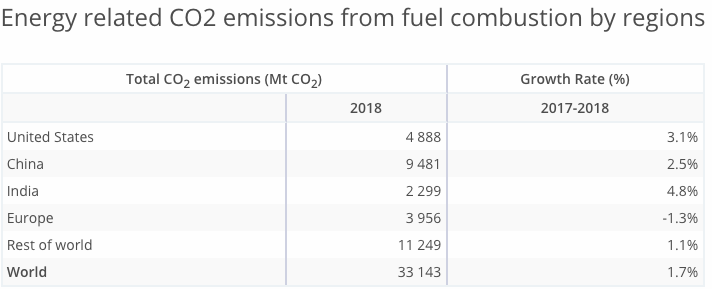
The critical point is that each of those prices comes with an opportunity cost. For example, if the United States imposed a carbon tax of $250/metric tonne on emitted GHGs, it would likely force a shift from coal to more expensive sources of power (assuming their technical feasibility, as noted above). In turn, those higher costs would be born by consumers and businesses, and could (depending on the use of the carbon tax proceeds) lead to a change in GDP growth, and the creation of political costs and benefits for different parties. Even when the US economic growth was relatively strong, a majority of political leaders were unwilling to impose a high price on GHG emissions. If the economy is in a prolonged downturn, their willingness might well be even lower.
The final issue brings us back to Chaisson’s point that energy is the lifeblood of all systems, and how increasing energy rate density enables higher levels of system complexity and performance.
For example, energy density increased when the world moved from using wood as its primary energy source (which has an energy density of 18 megajoules/kilogram) to using coal (10 – 35 mj/kg, depending on its grade), and then to using oil (42 mj/kg before refining), and later natural gas (54 mj/kg) and uranium for nuclear power (3,900,000 mj/kg). However, as non-renewable resources (or slowly renewable in the case of wood) are depleted, the marginal cost for producing the next unit increases (e.g., more expensive wells must be drilled, or more marginal coal deposits mined).
Given rising marginal costs of production, in order to maintain sufficient supply the price that producers receive for an additional unit of a depleting resource must keep increasing. In recent years, however, we have seen that energy prices don’t have to increase very much before the economy begins to slow (especially in increasingly unequal and highly leveraged countries where aggregate demand is already weak). Put differently, the gap between the energy price that incentivizes adequate growth in energy supply and the price that is too high to sustain demand growth has been narrowing. Imposing a GHG emissions tax on energy might make it completely disappear.
Scenarios and Asset Class Impacts
Our conclusion is that future macro environmental scenarios will be driven by the interaction of two key uncertainties:
- The rate at which the adverse effects of rising global temperatures appear, including their frequency, severity, and global distribution;
- The rate at which key technologies develop, especially those related to power generation, direct removal of CO2 from the atmosphere at scale (“Direct Air Capture”), and mitigation of food supply related consequences of increasing global temperatures.
Here are brief summaries of four possible scenarios and their likely impacts:
(1) Adverse temperature and other, possibly severe, climate effects appear relatively quickly, and the rate of technology development is slow, leading to less investment in emissions reduction, higher temperatures, and more spending on consequence mitigation.
- Economy: Slower growth, especially if food prices substantially increase, partially offset by higher government spending on consequence mitigation.
- National Security: More disorder and higher conflict driven by battles to control food resources and control rising migration flows. May reduce current China-West conflict.
- Society: Increased perception of common threat leads to reduced polarization and higher capacity for collective action.
- Politics: Higher levels of international conflict and strengthening of blocs. Increased defense and infrastructure spending.
- Asset Returns: Increased demand for gold, government bonds, infrastructure (including HVAC), and food supply chain equities. Commodity profits will be limited because of price controls to deter speculation. Property could do well as a defensive domestic investment.
(2) Adverse effects appear relatively slowly (e.g., because of a change in the solar cycle which slows the increase in average temperature, and technology advances quickly, leading to relatively more investment in emissions reduction.
- Economy: Potentially faster growth, due to both investment stimulus and reduced perceived uncertainty/increased optimism. But emissions reduction investments likely to be lower than scenario with high consequence mitigation.
- National Security: Lower levels of climate related disorder and conflict. However, current conflicts (e.g. China vs West) will continue.
- Society: Current levels of polarization will remain and possibly intensify as a result of splits over environmental spending.
- Politics: Current domestic and international conflicts continue.
- Asset Returns: Continued struggles with inadequate demand, high leverage, and deflationary pressures. Equities should benefit from new wave of tech opportunities and rising optimism.
(3) Adverse effects appear quickly, but the rate of technology improvement is fast. In this case, consequence mitigation will likely still receive the bulk of national investment, especially if the climate effects are severe.
- Economy: Slower growth, especially if food prices substantially increase, partially offset by higher government spending on consequence mitigation.
- National Security: More disorder and higher conflict driven by battles to control food resources and control rising migration flows. May reduce current China-West conflict.
- Society: Increased perception of common threat leads to reduced polarization and higher capacity for collective action.
- Politics: Higher levels of international conflict and strengthening of blocs. Increased defense and infrastructure spending.
- Asset Returns: Increased demand for gold, government bonds, infrastructure (including HVAC), and food supply chain equities. Commodity profits will be limited because of price controls to deter speculation. Property could do well as a defensive domestic investment.
(4) Adverse effects appear slowly, and technology develops slowly. As a result, investment in both emissions reduction and consequence mitigation is low relative to the other scenarios.
- Economy: Continued struggles to escape secular stagnation.
- National Security: Current conflicts (e.g. China vs West) will continue.
- Society: Current levels of polarization will remain, but environmental concerns could become less muted as secular stagnation drags on and focus on redistribution gains traction.
- Politics: Current international conflicts continue, with increasing domestic conflicts driven by continuing secular stagnation.
- Asset Returns: Continued struggles with inadequate demand, high leverage, and deflationary pressures. Gold as an alternative to negative yielding governments and rising concern over potential inflation as more debt is monetized by central banks. Property will benefit. Equities will depend on nature of fiscal stimulus to attack secular stagnation.
Going Forward
Having established this set of prior views, we will continue to update them each month as valuable information (i.e., indicators and surprises) become available. In particular, we will be focused on the dynamic “margin of safety” between the rate at which adverse environmental effects are developing and the rate at which potential emissions reduction and consequence mitigation options are maturing.
If you have any questions about anything we have written in this issue, please don’t hesitate to get in touch, at contact@indexinvestor.com