Feature Article: Why After a Period of High Uncertainty Persistent Deflation is More Likely than High Inflation
As far back as our May 2001 issue (“What is a Liquidity Trap and Why Should I Worry About It?”) and November 2002 issue (“Are We Headed Toward Global Deflation?”) we have been concerned about the macro system shifting into a persistent deflation regime, like the one Japan has been in since multiple bubbles collapsed there more than 25 years ago. And central banks have worked enormously hard – and creatively – to prevent this from happening. But they could not forever forestall the arrival of the deflationary regime on their own – and the fiscal and structural reforms that should have accompanied their monetary efforts have largely been blocked by polarized and gridlocked political systems. As a result, debt/GDP has continued to increase, and real deflationary forces have grown stronger by the year.
In this article, we will present the logic behind our conclusion that it is far more likely that the High Uncertainty Regime will be followed by the Persistent Deflation Regime than the High Inflation Regime. We also acknowledge that there is a slight probability that rather than either of these regimes, the high uncertainty may be followed by a return to the Normal Regime. The Pre-Mortem analysis is the preceding section describes two causal logics for this outcome.
Commentators often cite two different types of deflation, which they call “good” and “bad”. In this analysis, we will add one more: “terrible.”
In the case of “Good Deflation”, a sustained decline in the average price level is caused by so-called “supply shocks” – that is, a sudden increase in the supply of goods and services that is not offset by an increase in demand for them. An excellent example is the declines in prices that characterized the substantial expansion of output in the United States as the industrial revolution accelerated during the latter half of the 19th century.
In the case of “Good Deflation”, declining prices raise the effective purchasing power of consumers’ income, which can lead to a “virtuous cycle” rise in living standards and an increase in aggregate demand.
In contrast, “Bad Deflation” is caused by a sudden and sustained fall in aggregate demand relative to the capacity of the economy to supply goods and services. In this case, the beneficial impact of falling prices is offset by declining incomes and delayed spending as precautionary savings increase. In the absence of prompt monetary and fiscal policy action, this can trigger a “vicious cycle” of further falls in both aggregate consumption and investment spending which drive continuing price cuts. The Great Depression of the 1930s is often cited as an example of “Bad Deflation”.
As famously described in 1933 by the economist Irving Fisher, what we call “Terrible Deflation” results when “Bad Deflation” occurs in an economy that already has a high level of debt relative to either GDP (a stock), or to income (i.e., debt service/income, a flow).
Deflation raises the real value of debt and debt servicing expense; hence, in the presence of high debt levels, Bad Deflation results in both sharper reductions in spending than would otherwise occur, as well as more debt defaults, both of which drive greater falls in aggregate demand and a worsening of the vicious cycle.
A key issue is the extent to which good, bad, and terrible deflation drivers are present in today’s economy.
Clearly, there have been positive supply shocks in the global economy over the past 20 years that have put downward pressure on the prices of many goods and services (and in many cases improvements in their quality as well). These include the entry of China into the world trade system and the globalization of supply chains, the introduction of more efficient business models (e.g., Walmart and Amazon) enabled by improving technology, and productivity improvements in agriculture, energy, and manufacturing.
In recent years, however, one can argue that we have seen even more negative shocks to aggregate demand. These include population aging (older people tend to spend less), reduced labor share of national income, stagnant real wages, worsening inequality (consumption spending generally increases more slowly than income and wealth), and substantial increases in healthcare costs that have left less money to spend elsewhere. And in some places, state and local taxes have increased to cover the rising costs of social safety net benefits and public sector pension plans.
What is most worrisome, however, is that despite the 2008 financial crisis and its aftermath, debt levels (and debt/GDP) have continued to increase – and only extraordinary monetary policy actions have kept interest rates at very low levels, and thus prevented this increase in debt from also causing a destabilizing increase in debt service payments as a percent of household or business income (which would lead to less consumption and investment spending and/or higher defaults).
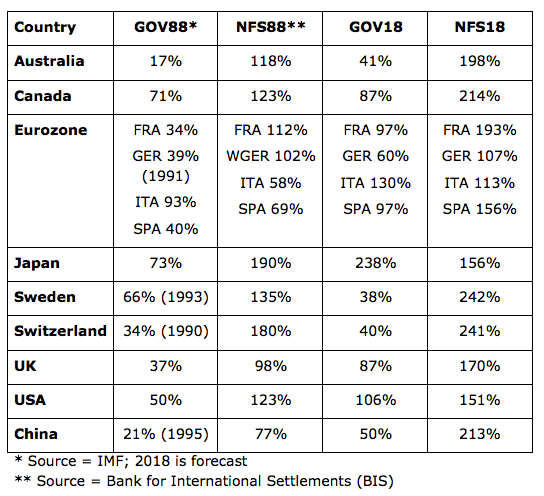
The following table shows the increase in general government debt and private non-financial sector debt (households and non-financial corporations) as a percent of GDP between 1988 and 2018:
The next table (from the BIS), shows debt service payments (interest and principal) as a percentage of income for households (HH) and non-financial corporate borrowers (NFC), as of the first quarter of 2000 and the first quarter of 2018.
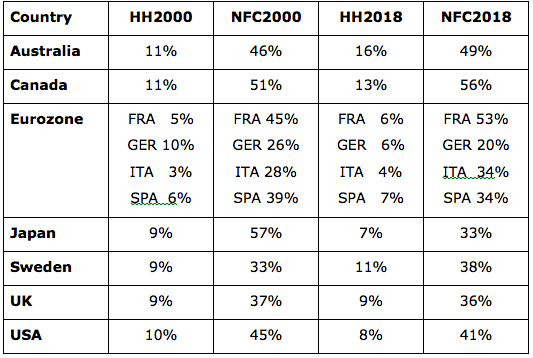
As you can see from these two tables, while non-financial sector Debt/GDP has substantially increased, debt service ratios rose by far less (and in some cases fell), reflecting the sharp drop in interest rates over the period covered by the BIS data (3Q2000 to 3Q2018). For example, the yield on the 10-year US Treasury fell from 6.13% to 2.79%.
Of course, the other implication of these data is that any significant increase in current low nominal rates of interest, or a further decline in aggregate demand and household and non-financial corporate sector income could quickly produce a sharp increase in financial distress and debt defaults.
Another critical point is that when the next economic downturn inevitably occurs, most major country governments will have little in the way of monetary and fiscal “firepower” available to counteract it.
Repeated rounds of quantitative easing since 2008 have sharply expanded the money supply, and cut nominal interest rates to very low levels. As a general rule of thumb, central bankers prefer to have policy room for up to a 500 basis point (5%) cut in interest rates to provide monetary stimulus to fight a downturn. They clearly don’t have that room today, as we are too close to the “zero lower bound” on nominal interest rates. Rather than a concern about inflation, we believe that it is the desire to rebuild future “policy space” that has been driving the US Federal Reserve’s moves to increase interest rates.
In many countries, fiscal policy space is similarly constrained, in this case by already high government debt levels (and note that reported debt levels to not include large and unfunded government liabilities for future social security and public sector pension benefits). This does, however, assume a degree of reluctance on the part of governments and their central banks to aggressively monetize expanding fiscal deficits. As Japan has shown, the longer deflation persists, the weaker this resistance becomes.
That leaves structural reform – e.g., to regulations, etc. – as the main policy tool that governments will have available to fight the next downturn. However, given the increased political polarization and gridlock that exists in many countries today (as well as the effective lobbying efforts of entrenched interest groups), the probability that structural policy will be effectively used seems low.
Finally, add to this grim outlook the ongoing adoption of automation and artificial intelligence technologies which, in the absence of an unlikely substantial improvement in education system performance, will at best put further downward pressure on the profitability of many business models and on employee wages, and at worst on total employment (forcing governments to devote more of their budgets to social safety net spending).
We will be very lucky indeed if this does not lead to an increase in financial distress and debt defaults, and development of a terrible deflation, which, as Japan has shown, can persist for years.
Let us now turn to the alternative hypothesis – that the High Uncertainty Regime will give way to High Inflation. There are two ways this could happen. The first would be a substantial negative supply shock, such as a sharp decrease in the supply of oil (e.g., due to Iran its threat to mine the strait of Hormuz), or massive crop failures (e.g., due to larger than expected changes in global temperatures).
In the second scenario, governments would increase spending to fight a potentially deep downturn, finance this spending with debt, and then monetize that debt by having it purchased by their central banks. This is not dissimilar to what was done in the wake of the 2008 crisis – yet in the face of powerful deflationary forces, that clearly did not cause a sharp increase in inflation rates.
This is not to say that at some point in the future this will not happen, as history repeatedly demonstrates. But at this point our conclusion is that the probability of the High Uncertainty Regime transitioning to the High Inflation Regime is substantially lower than the probability that it will give way to the Persistent Deflation Regime, in spite of policymakers’ strong desire to avoid this outcome.
If you have any questions about anything we have written in this issue, please don’t hesitate to get in touch, at contact@indexinvestor.com.