Feature Article: Faster Productivity Growth Is Critical. But Will It Happen?
Today in the United States, government and corporate debt are at record levels relative to GDP. While low interest rates have made it easier to service this debt, it is very unlikely they will last forever. When they go up again, the consequences (including austerity and defaults) will be severe – unless economic growth increases.
In a simple sense, economic growth is a function of two variables: The rate at which the labor force grows (due to rising births and/or immigration) the rate at which output per labor hour (labor productivity) grows. In the US and Europe, declining births and political resistance to higher levels of immigration mean that the labor force is growing much more slowly than in decades past. As a result, productivity growth is more important than ever to the future rate of economic growth.
Unfortunately, productivity growth has also sharply slowed in recent years.
Multi or Total Factor Productivity (MFP or TFP) is the percent of observed growth in output that cannot be explained by changes in the quantity of labor and capital inputs. A simple explanation of the meaning of this residual is that it measures the change in the efficiency with which labor and capital inputs are used.
A more detailed explanation interprets the growth of MFP as the net impact of many factors, including the breadth and rate of technological innovation (including approaches to management), the rate at which such innovations are incorporated into and improve the quality of the labor force and capital stock, the rate at which these improvements diffuse (spread) across industries and companies within them, and changes in institutions (e.g., regulations, financial markets, etc.) and changes in the relative weight of different sectors in the economy.
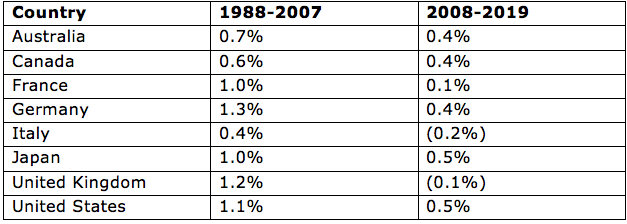
The following table (from the OECD) shows the average annual rate of MFP growth for a sample of countries over two periods: 1988 to 2007, and 2008 to 2019.
.
In a simple sense, economic growth is a function of two variables: The rate at which the labor force grows (due to rising births and/or immigration) the rate at which output per labor hour (labor productivity) grows. In the US and Europe, declining births and political resistance to higher levels of immigration mean that the labor force is growing much more slowly than in decades past. As a result, productivity growth is more important than ever to the future rate of economic growth.
Unfortunately, productivity growth has also sharply slowed in recent years.
Multi or Total Factor Productivity (MFP or TFP) is the percent of observed growth in output that cannot be explained by changes in the quantity of labor and capital inputs. A simple explanation of the meaning of this residual is that it measures the change in the efficiency with which labor and capital inputs are used.
A more detailed explanation interprets the growth of MFP as the net impact of many factors, including the breadth and rate of technological innovation (including approaches to management), the rate at which such innovations are incorporated into and improve the quality of the labor force and capital stock, the rate at which these improvements diffuse (spread) across industries and companies within them, and changes in institutions (e.g., regulations, financial markets, etc.) and changes in the relative weight of different sectors in the economy.
The following table (from the OECD) shows the average annual rate of MFP growth for a sample of countries over two periods: 1988 to 2007, and 2008 to 2019.
.
Looking further back, Robert Shackleton from the US Congressional Budget Office estimates that annual MFP growth was between 2.0% and 3.0% in the 1920s and 1930s as new general purpose technologies (like electricity and the internal combustion engine) spread throughout the economy). From 1950 to 1973 TFP grew by closer to 2.0% per year.
Following the 1973 and 1979 oil price and inflation shocks, MFP grew by less than 1.0% per year before recovering to more than 1.0% per year in the 1990s as new information and communication technologies were developed and diffused across industries and firms within them.
The annual rate of TFP growth slowed again in the early 2000s, and then plummeted in the years following the 2008 Global Financial Crisis (“Total Productivity Growth in Historical Perspective”).
Potential Root Causes of the Productivity Slowdown
A number of in-depth analyses have been undertaken to identify the causes of this decline.
Last month the US Bureau of Labor Statistics published “The US Productivity Slowdown: And Economy-Wide and Industry-Level Analysis”. The goal of this study was “to clarify potential sources of the productivity slowdown, through an analysis of labor productivity and its component series—multifactor productivity, contribution of capital intensity, and contribution of labor composition—at both the economy-wide and industry levels, complemented with a survey of the contemporary productivity literature.”
Key findings included the following:
• “Not only has the productivity slowdown been one of the most consequential economic phenomena of the last two decades, but it also represents the most profound economic mystery during this time, and though many economists have grappled with the issue for over a decade and even created some innovative research approaches to address the question, we still cannot fully explain what brought on this situation.”
• “The productivity slowdown of the past decade and a half has left the U.S. economy in a weaker position — yielding a sizable loss of potential output during these years—and perhaps even more importantly, it has also left the economy in a weaker position going forward.”
• “Reduced growth in MFP growth and capital intensity were the key contributors to the recent slowdown in labor productivity growth” (output per labor hour).
• “Throughout the historical period since WWII, the majority of the variation in labor productivity growth from one period to the next was from underlying variation in MFP growth.”
• “Something unprecedented about these recent periods was the additional contribution from variation in the contribution of capital intensity. The contribution of capital intensity had previously remained within a relatively small range (0.7 percent to 1.0 percent) during the first five decades of post-WWII periods, but then in the 1997–2005 period, the measure nearly doubled, from 0.7 percent up to 1.3 percent, followed by nearly halving to 0.7 percent in the 2005–18 period.”
• “Tighter financial constraints on firms during the recovery from the Global Financial Crisis (and higher levels of perceived uncertainty) may have reduced their investment in research and development and the commercialization of new technologies, which could have slowed MFP growth. Firms’ willingness to make these investments could also have been dampened by slow demand growth as the US recovered from the GFC” [see also, “Corporate Indebtedness and Low Productivity Growth of Italian Firms”, by the IMF].
• “Productivity dispersion in the United States has expanded in recent years, which means that a wider gap exists between these leading firms and the laggards.” While there are many questions about why this has occurred, the overall effect has been to depress MFP growth.
• Economists like Robert Gordon and John Fernald, “assert that the information technology (IT)-based innovations of recent decades are no match for the world-changing impacts of widespread electricity, the internal combustion engine, and indoor plumbing that emerged in the late 1800s and early 1900s. They claim that productivity growth cannot be expected to sustainably continue on the same high-growth trend that previously had been seen as of the mid-20th century. Furthermore, they regard the productivity speedup of the late 1990s and early 2000s as the true outlier and the subsequent low productivity growth as merely the expected case in this relatively lower innovation era. One underlying rationale for this potential story is provided by Joseph A. Tainter. This author offers that, in general, as complexity in a society increases following initial waves of innovation, further innovations become increasingly costly because of diminishing returns.”
• “Nicholas Bloom, Charles I. Jones, John Van Reenen, and Michael Webb [in their paper, “Are Ideas Getting Harder to Find?”] offer supporting evidence for this view regarding the United States, asserting that given that the number of researchers has risen exponentially over the last century—increasing by 23 times since 1930—it is apparent that producing innovations has become substantially more costly during this period”. See also, “A Global Decline in Research Productivity? Evidence from China and Germany” by Boeing and Hundermund, who find that, “diminishing returns in idea production are a global phenomenon, not just confined to the US.”
The productivity slowdown has occurred in most of the world’s economies. In 2017 the IMF its own investigation of this phenomenon, in “Gone with the Headwinds: Global Productivity.”
The key findings of this analysis included:
• “As in previous deep recessions, the aftermath of the global financial crisis in advanced economies has displayed “TFP hysteresis”—persistent TFP loss from a large and seemingly temporary shock. Three interrelated factors appear to be behind this pattern:
• “First, in contrast to past recessions, weak corporate balance sheets, combined with tight credit conditions, have undermined TFP growth, partly by constraining investment in intangible assets in distressed firms. In a number of advanced economies, the boom-bust financial cycle and its corollary of weak corporates and banks has also increased misallocation of capital within and across sectors.
• “Second, an adverse feedback loop of weak aggregate demand, investment, and capital-embodied technological change seems to have afflicted the advanced economies.
• “Third, elevated economic and policy uncertainty may have further weakened TFP growth, partly by tilting investment away from higher-risk, higher-return projects.”
• “Crisis-related factors added to important structural headwinds that have been dragging down global TFP growth since before the crisis, particularly including a waning information and communication technology (ICT) boom in the most advanced economies and its spillovers to other economies; an aging workforce, especially in advanced economies; slower human capital accumulation; and slowing global trade integration—including the maturing of China’s integration into world trade.”
• Over the medium term, productivity prospects are highly uncertain. A revival driven by artificial intelligence and other breakthroughs is conceivable, although its magnitude and timing are difficult to predict. Until then, and even if crisis legacies are addressed, productivity growth is unlikely to return to the higher rates of the late 1990s (for advanced economies) or the mid-2000s (for emerging and developing economies) given the structural headwinds.”
A third investigation of the causes of slowing productivity growth was conducted by the Bank of England in 2017. It’s key findings were reported in a speech (“Productivity Puzzles”) by Andrew Haldane, its Chief Economist.
Key findings included:
• “The global productivity slowdown is clearly not a recent phenomenon. It appears to have started in many advanced countries in the 1970s.”
• “The empirical evidence suggests a long tail of countries and companies with low, slow productivity growth. These productivity laggards have been unable to keep-up, much less catch-up, with frontier countries and companies.7 At the same time, an upper tail of companies and countries has maintained high and rising levels of productivity. These productivity leaders are pulling ever-further away from the lower tail. Or, put differently, rates of technological diffusion from leaders to laggards have slowed, and perhaps even stalled, recently.”
• “This empirical pattern sheds light on the two great macro-economic debates. It helps explain why we might see the co-existence of secular innovation (among leaders) and stagnation (among laggards). It helps account for the fall in productivity growth rates – namely, slower rates of diffusion of new innovation to the long lower tail of companies. And it helps explain the widening dispersion in households’ incomes, as the mirror-image of widening productivity differences across firms.”
• Haldane addressed the claim by some that, because of the changed nature of the digital economy (e.g., services like Facebook are given away for free in exchange for individuals’ data), actual productivity growth may be higher than what captured using current metrics. “It certainly seems likely that official statistics underestimate economic activity to some, perhaps significant, degree and with it potential productivity gains. For example, a recent review concluded that productivity growth in the UK might be under-estimated by around 0.5 percentage points per year, as a result of the failure fully to capture elements of the digital economy.
• “That said, most studies have also found that mismeasurement alone is unlikely to account for the majority of the productivity puzzle, whether in the UK or internationally. Many of the mismeasurement problems already existed long before productivity started slowing. These problems would need to have increased dramatically – and probably unrealistically – to explain fully the productivity slowdown. Consistent with that, the slowdown in productivity appears to be largely unrelated to the penetration of information technologies across sectors and countries.”
• “There is plenty of evidence to suggest that financial crises can have a permanent, or certainly persistent, scarring effect on output and productivity in economies. This time’s crisis [the GFC], the largest in at least a generation, is unlikely to buck that historical trend. There are several channels through which financial crises might permanently damage corporate sector productivity.
• “A collapse in credit availability is likely to constrict the financing of both new and existing companies and hence constrain their investment plans. It may hit particularly hard young companies, without access to alternative sources of finance, for whom productivity growth is often fastest. Empirical evidence from the crisis suggests these channels were potent, in the UK and internationally. As credit conditions have eased recently, however, this has become a less compelling explanation for persisting productivity problems.
• Another channel through which the crisis might have slowed productivity is by hindering resource reallocation between firms and across sectors. Flows of capital and labour between companies are one of the key channels through which technology and ideas are diffused. Since the crisis, rates of labour market churn between companies have been low and the dispersion in rates of return across sectors has been high. Both are consistent with lower rates of factor reallocation having contributed to low productivity.”
• Haldane also addressed the hypothesis that by keeping alive “zombie companies” that would other wise have failed (in order to avoid a potential “debt deflation”), central have contributed to the productivity slowdown. “Some have contended that productivity may have been held back by the actions of the authorities, in particular regulatory forbearance and accommodative monetary policies. By supporting low-productivity companies who would otherwise have failed, policy actions may have prevented the “creative destruction” of firms. Certainly, the level of company liquidations and firm exits has remained low in many countries since the financial crisis, probably lower than would have been expected given the path of GDP.”
• “Some economists believe that the type of technological progress behind productivity growth over the past two centuries may not continue at the same pace in the future. One argument is that the current wave of innovation, grounded in ICT [Information and Communication Technologies], does not have the same potential as past innovations. A second is that the ICT revolution is already quite mature and that future progress is likely to be slower. A third is that, with world population expected to peak this century, so too might the pace of innovation.
• “These arguments are contentious and have been the subject of lively debate. Some have argued that the ICT revolution has already had a greater impact on productivity than the steam engine. Others have argued that the ICT revolution is still in its infancy and has vast potential for further disruptive innovation. And a third contends that there are many emerging technologies with the potential to revolutionise the economy, such as robotics, artificial intelligence, Big Data and the human genome.”
• Haldane pays particular attention to the potential impact of slowing technology diffusion across industries and companies on their respective rates of productivity growth. “One way of understanding this global productivity slowdown comes from decomposing it into changes in rates of innovation among countries operating at the productivity frontier and changes in rates of diffusion from frontier to non-frontier countries… If the frontier country is taken to be the United States, then slowing innovation can only account for a small fraction of the global slowing, not least because the US only has about a 20% weight in world GDP. In other words, the lion’s share of the slowing in global productivity is the result of slower diffusion of innovation from frontier to non-frontier countries.”
• “There are a number of possible explanations for such a [diffusion] phenomenon. Stifled competition in certain sectors and for certain products may have prevented the trickle-down of innovation. For example, restrictions on patents and intellectual property (IP) might restrict new entrants and retard replication. A related hypothesis is that, in today’s globalised markets, network economies of scale and scope are more potent, generating natural monopolies in which single or small sets of players dominate market share.”
• “A third hypothesis is that the emergence of a long tail of non-frontier companies, failing to keep pace with innovation, is the result of management failings. For example, Nicholas Bloom and John Van Reenen have shown that weaknesses in management processes and practices go a long way towards explaining the long tail of low productivity companies… Looked at quantitatively, there is a statistically significant link between the quality of firms’ management processes and practices and their productivity. And the effect is large. A one standard deviation improvement in the quality of management raises productivity by, on average, around 10%. This suggests potentially high returns to policies which improve the quality of management within companies.”
• Note that this last point is a subset of another hypothesis. To realize the productivity benefits of the increasing sophistication of technologies, firms need employees with higher skills (e.g., see, “Literacy and Growth: New Evidence from PIAAC”, by Schwerdt et al). In so far as education and training systems are failing to provide enough of the latter, the full productivity benefits of new technologies won’t be realized. Instead, they will be concentrated in those firms that are best able to attract scarce (e.g., see “The Tech Talent Scramble” by Pedro da Costa from the IMF and “The Global Talent Crunch” by Korn Ferry). In turn, the competitive advantage provided by advanced technologies and scarce talents will enable those firms to increase market share, leading to more industry concentration (e.g., see, “Ten Facts on Declining Business Dynamism and Lessons from Endogenous Growth Theory”, and “What Happened to US Business Dynamism?” both by Akcigit and Ates).
• Other authors have found that network economic effects (in which early leads compound) and much more aggressive use of intellectual property protection have also contributed to the widening gap in many industries between leaders and laggards.
• Haldane continues, “some further insight into these puzzles comes from looking at the productivity data in more granular detail. We start by considering sectoral patterns of productivity among UK companies.
• Sectoral shifts in the economy could plausibly account for some of the fall in productivity growth. There has been a secular shift over time away from agriculture to manufacturing and now towards services…Because productivity growth in manufacturing is higher than in services, this shift could plausibly account for some of the fall in aggregate productivity growth. And even within services, there are wide productivity differences [e.g., some studies show that productivity in healthcare and education has been declining, even as they have accounted for a rising share of GDP – e.g., see “Structural Change Within the Service Sector and the Future of Baumol Disease” by Duernecker et al]. Haldane notes, however, that, “even if we correct for this compositional effect, the slowdown in UK productivity growth remains.”
• “The dispersion of productivity across industries has increased significantly over the last 40 years. And the variance in sectoral productivity gaps, relative to pre-crisis trends, also increased sharply after the 2008 crisis. Nonetheless, this pickup in the dispersion of productivity across sectors is dwarfed by the increase in productivity dispersion within sectors. This suggests that any obstacles to the movement of resources within the economy have been more important within sectors than across them.”
• “There has been a widening dispersion in the distribution of productivity across companies over time. In particular, there is a striking and widening divergence between frontier firms (say, the 99th percentile of firms) and the long tail of non-frontier companies. If we define frontier firms as the top 5% of firms by productivity performance, in line with the OECD, there is clear and widening blue water between frontier and laggard companies. In arithmetic terms, it is non-frontier companies that largely explain flat-lining productivity over recent years.
• “These dynamics cast the secular innovation versus stagnation debate in an interesting light. The distribution of UK companies’ productivity suggests both forces have been operating, albeit at different points in the distribution – innovation in the upper tail, stagnation in the lower one. Widening productivity dispersion means that secular innovation and stagnation are complementary, not competing, hypotheses.
• “For a relatively small cohort of frontier companies, secular innovation is clearly evident, with both high and rapidly-rising levels of productivity. For example, around 1% of UK firms have seen average productivity growth of around 6% per year. This poses a serious challenge to the notion that stalling innovation has been the key driver of the productivity slowdown. At the same time, for a large cohort of non-frontier companies secular stagnation is evident, with low and flat-lining levels of productivity. For example, around one-third of UK companies have seen no rise in productivity throughout this century. This is a long tail.
• “A second implication of these results, consistent with the cross-country evidence, is that rates of technological diffusion from frontier to non-frontier companies appear to have slowed. It is stalling diffusion, rather than stifled innovation, that accounts for the UK’s productivity puzzle. These patterns are not unique to the UK. They are shared by a number of other countries internationally.”
In 2018, the OECD commissioned a special report on the determinants of technology diffusion across firms (“Going Digital: What Determines Technology Diffusion Across Firms?” by Andrews et al). The authors report “strong support for the hypothesis that low managerial quality, lack of ICT skills and poor matching of workers to jobs curb digital technology adoption and hence the rate of diffusion.
* “Similarly our evidence suggests that policies affecting market incentives are important for adoption, especially those relevant for market access, competition and efficient reallocation of labour and capital.
* “Finally, we show that there are important complementarities between the two sets of factors, with market incentives reinforcing the positive effects of enhancements in firm capabilities on adoption of digital technologies.”
Another important analysis that bears on falling productivity is “The Corporate Erosion of Capitalism”, by Oren Cass. It presents “a systematic, firm-level study of declining business investment and the recent transformation of the typical American corporation’s business strategy to one that disgorges cash to shareholders while failing to replenish its capital base.” The financialization of capitalism and the decline in capital investment is almost certainly another root cause of the decline in productivity.
A final root cause was suggested by Brynjolfsson, Rock, and Syverson. In “The Productivity J-Curve” they observe that, as I saw firsthand in the eighties and nineties, the realization of the full productivity benefits of advanced technology investments took longer than many companies anticipated, because of the time it took to make necessary and complementary organizational changes (e.g., in processes, systems, structure, and staff skills). Brynjolfsson et al believe the same process is underway again today.
Consulting Firms’ Recent Analyses of the Prospects for Productivity Growth
In the past three years, consulting firms have published a number of analyses of future productivity growth. They are interesting because unlike most productivity studies by economists, they are based on firm-level data.
In 2017, McKinsey published “New Insights into the Slowdown in US Productivity Growth”. Its key findings included:
• “We have a numerator problem: Value-added growth has been declining Not all productivity growth is the same. A simple decomposition of labor productivity into two components, value added as the numerator and hours worked as the denominator, reveals there can be underlying differences in the composition of the resulting productivity growth number. Improvements in productivity can be achieved by efficiency gains, reducing inputs for a given output, or increasing the volume or value of output for any given input. An economy needs both to spur robust growth and prosperity. Efficiency gains are important not only for cost competitiveness at the company, sector, and national levels but also for facilitating the movement of labor and capital to new and growing sectors.
• “Meanwhile, value-added growth, improving the quality and volume of goods and services, facilitates a virtuous cycle of growth whereby increases in value added drive rising incomes that in turn fuel demand for more and better goods and services.
• “Looking closely at labor productivity growth, we find differences in the role the denominator, hours-worked growth, and the numerator, value-added growth, have played in recent years. For example, the period between 1995 and 2004 is considered an era of high growth with annual productivity growth averaging about 3 percent. However, we have found two distinct periods within this decade. The first is from 1995 to 2000 when productivity growth spiked, driven primarily by an increase in growth of real value-added output. Value-added output growth for the total economy, which averaged 3.4 percent annually from 1991 to 1995, increased to 4 percent from 1995 to 2000, a period of booming consumer and IT spending. As a result, productivity growth increased from 1.4 percent to 2.0 percent.
• “The subsequent era of 2001 to 2004 was a period of continued high productivity growth, averaging 3.6 percent a year. However, the underlying driver was a decline in hours worked growth, which fell to negative 0.2 percent partly as a result of the tech crash and the restructuring wave in manufacturing of the early 2000s. So while these two periods are typically treated as a single period of booming productivity growth, we prefer to separate them as the implications for investment, industry evolution, and job expansion are very different…
• “What is striking about productivity growth after the recession ended in 2009 has been low value-added output growth compared with past periods. Growth in real value-added output has declined to 2.2 percent between 2009 and 2014. This compares to growth of roughly 3 to 4 percent in prior time periods. So far there is a lack of consensus about the reason for that stagnation. Is it due to a debt overhang from the recession? Or rising inequality reducing the share of those most likely to spend their income—in other words is consumer and household demand the problem? Or perhaps tightening regulation reducing company incentives to invest? …
• “Understanding the components of aggregate trends is important because industries vary widely in their productivity levels and growth patterns. One longer-term trend behind slower productivity growth, for example, is the shift in employment from manufacturing to service-sector jobs. We calculate that this shift reduced productivity growth by 0.2 percentage points every year for the private business sector between 1987 and 2014, as employment transitioned from high-productivity manufacturing sectors to lower-productivity sectors such as health care and administrative and support services.
• “The shift in the composition of the economy to service sectors raises important questions for productivity growth going forward. What are the drivers of productivity growth in the service sector and how can productivity in these industries be enhanced going forward?...
• “Weak capital intensity growth has occurred across all types of capital In the period from 1995 to 2004, there was a boom in capital intensity growth across most assets, particularly in information capital and software. This period is associated with high labor productivity growth. What is striking is that the most recent period, 2009 to 2014, coincides with both exceptionally low productivity growth and low capital intensity growth across all types of assets…
• “Digitization rates are uneven across sectors—the least digitized tend to be larger sectors often with relatively low productivity As productivity growth trends vary by sector, so do trends in digitization. A closer look at digitization across sectors reveals distinct variations and uneven progress… We calculate that Europe overall operates at only 12 percent of digital potential, and the United States at 18 percent, with large sectors lagging in both. While the ICT, media, financial services, and professional services sectors are rapidly digitizing, other sectors such as education, health care, and construction are not …
In 2018, McKinsey published a deeper look at this last issue, “Solving the Productivity Puzzle: The Role of Demand and the Promise of Digitization.” Key findings included:
• “We calculate that the productivity growth potential [of increased digitization] could be at least 2 percent per year across countries over the next decade. However, capturing the productivity potential of advanced economies may require a focus on promoting both demand and digital diffusion” …
•
• [The benefits of digitization] “have not yet materialized at scale. This is due to adoption barriers and lag effects as well as transition costs… While the first wave of ICT investment starting in the mid-1990s was mostly from using technology to deliver supply-chain, back-office, and later front-office efficiencies, today we are experiencing a new way of digitization that comes with a more fundamental transformation of entire business models and end-to-end operations…
• “There is no guarantee that the productivity-growth potential we identify will be realized without taking action. While we expect financial crisis–related drags to dissipate, long-term drags may continue, such as a rise in the share of low-productivity jobs and slackening demand for goods and services due to changing demographics and rising income inequality; all of these factors may be further amplified by digitization. At the same time, the nature of digital technologies could fundamentally reshape industry structures and economics in a way that could create new obstacles to productivity growth. The amplification of demand drags and the potential industry-breaking effects of digital may limit the productivity-growth potential of advanced economies…
• “There is concern that some demand drags may be more structural than purely crisis-related. There are several “leakages” along the virtuous cycle of growth. Broad-based income growth has diverged from productivity growth, because declining labor share of income and rising inequality are eroding median wage growth, and the rapidly rising costs of housing and education exert a dampening effect on consumer purchasing power. It appears increasingly difficult to make up for weak consumer spending via higher investment, as that very investment is influenced first and foremost by demand…
• “Demographic trends may further diminish investment needs through an aging population that has less need for residential and infrastructure investment. These demand drags are occurring while interest rates are hovering near the zero lower bound. All of this may hold back the pace at which capital per worker increases, impact company incentives to innovate, and thus negatively impact productivity growth, slowing down the virtuous cycle of growth…
• “New digitally enabled business models can also have dramatically different cost structures that change the economics of industry supply significantly and raise questions about whether the majority of companies in the industry and the tail will follow the frontier as much as in the past. For example, in retail, productivity growth in the late 1990s and early 2000s was driven by Tier 2 and 3 retailers replicating the best practices of frontier firms like Walmart. Today, it is unclear if many of Amazon’s practices can be replicated by most other retailers, given Amazon’s large platform and low marginal cost of offering additional products on its platform.”
In another report published in 2018, “Labor 2030: The Collision Of Demographics, Automation And Inequality”, Bain & Company raised similar concerns:
• “Demographics, automation and inequality have the potential to dramatically reshape our world in the 2020s and beyond. Our analysis shows that the collision of these forces could trigger economic disruption far greater than we have experienced over the past 60 years… By the end of the 2020s, automation may eliminate 20% to 25% of current jobs, hitting middle- to low-income workers the hardest. As investments peak and then decline— probably around the end of the 2020s to the start of the 2030s—anemic demand growth is likely to constrain economic expansion, and global interest rates may again test zero percent. Faced with market imbalances and growth-stifling levels of inequality, many societies may reset the government’s role in the marketplace.”
In March 2021, in “Will Productivity and Growth Return After the COVID-19 Crisis?” McKinsey warned that,
• “The economic shock of the pandemic and the response of companies could exacerbate long-run structural demand drags. Our sector-level evidence suggests that 60 percent of the productivity potential prioritizes efficiency over output growth. Accelerated digitization and automation by firms, added to superstar effects, could hasten income polarization and declines in labor share, leading to a “great divide” among both firms and workers.
• “Prepandemic demand, specifically consumption and investment, was structurally weak, and efficiency-focused actions could now weaken it further. After a potential initial consumer-led bounce-back, pressures on employment and income could hold back consumption, which, coupled with uncertainty, could hold back investment… Productivity growth could remain low if most firms do not invest and those that do struggle to grow.”
Finally, in a report last month, McKinsey found that the gap between digital leaders and laggards has been widening (“Tipping The Scales In AI: How Leaders Capture Exponential Returns”):
• “AI leaders hire 65 percent more AI-related workers than other companies do“…
• “Only a small number of businesses have figured out how to make AI work in these ways. Our survey of some 800 companies in the technology, media, and telecommunications (TMT) sectors globally found that just 10 percent of companies are on this path. The rest remain mired in the low to middling stages of maturity, with laggards making up 60 percent of the population and aspirants 30 percent. Underperformers can change their arc, but the window of opportunity to do so is narrowing. Waiting to redouble efforts in AI until the many disruptions of the pandemic begin to dissipate will put laggard companies at a long-term competitive disadvantage because the trajectory that leaders are on will lead to accelerating gains.”
What Policies Have Been Proposed to Overcome The Root Causes of Slow Productivity Growth?
| Root Cause | Examples of Policy Proposals |
| Weak current demand and uncertainty about future demand have inhibited R&D spending and capital investment to deploy new technologies | • Increased fiscal and monetary stimulus after COVID • Policies to reduce income inequality • Given the private sector’s shift in resources from basic science to applied research and commercialization, return government spending on basic science (as a percent of GDP) back to the levels it was at during the high productivity growth era in the 1960s. |
| Combination of need for better infrastructure (e.g., expanded high speed broadband access, both wired and wireless/5G), and need to replace old infrastructure that is in poor condition (e.g., roads, bridges, hospitals, schools). | • Biden Administration’s proposal for a substantial increase in infrastructure investment |
| Productivity of national innovation processes is declining. | • Proposals to change the way government grant funding is awarded • Proposals for direct government funding of innovation in areas that are not attractive to venture capital investors (e.g., upgrading the US electrical grid) |
| Financialization of the economy, including, for example, the rise of private equity, greater use of debt, and higher demands for return of cash to investors via stock buybacks, has reduced capital investment that embodies new technologies. | • Revert to pre-2002 ban on stock buybacks in the US • Eliminate tax deduction for interest expense • To encourage long-term investment, decrease capital gains tax rate with length of holding period (e.g., “Patient Capital” Review in UK) |
| Current debt levels inhibit capital investment that embodies new technologies as well as the efficient reallocation of resources from low to high productivity sectors and firms. | • Streamline bankruptcy and reorganization processes, including restrictions on complex capital structures, credit derivatives, and long draw out legal battles that increasingly characterize insolvency proceedings in developed countries. |
| Network Effects drive “Superstar Firm” phenomenon that reduces competition and thus investment in new productivity increasing technologies. | • Antitrust investigations are currently underway involving Facebook, Amazon, Alphabet/Google and other large technology companies that have leveraged network effects to gain large market share that, in turn, some claim created a “kill zone” within which these large players will acquire new entrants before they can become threats (e.g., see, “American Tech Giants are Making Life Tough for Startups” in The Economist). |
| Adverse changes in institutional structure and regulation (e.g., IP protection, environmental, labor, licensing, and land use regulations etc.) have resulted from an intensifying search by many companies for new barriers to competition and higher economic rents, which have reduced business dynamism and the amount of investment in new technologies. | • Proposals to reduce the complexity of the tax code and other regulatory structures, make anti-trust action easier, and put more restrictions on companies’ ability to lobby government and finance political campaigns. |
| Slow diffusion of productivity increasing innovations and technologies across industry sectors, and across firms within industry sectors (this is both an effect of other drivers, and a cause in itself). | • Weaken intellectual property protections • The UK Productivity Commission proposed making firm-level productivity data visible to the public to strengthen companies’ incentive to improve • Create the management equivalent of the US Agricultural Extension Service to help companies in the “low productivity long tail” improve their management practices |
| Talent shortages (technical and managerial) constrain the diffusion of more productive new technologies. | • Improve the performance of primary/secondary (i.e., K-12), tertiary (i.e., university), and technical education and certification programs, as well as reskilling programs and labor market information systems • Leverage lessons learned during the pandemic about “working from home” to outsource higher value added cognitive work to lower cost talent located around the world |
| Changing structure of the economy – a growing share of GDP now comes from sectors with low/no/negative productivity growth like healthcare, education, and many personal services | • Subsidize technology adoption in healthcare and education • Increase competition in these sectors |
| Reduced international trade limits pressure on companies that drives investment in productivity increasing technologies and other changes. | • Given the increasing conflict between the United States and China, and associated demands for reshoring supply chains, it does not look like increased exposure to international competition will be a future driver of productivity increases. |
| | |
| | |
Critical Uncertainties, Scenarios, and Probabilities
The number of root causes listed in the above table, and the complexity of the proposed solutions (not to mention the obstacles to enacting them and then implementing at scale) do not paint an encouraging picture of the chances for a significant increase in productivity growth in the years ahead.
In developing alternative future scenarios, our starting point is Andrew Haldane’s conclusion, with which we strongly agree: “It is stalling diffusion, rather than stifled innovation, that accounts for the UK’s productivity puzzle. These patterns are not unique to the UK. They are shared by a number of other countries internationally.”
In turn, the diffusion of advanced technology and other innovations across sectors and companies within them fundamentally depends on two critical drivers: (1) Investments that embody them, and (2) human capital to maximize their potential benefits (with human capital broadly construed to include individual knowledge and skills, as well as organizational processes and structures).
This leads to four broad productivity scenarios based on how uncertainties involving the quantity of investment (high/low) and the supply of high quality human capital (high/low) are resolved in the future.
In May 2021, I estimate the following probabilities for how these two critical uncertainties will evolve over the next 36 months:
• Demand and Investment Growth: High (20%), Low (80%)
• Growth in Supply of Talent: High (40%), Low (60%)
This logically leads to the following four scenarios and associated probabilities:
Scenario #1: The Best of All Worlds: High Growth and Investment with an Increased Supply of Talent Leads to Sustained Increase in Productivity (Probability = 8%)
• High investment with a high supply of high quality human capital.
• High investment requires not just a shot of short-term fiscal and monetary stimulus, but also reduced uncertainty about future demand growth. In turn, this depends on the US/China conflict not worsening, and on overcoming a number of daunting obstacles facing the economy today, including high levels of inequality and indebtedness, and reversal of the intense financialization of the economy and rise of “rentier capitalism” that have developed over the past forty years. It will also very likely require more aggressive action to increase competition in some industries, which may be difficult because of network economic effects that lead to concentration in some digital industries.
• There are a number of ways the talent shortage could be overcome, including using technology like Zoom and Teams to move more high value added work offshore, increasing the number of skilled immigrants (as Canada and Australia do with their talent-based immigration systems), reskilling existing employees (a difficult challenge as we noted in last month’s feature article), and/or substantially improving the performance of America’s K-12 education system (which makes fixing reskilling look like a walk in the park).
• This scenario also requires productivity improvements in large sectors of the economy – like healthcare and education – that have, up to now, vigorously resisted them.
Scenario #2: Stronger Demand and Investment Growth, But with a Talent Constraint that Limits Diffusion and Overall Productivity Improvement (P = 12%)
• In this scenario, the benefits of stronger demand and productivity growth are largely captured by current industry leaders that continue to attract and leverage scarce talent.
• As a result inequality worsens, which eventually undermines the initial strong growth in demand and investment.
• At the same time, the initial strong growth of demand in the face of constrained productivity improvements by many suppliers would likely cause a short-term increase in inflation.
Scenario #3: Weak Demand and Investment Growth Limits the Positive Productivity Impact of an Increase in the Supply of Talent (P = 32%)
• The increase in potential supply relative to demand, along with increasing debt servicing problems, increases the strength of deflationary forces.
Scenario #4: The Worst of All Worlds: Weak Demand Growth and Constrained Talent Lead to No Increase or a Decline in Productivity (P = 48%)
• This is Larry Summers’ “Secular Stagnation” scenario.
• It would also strengthen deflationary forces, via the existing channels of rising inequality, weakening competition in many industries, and increasing debt servicing problems.
The number of root causes listed in the above table, and the complexity of the proposed solutions (not to mention the obstacles to enacting them and then implementing at scale) do not paint an encouraging picture of the chances for a significant increase in productivity growth in the years ahead.
In developing alternative future scenarios, our starting point is Andrew Haldane’s conclusion, with which we strongly agree: “It is stalling diffusion, rather than stifled innovation, that accounts for the UK’s productivity puzzle. These patterns are not unique to the UK. They are shared by a number of other countries internationally.”
In turn, the diffusion of advanced technology and other innovations across sectors and companies within them fundamentally depends on two critical drivers: (1) Investments that embody them, and (2) human capital to maximize their potential benefits (with human capital broadly construed to include individual knowledge and skills, as well as organizational processes and structures).
This leads to four broad productivity scenarios based on how uncertainties involving the quantity of investment (high/low) and the supply of high quality human capital (high/low) are resolved in the future.
In May 2021, I estimate the following probabilities for how these two critical uncertainties will evolve over the next 36 months:
• Demand and Investment Growth: High (20%), Low (80%)
• Growth in Supply of Talent: High (40%), Low (60%)
This logically leads to the following four scenarios and associated probabilities:
Scenario #1: The Best of All Worlds: High Growth and Investment with an Increased Supply of Talent Leads to Sustained Increase in Productivity (Probability = 8%)
• High investment with a high supply of high quality human capital.
• High investment requires not just a shot of short-term fiscal and monetary stimulus, but also reduced uncertainty about future demand growth. In turn, this depends on the US/China conflict not worsening, and on overcoming a number of daunting obstacles facing the economy today, including high levels of inequality and indebtedness, and reversal of the intense financialization of the economy and rise of “rentier capitalism” that have developed over the past forty years. It will also very likely require more aggressive action to increase competition in some industries, which may be difficult because of network economic effects that lead to concentration in some digital industries.
• There are a number of ways the talent shortage could be overcome, including using technology like Zoom and Teams to move more high value added work offshore, increasing the number of skilled immigrants (as Canada and Australia do with their talent-based immigration systems), reskilling existing employees (a difficult challenge as we noted in last month’s feature article), and/or substantially improving the performance of America’s K-12 education system (which makes fixing reskilling look like a walk in the park).
• This scenario also requires productivity improvements in large sectors of the economy – like healthcare and education – that have, up to now, vigorously resisted them.
Scenario #2: Stronger Demand and Investment Growth, But with a Talent Constraint that Limits Diffusion and Overall Productivity Improvement (P = 12%)
• In this scenario, the benefits of stronger demand and productivity growth are largely captured by current industry leaders that continue to attract and leverage scarce talent.
• As a result inequality worsens, which eventually undermines the initial strong growth in demand and investment.
• At the same time, the initial strong growth of demand in the face of constrained productivity improvements by many suppliers would likely cause a short-term increase in inflation.
Scenario #3: Weak Demand and Investment Growth Limits the Positive Productivity Impact of an Increase in the Supply of Talent (P = 32%)
• The increase in potential supply relative to demand, along with increasing debt servicing problems, increases the strength of deflationary forces.
Scenario #4: The Worst of All Worlds: Weak Demand Growth and Constrained Talent Lead to No Increase or a Decline in Productivity (P = 48%)
• This is Larry Summers’ “Secular Stagnation” scenario.
• It would also strengthen deflationary forces, via the existing channels of rising inequality, weakening competition in many industries, and increasing debt servicing problems.
If you have any questions about anything we have written in this issue, please don’t hesitate to get in touch, at contact@indexinvestor.com