The Index Investor
September 2020
Tactical Asset Allocation Implications of Our Forecasts
Forecast Logic
Forecast Pre-Mortem Analysis
Combining and Extremizing Forecasts to Improve Predictive Accuracy
Feature Article: An Assessment of COVID-19 Vaccine Uncertainties and Probabilities
High Value Information Observed Last Month:
- Technology
- Energy and Environment
- Health and Disease
- Economy
- National Security
- Society
- Politics
- Financial Markets and Investor Behavior
Critical System Thresholds/Tipping Points Analysis
Appendix: Anticipatory Thinking and Forecasting Methodologies
Current Macro Forecast
Over the next twelve months, evidence will very likely continue to accumulate that the real economy is in worse shape that equity market investors apparently believe.
As cold weather returns to the northern hemisphere, COVID cases will likely increase, assuming more people congregate in enclosed areas with insufficient ventilation and other measures to limit the accumulation of coronavirus aerosols to a level that can trigger superspreader events. The interaction of COVID and influenza infections risks overloading hospitals, and, more dangerously, recombinations of viral material when a person is infected with both viruses, with very unpredictable results.
Bankruptcies continue to increase; in the case of small and medium enterprises, this is often leading not to Chapter 11 restructurings but Chapter 7 liquidations, which represent a permanent loss of jobs and productive human and physical capital.
The continuing failure of the politically polarized US Congress to pass another stimulus plan will very likely accelerate these trends. Recent studies have also found that in the US company support programs have been very inefficient, and it would have been better to directly provide support to individuals.
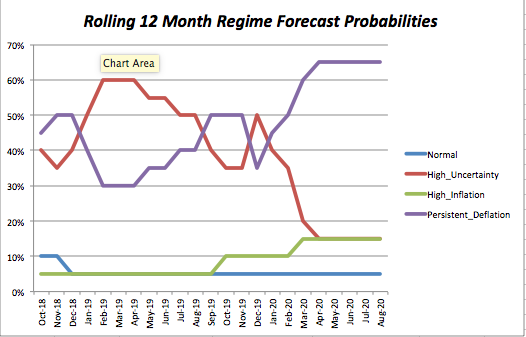
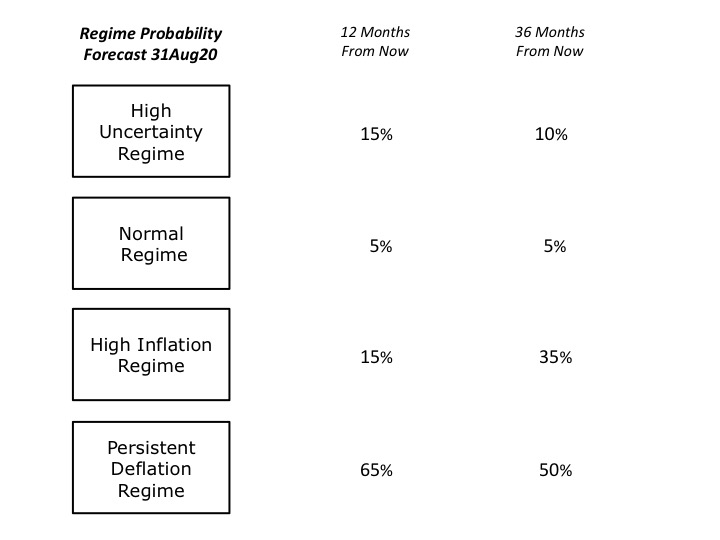
We have made no change to our 36-month regime forecasts. The probability the United States will be in the Persistent Deflation Regime remains 50%, as evidence continues to accumulate that the economy will very likely suffer a deeper and longer downturn than many investors currently expect.
It also seems very likely that the US will experience a constitutional crisis after the November election. This will sharply increase uncertainty, with its attendant negative impact on the economy. At this point, it does not appear that this has been fully incorporated into asset market prices.
It is also still very likely that the probability of an intensifying political crisis in the United States regardless of who is eventually sworn in as the nation’s next president has not yet been fully incorporated into the dominant narratives driving current asset class valuations.
August saw intensifying rioting and looting in the United States, as well as Democratic and Republican Conventions that left many voters underwhelmed. Neither party managed to give people what they most need in a crisis: Truth and Hope.
This past month, China took further aggressive actions, including swift implementation of the new national security law in Hong Kong, arrest of a well-known Australian-Chinese journalist (in a further display of its penchant for “hostage diplomacy”), and increased intrusions by military jets into Taiwanese airspace. Also, evidence continues to accumulate that the COVID-19 pandemic was caused by a lab accident at the Wuhan Institute of Virology (from which China continues to bar international teams investigating the origin of the virus). If this continues, a tipping point will be reached and this will become the dominant narrative, which will almost certainly further increase conflict between China and many other nations.
Finally, it is important to keep in mind that the headwinds that were restraining aggregate demand growth before the devastating arrival of the COVID-19 pandemic either have not improved or are worsening. These include slower population growth and faster aging (which was further emphasized in August by a new report on declining US fertility), weak productivity growth, declining labor share of GDP, rising levels of both inequality and debt, and the growing threat of job displacement as increasingly capable automation and artificial intelligence technologies are deployed.
As students returned to a mix of online, hybrid, and in-person schooling in the northern hemisphere, it is not at all clear that education leaders have grasped the extent of learning losses students have suffered as a result of various pandemic related disruptions, much less the urgency of recovering them. If this does not happen, the negative impact on future productivity growth could be substantial, at a time when that growth will be more important than ever.
Our 36-month forecast probability for being in the High Inflation Regime remains at 35%.
Whether the High Inflation Regime comes to pass will depend on the interaction between COVID19’s shocks to demand and supply, along with even more important political factors. New analyses this month have found that the former has been much more severe, which, for now, makes a sudden increase in inflation less likely than deflation.
In our view, the most logical cause of a return to the High Inflation regime over the next 36 months would be a crisis of confidence in the US government and/or economy that causes a flight from the US dollar and a sharp rise in the price of imported goods (and very likely gold as well).
Another potential cause of such a crisis would be the outbreak of open conflict between the China and the United States (e.g., a Chinese invasion of Taiwan or rapid escalation of a kinetic encounter in the South China Sea) in which American forces were defeated and/or global supply chains were severely disrupted.
Finally, at the 36-month time horizon, our forecast probabilities for the High Uncertainty (10%) and Normal Regimes (5%) also remain unchanged. The former regime could occur if the Democrats win the White House and both houses of Congress in November, and struggle to revive the economy with good policy initiatives, but without an effective coronavirus vaccine while facing intensifying conflict with China.
Return to the Normal Regime would require the same political wins and policy initiatives, avoidance of new uncertainty shocks, early deployment of a highly effective vaccine, and a sharp reduction in US-China tensions (e.g., due to the removal of Xi Jinping from office).
In reviewing the current situation, we are again reminded that when uncertainty is high, people rely more heavily on social learning and copying what others are doing. Not only does this slow the diffusion of new information throughout social systems like economies and financial markets, but it also causes these systems to coalesce around a small number of increasingly fragile narratives. Under these conditions, rapid, non-linear changes are very likely to occur.
That certainly appears to be the case today in global financial markets.
Portfolio Allocation Implications of Our Forecast
We take two approaches to deriving the tactical asset allocation implications from our analyses (i.e., deviations from our "neutral" or base case model portfolio).
The first takes a systematic approach, and is based on relative asset class valuations. Our starting point is our neutral model portfolio, which is equally weighted across nine broad asset classes, and also includes 5% allocations to alpha strategies (equity market neutral and global macro) that are designed to have a low correlation to returns on broad asset classes.
Based on asset class valuations, we systematically vary the asset class weights (but not the active strategy weight), increasing from 10% to 15% when an asset class is likely undervalued, and 15% when it is very likely undervalued. In the case of overvaluations, we go to 5% and then into cash, if there are no undervalued asset classes with room for an increase. In effect, this replicates the systematic rebalancing strategy we used for 15 years in our previous model portfolios.Based on subscriber requests, this month we are re-introducing a feature from the previous version of The Index Investor: Tactical Asset Allocation Implications from our analyses.
The second tactical approach is based on our subjective view not only of current asset class valuations, but also of the implications of the broader macro trends and uncertainties that we analyze each month. Importantly, this subjective view reflects our primary goal of avoiding large downside losses, rather than seeking large upside gains.
Three final notes: First, with respect to US fixed income, we include credit products (investment grade and high yield) in the same asset class as government debt, and will shift into the former when their valuations become attractive.
Second, we regard gold not as a separate asset class to be held long-term, but rather as a complement to cash, into which we shift in periods of substantial overvaluation across multiple asset classes.
Third, we continue to be deeply concerned by the distortion in asset class valuations that have been created by negative real interest rates on sovereign bonds, which are the foundation of most asset pricing models. In August, we decided to address this distortion by using in our asset class valuation models our estimate of the economically logical real yield on inflation protected US government bonds (TIPs). This brings our quantitative valuation conclusions much closer to those based on our qualitative analysis.
More information about our investment beliefs, including our core philosophy, approach to asset allocation (including our model portfolios and their long-term track record), and views on various approaches to active and passive management can all be found here.
Here is our latest asset allocation view:
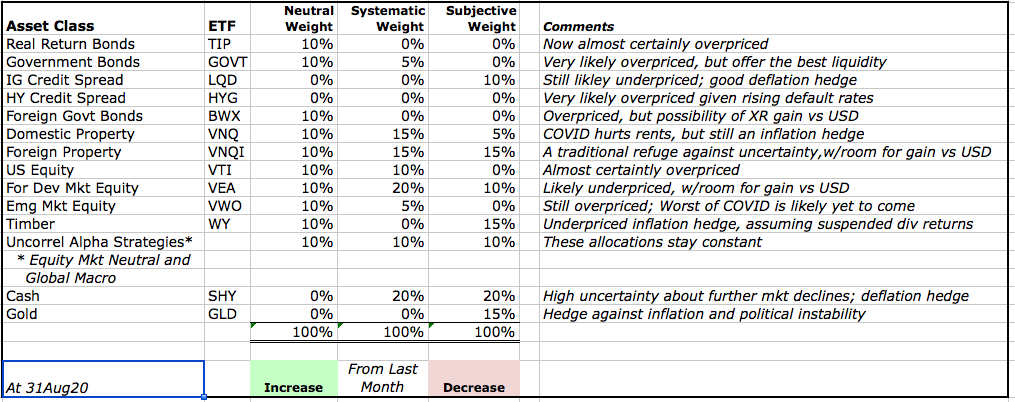
To expand our comment about timber. WY’s dividend was suspended when the COVID pandemic arrived. Up to that point, timber had very likely been undervalued. We assume the dividend will resume; hence it is very likely still is undervalued. However, if the dividend suspension is permanent, then it is almost certainly overvalued.
.
Forecast Logic: Quantitative Indicators
Implications of the Most Recent Three Month Asset Class Returns
Our quantitative forecast methodology focuses on the level and change in three-month returns, over the most recent and previous three-month periods, for those asset classes, which should perform best under different regimes (in this sense, our regimes can be regarded as macro factors). We assume that relatively higher returns are associated with more widely held investor belief in the probability that a given macro regime will develop in the future.
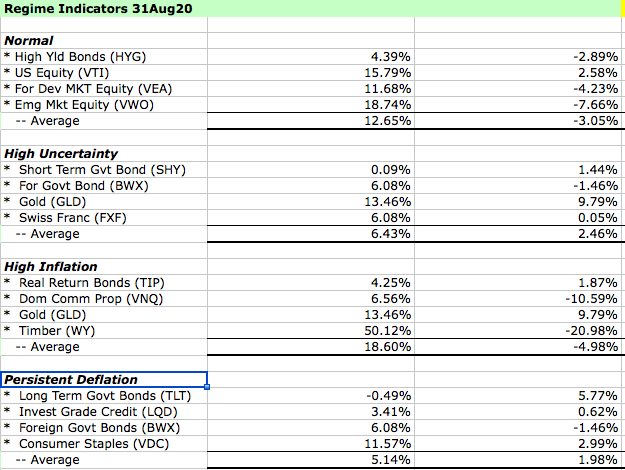
At the end of last month, rolling three-month returns on different asset classes implied that the marginal investor viewed the Normal and High Inflation regimes as the most likely to develop in the future, just as they did last month. As noted in our forecast, we disagree with this assessment, and the narratives on which it rests.
Asset Class Valuation and Momentum Indicators (@31Aug20)
| Asset Class (ETF) | Valuation | 1 Month Return | Conclusion |
| US Real Return Govt Bond (TIP) | Very Likely Overvalued* | 0.89% | Increasing Overvaluation |
| US Nom Return Govt Bond (GOVT) | Very Likely Overvalued* | (1.25)% | Decreasing Overvaluation |
| US Investment Grade Credit (LQD) | Likely Undervalued* | (1.77)% | Increasing Undervaluation |
| US High Yield Credit (HYG) | Very Likely Overvalued* | (0.02)% | Decreasing Overvaluation |
| US Commercial Property (VNQ) | Fairly Valued* | .44% | Fairly Valued |
| US Equity (VTI) | Almost Certainly Overvalued* | 7.10% | Increasing Overvaluation |
| Foreign Devel Mkt Equity (VEA) | Likely Undervalued* | 5.17% | Decreasing Undervaluation |
| Emerging Markets Equity (VWO) | Almost Certainly Overvalued* | 2.74% | Increasing Overvaluation |
| Timber (WY) | Almost Certainly Overvalued* (due to temporary dividend suspension) | 8.99% | Increasing Overvaluation |
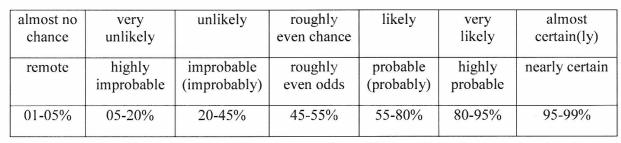
Note: The language we use to describe our estimated likelihood of asset class over or undervaluation is based on US Intelligence Community Directive 203 on Analytic Standards, which includes the following table:
Market Stress Indicators (@31Aug20)
| Market Stress Indicator | This Month vs Last Month |
| Asset Class Returns Autocorrelation (this month versus last month). Higher autocorrelation is an indicator of higher market stress. | .48 vs .79 the previous month. This indicates a decrease in the level of market stress. |
| Economic Policy Uncertainty Index (how many days over the last 30 was index in top quartile of values since 1985?). A higher number equals more market stress. | On 30 days last month (unchanged from the previous month) the index was in the top quartile of daily values since 1985 (the 99th percentile of all rolling 30-day periods). |
| AAA Rated Bonds Spread over 10 Year Treasury Yield (month end). Higher spreads indicate rising concern about market liquidity. | 1.70% (76th percentile since 1983), vs 1.48% at the end of the previous month, indicating a high and rising level of market stress. |
| BB Rated Bonds Spread over 10 Year Treasury Yield (month end). High spreads indicate increasing credit risk. | 3.54%, (56th percentile) unchanged from 3.55% last month. |
| Gold Price per Ounce in US Dollars (month end). Rising gold prices are an indicator of increasing market uncertainty and stress. | $1,955 vs $1,974, down (1%) from the previous month. At the end of 2017, we estimated the “disaster premium” in the gold price was 47% (see our methodology in the Appendix). At the end of last month it was 98%. |
New Qualitative Evidence
• Base on the largest seroprevalence study conducted to date (involving over 100,000 people), UK authorities estimated that only 6% of the population has had COVID-19. Other studies have concluded that between 45% and 60% of the population need to have COVID-19 antibodies in order to achieve so-called “herd immunity.” This means that vaccine must play a crucial role in achieving this. Unfortunately, as detailed in this month’s feature article, current optimism about the vaccines under development is very likely misplaced. If and when the current optimism is dashed, there will be another uncertainty shock to public confidence and financial markets.
• A number of new reports, including the US Department of Defense’s annual analysis of Chinese Military Power, concluded that China’s military capabilities are improving faster than many people realize, which significantly increases the chance of conflict with the United States. Urban rioting continued in the United States in August, with a critical red line being crossed when weapons were used by members of far right and far left groups to take each other’s lives. Martin Gurri, author of the book “The Revolt of the Public and the Crisis of Authority in the New Millennium” offered an insightful analysis in his article, “Why Were the Protests and Riots So Explosive?” “The riots connect to something bigger and deeper: The tectonic collision between a public empowered by digital platforms and the elites who control the ruling institutions of modern society”… “Protestors visions of the future diverge wildly, but they are united and mobilized by a shared loathing of the established order. They stand ferociously against … Any hint of a positive program would likely shatter the movement into its component war-bands, so revolt has come to mean an exercise in pure negation, in the repudiation of the status quo without an alternative in sight. At this point, the question of nihilism becomes impossible to avoid.”
• In the US, both the Democratic and Republican parties held their national conventions in August. Neither was able to provide the public with what people need to hear when confronted with unprecedented uncertainty and anxiety: Truth and Hope. This did not restore the public’s confidence in elites, which means that public opinion will likely be increasingly volatile in the runup to the November election, which Donald Trump still could win – however improbable that seemed not so long ago.
Pre-Mortem Analysis
One of the most important forecasting disciplines is to ask yourself why your forecast could be wrong. Dr. Gary Klein’s research has shown that a very powerful and insightful way to do this is via a “pre-mortem analysis.” This method asks you to assume that it is a point in the future, and your forecast has been proven wrong (or your strategy or company has failed). You are then asked to look backward from this imagined point in the future, to explain why you failed, what you missed, and what you could have done differently to avoid your fate.
The pre-mortem method takes advantage of the fact that humans reason much more concretely and in more detail when explaining the past than they do when trying to forecast the future.
So let us assume that it is one year from now, and our current forecast has turned out to be wrong.
How did this happen? What developments did we fail to anticipate?
- A number of world leaders – Xi Jinping and Donald Trump, and to a lesser extent Vladimir Putin and Ali Khamenei are all facing sharply weakened economies and declining political popularity. History teaches us that this can lead to increased “foreign adventurism” to distract the public from worsening domestic conditions, as a nation rallies around its leader in a period of heightened external conflict. Should a “kinetic” conflict develop between China and the United States, or Iran and Israel, Saudi Arabia, and/ or the US, or between Russia and one or more European countries (e.g., due to a Russian incursion into the Baltics), it would generate a very sharp increase in uncertainty that would likely accelerate the already sharp COVID-19 economic slowdown. Given given high debt levels, this would very likely accelerate the arrival of the Persistent Deflation Regime.
- On the other hand, the removal from office (by one means or another) of Xi Jinping or Donald Trump * could * lead to a reduction in the dangerously growing conflict between the two nations, and increase cooperation in both the fight against COVID19 and the recovery of the global economy. This would somewhat reduce the probability of both the Persistent Deflation and High Inflation Regimes, and raise the relative probabilities of the High Uncertainty and Normal Times Regimes.
- A supply side shock of some type – beyond the disruption of global supply chains caused by COVID-19 -- could produce a sudden increase in inflation. The most likely scenario is a reduction in oil supplies due to a prolonged kinetic conflict between Iran and the US. An unlikely scenario could be major crop failures associated with the next solar cycle, which NASA forecasts will be the weakest in 200 years. McKinsey recently concluded that the probability of such a failure has increased due to changes in the environment, and now stands at about 10% over the next five years ("Will the World’s Breadbaskets Become Less Reliable?”).
- Another route to the high inflation regime (repeatedly noted by Bridgewater’s Ray Dalio) would be a sudden loss of confidence in the US dollar relative to other currencies (driving up import prices), perhaps because of increasing deficit monetization and policy paralysis if a severe downturn continues without meaningful policy reforms to address critical structural challenges. However, a sharp rise in import prices due to a collapse in the USD exchange rate also requires relatively higher confidence in another currency, with the Euro being the most likely candidate. This currently seems unlikely, given both the Eurozone’s economic and political uncertainty, and the prospect of an intensifying conflict between the West and China. If confidence collapsed in all major currencies, the price of gold would rise, and price inflation would only occur in terms of gold.
Note: Combining Our Forecasts with Others From Other Sources and Extremizing the Result Should Increase Your Predictive Accuracy
Research has found that three steps can improve forecast accuracy. The first is seeking forecasts based on different forecasting methodologies, or prepared by forecasters with significantly different backgrounds (as a proxy for different mental models and information). The second is combining those forecasts (using a simple average if few are included, or the median if many are). The final step, which significantly improved the performance of the Good Judgment Project team in the IARPA forecasting tournament, is to “extremize” the average (mean) or median forecast by moving it closer to 0% or 100%.
Forecasts for binary events (e.g., the probability an event will or will not happen within a given time frame) are most useful to decision makers when they are closer to 0% or 100% than the uninformative “coin toss” 50%. As described by Baron et al in “Two Reasons to Make Aggregated Probability Forecasts More Extreme”, forecasters will often shrink their probability estimates towards 50% to take into account their subjective belief about the extent of potentially useful information that they are missing.
When you average multiple forecasters’ estimates, you are including more information, which should increase forecast confidence and push the mean estimate closer to 0% or 100%. However, this doesn’t happen when you use simple averaging. For this reason, forecast accuracy is increased when you employ a structured “extremizing” technique to move the mean estimate closer to 0% or 100%.
You can download an extremizing model from our website to use when combining the forecasts you use in your decision process.
The extremizing factors in our model are those that the Good Judgment Project found maximized the accuracy of combined forecasts. Note that the extremizing factor is lower when average forecaster expertise is higher. This is based on the assumption that a group of expert forecasters will incorporate more of the full amount of potentially useful information than will novice forecasters.
Feature Article: An Assessment of COVID-19 Vaccine Uncertainties and Probabilities
In terms of physical, economic, and mental health, a lot is riding on the world’s ability to develop and deploy and effective vaccine against the SARS-Cov-2 virus that causes COVID-19.
In this analysis, we attempt to answer two critical questions: How realistic are our current hopes? And what happens if they are dashed?
Implicit in our hopes are assumptions that five critical uncertainties will be favorably resolved over a given time horizon:
1) Development of a vaccine that stimulates the production of antibodies;
2) Ability to produce the vaccine in large volumes;
3) Ability to distribute large volumes of the vaccine to billions of people around the world;
4) Willingness of a large percent of the population to be inoculated with the vaccine;
5) The vaccine remaining effective for a long period of time.
In quantitative terms, the probability of a successful vaccine equals the joint (multiplicative) probability of that each of these sub-goals will be met. For example, putting a 95% probability on the achievement of each sub-goal by the end of 2021 means that the overall probability of vaccine success is just 77%.
Let’s look at the evidence in each of these areas.
Vaccine Development
As a general rule, it normally takes 15 to 20 years to develop a vaccine. In their “Clinical Success Rates, 2006-2015” study of the drug development process, the Biotechnology Innovation Association found that the overall “Likelihood of Success” (i.e., final approval and deployment) for 9,985 drug development processes studied was 9.6%. However, the LOA for drugs targeted at infectious diseases was 19.1%.
In a separate study published in 2018, Gouglas found that development of vaccines against epidemic infectious diseases has only a 6% chance of success (“Estimating the Cost of Vaccine Development Against Epidemic Infectious Disease”).
However, according to the Milken Institute (https://covid-19tracker.milkeninstitute.org/), there are now 211 vaccines for SARS-CoV-2 coronavirus under development. Applying a historical 6% success rate to this implies that this massively parallel and accelerated development effort will yield about 13 successful vaccines.
Conclusion: 99% estimated probability that a vaccine will be developed that generates an immune response with minimal side effects by the end of 2021.
Vaccine Production
On the surface, the outlook for mass production of successful vaccine candidates is encouraging. Manufacturers have announced capacity construction projects that they claim will be able to produce nine billion doses by the end of 2021.
Moreover, as the Congressional Research Service notes, obstacles related to vaccine manufacturers’ potential liability risks will likely be removed: “A COVID-19 vaccine is likely to be subject to specialized rules limiting legal liability under the Public Readiness and Emergency Preparedness (PREP) Act. To encourage the expeditious development and deployment of medical countermeasures, the Secretary of HHS has declared COVID-19 to be a public health emergency and invoked the PREP Act to limit liability for losses relating to the use of covered medical countermeasures during the public health emergency.
“Under HHS’s declaration, covered persons—including COVID-19 vaccine developers, manufacturers, distributors, and health care professionals who administer a vaccine—are generally immune from legal liability for losses relating to administration or use of an FDA-approved COVID-19 vaccine, except for willful misconduct resulting in death or serious physical injury. However, individuals who are injured or die as a result of receiving a COVID-19 vaccine may seek compensation through the Countermeasures Injury Compensation Program, a regulatory process administered by HHS” (“Legal Issues in COVID-19 Vaccine Development”).
However, in “Vaccines Use Bizarre Stuff. We Need a Supply Chain Now”, Kominers and Tabarrok highlight other production issues beyond manufacturing capacity. “Vaccine supply chains contain some unusual links, including horseshoe crab blood, shark liver oil and an enzyme that’s one of the world’s most expensive products. Other links rely on novel manufacturing processes that have not yet been implemented at scale. Each link in the chain needs to be stress-tested and strengthened. For the potential weak spots, alternative manufacturing processes need to be considered and prepared.”
In another story, “Without Vials and Needles, a Virus Vaccine Is Just a Formula”, Samanth Subramanian observes that, “In a whistleblower complaint, Rick Bright, then the director of the U.S. Biomedical Advanced Research and Development Authority (Barda), wrote that his agency had estimated as far back as January that the country would need from 650 million to 850 million needles and syringes for a Covid-19 vaccination drive. The Strategic National Stockpile held just 15 million at the time, and Bright kept hearing that other countries, aware that scientists were predicting a 12- to 18-month timeline for the release of a vaccine, were buying up stocks of syringes and needles from the U.S. Yet the American government didn’t place its first order for needles and syringes until May 1, he told Congress. When a vaccine is finally approved for manufacture, the rush to stock up on ancillary products will be unprecedented.”
Conclusion: 67% estimated probability that nine billion doses of a vaccine will produced by the end of 2021.
Vaccine Distribution
There are two big issues with vaccine distribution, one physical and one political.
Regarding the former, “Two-thirds of the world’s population is unlikely to have easy access to any Covid-19 vaccine that needs to be stored at freezing temperatures, the German logistics giant Deutsche Post DHL has warned.
“Research by DHL and consultancy firm McKinsey has found that insufficient “last mile cooling facilities in the final delivery stages and a lack of storage at clinics in large parts of Africa, Asia and South America would pose the biggest challenge to delivering a vaccine at scale. Existing “cold-chain” infrastructure, which allows for temperatures to be controlled throughout the delivery process, is only sufficient to bring a frozen vaccine to 2.5bn people in approximately 25 developed countries [or about 33% of the world’s population]” (“DHL Warns Of COVID-19 Vaccine Delivery Problems”, Financial Times).
On its website, UPS agreed, stating, “Let’s face a hard truth: Our pharmaceutical cold chains at this time do not have the equipment and scale to comprehensively deliver a temperature-sensitive vaccine for the COVID-19 pandemic.”
Moreover, even in the United States, a report by the Inspector General of the Department of Health and Human Services found the cold chain for vaccines was very fragile and resulted in vaccine spoilage (“Vaccines For Children Program: Vulnerabilities In Vaccine Management”).
Regarding political obstacles, RAND and others have noted that, with limited quantities of a vaccine initially available, there are abound to be conflicts over who receives it first.
“The US [and other countries] need an equitable distribution plan that reflects social realities. The vaccine should go first to health workers, essential workers, teachers, the elderly, and people whose living circumstances—from prisons to apartments—make it impossible to self-isolate if they get the disease. We need to ensure there is no discrimination, racial or otherwise, in the distribution process. And vaccinating teachers is particularly important because we cannot expect them to risk their lives to teach their students. There is broad agreement that keeping the schools closed will increase the gap between advantaged and disadvantaged children; a generation is at stake” (“It’s Going to be the Vaccine, Stupid!” by Brook and Rydzewski).
Conclusion: 67% estimated probability that the supply chain can deliver the vaccine to at least 5 billion people [67% of the world’s population] by the end of 2021.
Vaccine Acceptance
Herd immunity occurs when enough people in a community become immune to an infectious disease that it stops spreading. Traditionally, the herd immunity threshold has been estimated to be 60% of a population. However, recent research finds that it may be as low as 43% (“A Mathematical Model Reveals The Influence Of Population Heterogeneity On Herd Immunity To SARS-Cov-2”, by Britton et al).
Immunity can theoretically be acquired either by having had the disease (assuming a strong, prolonged, and effective immune response) or through vaccination (which makes the same underlying assumptions).
Seroprevalence tests by the US Centers for Disease Control and Prevention have estimated that, depending on location, between 1% and 7% of the US population has contracted COVID-19 (“Seroprevalence of Antibodies to SARS-CoV-2 in 10 Sites in the United States, March 23-May 12, 2020”, by Havers et al). That means that achieving herd immunity will require substantial takeup of new vaccines when they become available.
That raises a critical question: How enthusiastic will you be about taking a vaccine of as yet known long-term efficacy that has been developed in record time?
According to a Yahoo News/YouGov poll taken at the end of July, only 41% of US Adults said they would take the vaccine when it becomes available. 25% said they would not. The other 34% weren’t sure.
As Jonathan Ellen notes in “The Dangers of Herd Skepticism”, “substantial numbers of people already avoid routine immunizations. Most individuals who don’t accept vaccines such as routine childhood immunizations or the annual flu shot do so out of concern about side effects and doubts about effectiveness.
“Almost 15 percent of parents refuse recommended childhood vaccines, including the mumps-measles-rubella series, because of their belief in a link between vaccination and autism… In recent years, the percentage of U.S. residents 18 or older who reported receiving the annual flu vaccine was between 40 percent and 45 percent.
“Reasons for choosing not to receive the flu vaccine include a sense of invulnerability to the illness; belief that the vaccine isn’t effective; confidence in the body’s immune system to fight infection; concern that the vaccine will make one sick; and fear of neurological damage. An FDA-approved COVID-19 vaccine will present similar concerns.
“The FDA has set the standard for approval at an historically low level—the vaccine needs to protect only half of its recipients from infection over six months. In addition, when the vaccine is approved, the duration of its effectiveness will be unknown—will it require boosters or annual reformulations? Questions will also arise about side effects beyond the six to nine month period that participants in the trials were observed. Such realities could dampen enthusiasm for acceptance of the vaccine.”
Given the consequences of widespread resistance to voluntary vaccination, some are considering more coercive methods. In “An Overview of State and Federal Authority to Impose Vaccination Requirements”, the US Congressional Research Service wrote that, “Under the federalist system of the United States, state governments have the general authority, within constitutional limits, to enact laws ‘to provide for the public health, safety, and morals’ of the states’ inhabitants. In contrast to this general police power, as discussed below, Congress’s power to legislate is confined to those powers enumerated in the Constitution.
“The states’ general police power to promote public health and safety encompasses the authority to require mandatory vaccinations. Pursuant to this authority, states and localities have long enacted various compulsory vaccination laws for certain populations and circumstances, including for school children and certain health care workers and in cases of public health emergency. In the early part of the 20th Century, the Supreme Court twice considered constitutional challenges to such mandatory vaccination requirements. Each time, the Court rejected the challenges and recognized such laws to fall squarely within the states’ police power.”
The authors of the previously mentioned RAND study proposed a different approach: “We should consider whether and how to provide, at the time of vaccination, an electronic readable card confirming that the person had been vaccinated. We should also consider whether it is good policy—or even legal—to require employees, guests, students, or others to present a readable card proving they have been vaccinated if they want to work, fly, eat at a restaurant, study in a classroom, go to the opera, take a cruise ship, etc” (e.g., a vaccination based version of China’s Social Credit System).
In sum, it seems quite clear that vaccine acceptance is going to be an obstacle to achieving herd immunity.
Conclusion: 50% estimated probability that at least half the US population will be vaccinated by the end of 2021.
Vaccine Efficacy
Vaccines provide protection against infectious disease via two pathways. The first, “humoral response”, refers to a vaccine triggering the production of antibodies that directly attack a viral invader. The second, “cellular response”, refers to the enhancement of the body’s cell-level response (via T-Cells) to a viral infection.
Today, the extent to which a vaccine will trigger these responses, their efficacy in repelling infection, and the length of time they will persist all remain unknown.
Data about these responses in patients who have recovered from COVID-19 still vary widely.
The results of attempts to develop a vaccine for MERS (a coronavirus that is far more deadly than SARS-CoV-2 that was first identified in Saudi Arabia in 2012) are instructive.
According to The Gouglas paper cited above, 21 initiatives were undertaken to develop a MERS vaccine. Only four of them progressed to Phase 1 clinical studies. Of these, only one reported successful results (in 2016 by a team at Walter Reed US Army Medical Center).
In their paper, “Safety and Immunogenicity of an Anti-Middle East Respiratory Syndrome Coronavirus DNA Vaccine: A Phase 1, Open-Label, Single-Arm, Dose-Escalation Trial”, Modjarrad et al reported that, “This study showed that the GLS-5300 MERS coronavirus DNA vaccine was tolerable and immunogenic in humans. [Three doses of the] vaccine induced both antibody-based and cellular MERS coronavirus-specific immune responses.
"The study also compared vaccine-specific responses with those from individuals who had recovered from natural MERS coronavirus infections during a 2015 outbreak in Korea. The results showed that the immune responses generated in vaccinated study participants [over 12 months] were similar to convalescent responses after natural infection.”
However, the study could not test the extent to which the levels of immune system responses it found were sufficient to protect vaccinated patients against the disease, or for how long that protection would last.
Equally important, about one third of the patients in the study experienced mild or moderate side effects from the vaccine, including fatigue, head and body aches, and/or nausea.
Earlier this year, results from tests of a different MERS vaccine on animals reported that it did confer protection on them against deliberate exposure to MERS infection (“A Single Dose Of Chadox1 MERS Provides Broad Protective Immunity Against A Variety Of MERS-Cov Strains”, by van Doremalen et al). However this vaccine has not yet proceeded to human trials.
With respect to the efficacy of a SARS-CoV-2 vaccine, a final concern is the rate at which the virus will evolve in the future. A fast rate of evolution is what makes developing accurate vaccines against seasonal influenza so difficult. The consequence is that we have to get vaccinated once a year, and the degree of protection against infection that they provide varies from year to year.
Thus far, the rate at which SARS-CoV-2 has been evolving has been much slower than is the case for influenza, which, all else being equal, implies that a vaccine’s protection could last for a longer time (see, “On The Evolutionary Epidemiology Of SARS-Cov-2”, by Day et al). However, as noted in this month’s Evidence File, coinfection of patients with both SARS-CoV-2 and seasonal influenza virus could cause faster evolution in one or both of them.
Conclusion: 90% estimated probability that immune system response produced by the vaccine will protect people from infection by SARS-CoV-2 for at least one year.
Estimated Joint Probability of Overall Success by December 2021
To summarize, our estimates of successfully overcoming obstacles in five key areas are as follows:
• Vaccine Development = 99%
• Vaccine Production = 67%
• Vaccine Distribution = 67%
• Vaccine Acceptance = 50%
• Vaccine Efficacy = 95%
These estimates produce an overall joint probability of successful vaccine development and deployment by the end of 2021, and efficacy for one year thereafter of about 20% -- a one in five chance of meeting the overly optimistic expectations that almost certainly underlie many individuals’, companies’ and governments’ hopes today.
What Happens If Vaccine Hopes Are Dashed?
When unrealistic optimism gives way to more realistic expectations of how long it will take to develop and deploy a successful vaccine, there will almost certainly be another uncertainty shock to consumers, companies, and financial markets that will further slow the economic recovery.
It will also very likely trigger a sharp increase in mental health problems, which could produce hostile acts (e.g., violent protests) directed towards those perceived to be responsible should the critical failures be in vaccine production or deployment.
On the other hand, if the key failure lies in vaccine acceptance, protests will almost certainly be aimed at government authorities that try to compel vaccination (with some version of RAND’s vaccine “Social Credit System” likely to emerge as a compromise solution).
On the positive side, the United States learned to live with the threat of polio for many years until a vaccine was developed and deployed. The same will undoubtedly happen if the COVID vaccine falls short of its goals.
Besides continuing mandates regarding masks and social distancing, the most important initiative we expect to see is much greater focus on, and investment in, indoor air quality and associated HVAC systems, by both school districts and commercial property owners.
High Value Information Observed In August 2020
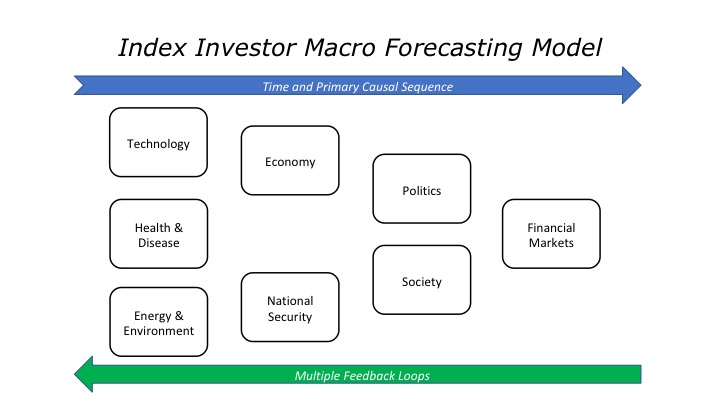
In our model of the complex global macro system, change drivers are arrayed across a roughly chronological process (albeit one with many feedback loops), in which technological and environmental changes precede changes in the economy and national security, which in turn lead to changes in society and politics, all of which produce the effects we observe in investor behavior and financial market valuations and returns.
In our methodology, we classify new information as significant and highly valuable if either it (1) is an “indicator”, which reduces our uncertainty about the value of a parameter in our mental model for making sense of the dynamic macro system, or (2) it is a “surprise” which increases our uncertainty about either the range of potential values for a parameter or the structure of our model. With respect to indicators, the higher our priori probability is for a regime, the more we look for indicators that it will not occur, and the lower our prior probability for a regime, the more we look for indicators that it will occur. Put differently, we tend to look for high value indicators that disconfirm our prior views.
| New Technology Information: Indicators and Surprises | Why Is This Information Valuable? |
| At the end of July, the US Senate passed the FY 2021 National Defense Authorization Act (NDAA). The House had previously passed its version of the bill. Both contain billions of dollars in tax credits and grants for construction of new semiconductor manufacturing facilities in the United States. | In May, the US prohibited (on national security grounds) the use of exported semiconductor manufacturing equipment to produce chips for use by a group of foreign owned companies, including Huawei. In our June issue, we detailed how this could significantly increase US-China tensions, because TSMC, the world’s leading semiconductor manufacturing company has most of its manufacturing capacity located in Taiwan. At the end of July, this became even more concerning when Intel, which as significant US-based semiconductor manufacturing capacity in the United States, announced a six month delay in the start of production for its 7 nanometer chip. This signified the widening of its technology gap with TSMC, which is already manufacturing a 5nm chip (which have about the same processor density as Intel’s 7nm chip), and is scheduled to begin producing a 3nm chip in late 2022 (see, “ TSMC Keeps Pushing the Envelope -- That's Good News for Apple, AMD and Others. If TSMC makes good on its latest promise, it could hold onto its recently-won chip manufacturing lead for some time”, by Eric Johnsa) This apparently led to Intel’s announcement that it might consider outsourcing more chip production. This would, potentially further raise the strategic importance (in both economic and national security terms) of TSMC’s Taiwan plants. Hence the importance of additional funding in the NDAA for domestic US chip production. |
| In August, an AI pilot defeated a top US Air Force F-16 pilot in a simulated dogfight, as part of a DARPA’s Air Combat Evolution (ACE) program. | This was an important step towards the goal of eventually pairing a number of drones with a human pilot (a concept which also applies on land and on and under the sea). On its own, this will substantially change the character of conflict. However, it also highlights questions related to the differences between automated and autonomous weapons systems. As former Navy pilot and current professor Missing Cummings describes in “Lethal Autonomous Weapons: Meaningful Human Control or Meaningful Human Certification?”, “it is important to define autonomy in technology, which is not the same as automation. “Automated systems operate by clear repeatable rules based on unambiguous sensed data. “Autonomous systems take in data about the unstructured world around them, process that data to generate information, and generate alternatives and make decisions in the face of uncertainty. Often, people will refer to this set of capabilities as self-governing. Systems are not necessarily either fully automated or fully autonomous, but often fall somewhere in between… “Currently autonomous technologies perform best when they are doing a very narrow task with little to no uncertainty in their environments…The limitations of machine learning and computer vision systems are currently the Achilles’ heel for all autonomous systems, military and civilian.” Finally, the United States is not alone in developing lethal autonomous weapons systems. August also saw the publication of speculations that a new amphibious assault ship being built by the Chinese Navy will carry a significant number of unmanned combat aerial vehicles. |
| Around the world, reopening of schools is underway (with varying degrees of chaos) using a range of remote, hybrid, and in-person models. A critical issue that in the US many districts are avoiding is the extent of learning losses students suffered following last spring’s haphazard shift to remote education, and whether they will ever be recovered. | As I wrote in an analysis published by the Fordham Institute, analysis by NWEA has found that learning losses have been extensive. Previous research by ACT, Inc. provides base rate evidence that recovery of learning losses is very difficult for most students, given current school system configurations. Given scarce talent issues that many companies were already struggling with before COVID arrived, failure to recover student learning losses has negative implications for future productivity and economic growth, and thus for inequality and social and political conflict. |
| | |
| | |
| | |
| | |
| | |
| | |
| | |
| | |
| | |
| | |
| New Energy and Environment Information: Indicators and Surprises | Why Is This Information Valuable? |
| The combination of California’s aggressive shift to renewable power generation (e.g., 9 GW of gas generation has been closed) and a persistent heatwave in the western United States (which limited California’s ability to import power from other states, while increasing cloud cover and diminishing winds in California) led to blackouts which highlighted the limitations of the current system. As the Financial Times headlined, “Green Ambition Has Short-Circuited California’s Power Supply.” | Closing down nuclear and gas fired power generation plants before the state installed sufficient battery capacity was a choice that implicitly accepted higher risk of exactly what happened. As a Bloomberg headline noted, “California Doomed to Frequent Blackout Risk by Battery Shortage. The story found that, “California’s grid operator estimates that as much as 12 gigawatts of batteries would eventually be needed to store enough renewable energy to help maintain the balance between supply and demand. That’s a huge jump from the more than 500 megawatts worth of batteries operating in the state at the end of last year.” Moreover, as we noted in last month’s feature article, there are many other obstacles to rapid deployment of grid scale battery storage technologies. In sum, recent events in California highlight why decarbonization of the United States’ power system is almost certainly going happen more slowly than many expect. Supporting this, another recent paper found that most of the world’s utilities have not been rushing to close down their fossil fuel generation assets (“A Global Analysis Of The Progress And Failure Of Electric Utilities To Adapt Their Portfolios Of Power-Generation Assets To The Energy Transition”, by Galina Alova). |
| Historically, models of economic growth assume it is based on three inputs: capital, labor, and total or multifactor productivity growth. A key criticism of this model is that it fails to fully take into account the critical role of energy as an input into the economic growth process. A new paper finally rectifies this (“An Energy-Driven Macroeconomic Model Validated By Global Historical Series Since 1820”, by Bercegol and Benisty | SURPRISE The authors demonstrate that since 1920 a series of innovations has increased both the growth energy supply and the efficiency with which it has been used to generate economic growth. If the transition to renewable energy reduces this measure of efficiency, economic growth will likely suffer. It is very likely that this relationship has not been fully integrated into current market and environmental narratives. |
| The UK Department for Business, Energy, and Industrial Strategy released a new report on the cost of electricity generation from various sources. Critically, it includes not just the marginal cost of generating an additional megawatt hour of power, but full lifetime system costs (“levelized cost”), including those related to varying levels of reliability. “Electricity Generation Costs 2020” | SURPRISE The FT’s article about the report (“Green Power Needs to Account for All Its Costs”) noted that, “Much of the recent story has been about the plunging cost of renewables. For instance, in 2013 the UK government estimated that an offshore wind farm opening in 2025 would generate electricity for £140 per megawatt hour (MWh). It now forecasts that could be achieved for just £54/MWh. “The report sees this trend continuing. By 2035, it estimates an offshore wind farm might on average produce power for as little as £41/MWh; and large-scale solar just £33. “However, these figures exclude those system costs, mainly because the solar or wind developer does not have to meet them. At present, these are simply spread across the network as a whole. “When you add them in, as the Beis report does, attributing them to the generating source thatcaused them, the picture changes. “Take the 2035 figure of £41/MWh for offshore wind. With estimated system costs on top, Beis believes the all-in price is closer to £59 to £79 (43-92 percent higher). For solar, £33/MWh becomes £45-£61. In each case, the range depends on how widespread the use of these renewables is…Essentially, the marginal cost of each extra renewable on the system keeps going up as their use increases. “Not only does this erode their advantage over other alternatives such as nuclear and as-yet unproven carbon capture and storage (CCS). It suggests that getting to 100 percent renewables could be expensive.” |
| | |
| | |
| | |
| | |
| | |
| | |
| | |
| | |
| | |
| | |
| New Economic Information: Indicators and Surprises | Why Is This Information Valuable? |
| This year’s Federal Reserve Bank of Kansas City’s Jackson Hole Symposium for central bankers featured two important papers. We featured one of them in last month’s evidence file: “Scarring Body and Mind: The Long-Term Belief Scarring Effects of COVID-19”, by Kozlowski, Veldkamp, and Venkateswaran. Its key finding is that the psychological effects of a pandemic can depress confidence, consumption and investment spending, and GDP growth rates for years. The second paper was “What Happened to U.S. Business Dynamism?” by Ufuk Akcigit and Sina Ates. Their key finding is that reduction in knowledge diffusion across firms between 1980 and 2010 has been a critical root cause of multiple effects, from low productivity growth to rising inequality. | A long commentary I wrote about these papers can be found here. The key point is that the global economy is facing structural headwinds that cannot be overcome with monetary and fiscal stimulus. Much more difficult reforms are needed, and it is not at all clear that our political systems can successfully meet this challenge. |
| In “Replace the Federal Student Loan System with an Income Share Agreement Program”, AEI’s Beth Akers shows why student loan forgiveness programs are prohibitively expensive and risk increasing inequality. She reiterates a call (first made during the Clinton administration) for the replacement of student loans with income share agreements, under which in exchange for funding, students would pay to the government (via the tax system) a fixed share of their income for a fixed number of years. In effect, this would convert the funding of higher education (and skills training) from a debt to an equity-based system. See also: “The Next “Big Short”: Covid-19, Student Loan Discharge In Bankruptcy, And The Slabs Market”, by Samantha Roy and Christopher Ryan, Jr. This paper highlights changes in the bankruptcy treatment of student loan debt that may increase lender enthusiasm for conversion to equity. | SURPRISE As student debt outstanding has exponentially increased in recent years, there has been a parallel growth in research on the negative impact it has on economic growth. As Herbert Stein famously observed, “if something cannot go on forever, it will stop.” Even if Joe Biden is elected in November, outright forgiveness seems to be a political bridge too far, because of the inequitable distribution of its benefits. This makes conversion of the debt into a form of equity (and creation of a program to let workers seeking to advance their skills also have access to this financing) a much more likely scenario. Moreover, this would not just be very likely to produce an increase in economic growth; it could also lead to the creation of a new asset class – human capital – if the government chose to resell these equity claims to investors. |
| Evidence continued to accumulate about growing distress in the real economy. The Financial Times noted that, “Small and medium-sized US companies suffered a complete wipeout in profits in the second quarter because of the Covid-19 crisis, in sharp contrast to large multinationals that emerged from the most intense phase of the pandemic in better shape. “As the earnings season draws to a close, companies within the Russell 2000 stock index — the small-cap benchmark — have reported an aggregate loss of $1.1bn, compared to profits of almost $18bn a year earlier, according to data provider FactSet. “Meantime, the much bigger companies within the benchmark S&P 500 index have posted a 34 per cent aggregate drop in earnings, to $233bn” (“Coronavirus makes for a brutal quarter for smaller US companies”). In both Europe and the United States there were growing concerns that extended government support and loan forbearance would create, as it did in Japan, a growing number of large “zombie” companies that survive without investing, growing, and improving productivity and profits. But at the same time, there was widespread concern about the unpredictable consequences of increasing bankruptcies, business closures, and unemployment when current support programs expire, especially among medium and small companies. Elsewhere, Chetty et al find that many of these support programs have been highly inefficient, and that money “would have been better spent directly mitigating financial hardship through social insurance” (“Real-Time Economics: A New Public Platform to Analyze the Impacts of COVID-19 and Macroeconomic Policies Using Private Sector Data”). Finally, in “Two Tales of Debt”, Kermani and Ma find that because of the increasing specialization of firms and supply chains, and the growing percentage of intangible assets on company balance sheets, the average liquidation value of firms is only 23% of their book assets. Hence losses to lenders (and impairment to their capital and ability to provide credit in the future) resulting from an extended period of financial distress are likely to be large. | SURPRISE In the early days of the COVID pandemic, many people failed to recognize the danger it posed. Partly this was due to the many distractions they faced, including the Trump impeachment trial, Brexit, and the Democratic Party primaries in the United States. It was also due to many people’s lack of a mental model for making sense of the information they noticed about the spread of SARS-CoV-2. The same pattern is also very likely at work once again with respect to timely and accurate assessment of the continuing deterioration of the global economy. Once again, distractions abound, including a technology stock boom, riots and an increasingly acrimonious election campaign in the United States, intensification of the US-China conflict, street demonstrations following an apparently fraudulent election in Belarus, the apparent breakdown of UK-EU trade treaty talks, and a resurgence in COVID cases in Europe and the United States. As Megan Greene put it in the Financial Times, “The US Economy is Having a Wile E. Coyote Moment”. “US consumers and businesses have just run straight off a cash cliff, now that extra federal assistance to small companies and unemployed workers has ended. The US economy is now suspended in mid-air.” |
| | |
| | |
| | |
| | |
| | |
| | |
| | |
| | |
| | |
| | |
| | |
| | |
| | |
| | |
| | |
| | |
| New National Security Information: Indicators and Surprises | Why Is This Information Valuable? |
| The Pentagon released its annual report on “Military and Security Developments Involving the People’s Republic of China.” It is a sobering read. “DoD’s 2000 report assessed that the PLA was slowly and unevenly adapting to the trends in modern warfare. The PLA’s force structure and capabilities focused largely on waging large-scale land warfare along China’s borders. The PLA’s ground, air, and naval forces were sizable but mostly obsolete. Its conventional missiles were generally of short range and modest accuracy. “The PLA’s emergent cyber capabilities were rudimentary; its use of information technology was well behind the curve; and its nominal space capabilities were based on outdated technologies for the day. “Further, China’s defense industry struggled to produce high-quality systems. Even if the PRC could produce or acquire modern weapons, the PLA lacked the joint organizations and training needed to field them effectively. The report assessed that the PLA’s organizational obstacles were severe enough that if left unaddressed they would inhibit the PLA’s maturation into a world-class military force… “Two decades later, the PLA’s objective is to become a “world-class” military by the end of 2049—a goal first announced by General Secretary Xi Jinping in 2017. “Although the CCP [Chinese Communist Party] has not defined what a “world-class” military means, within the context of the PRC’s national strategy it is likely that Beijing will seek to develop a military by mid-century that is equal to—or in some cases superior to—the U.S. military, or that of any other great power that the PRC views as a threat. “As this year’s report details, the PRC has marshaled the resources, technology, and political will over the past two decades to strengthen and modernize the PLA in nearly every respect.” | “As this report shows, the CCP desires the PLA to become a practical instrument of its statecraft with an active role in advancing the PRC’s foreign policy, particularly with respect to the PRC’s increasingly global interests and its aims to revise aspects of the international order… “Given the continuity in the PRC’s strategic objectives, the past 20 years offer a harbinger for the future course of the PRC’s national strategy and military aspirations. “Certainly, many factors will determine how this course unfolds. What is certain is that the CCP has a strategic end state that it is working towards, which if achieved and its accompanying military modernization left unaddressed, will have serious implications for U.S. national interests and the security of the international rules-based order.” |
| “Is China Beating the US to AI Supremacy?” by Graham Allison and Eric Schmidt “We begin with four key points. First, most Americans believe that U.S. leadership in advanced technologies is so entrenched that it is unassailable. Likewise, many in the American national security community insist that in the AI arena China can never be more than a “near-peer competitor.” Both are wrong. In fact, China stands today as a full-spectrum peer competitor of the United States in commercial and national security applications of AI… “Second, China’s zeal to master AI goes far beyond its recognition that this suite of technologies promises to be the biggest driver of economic advances in the next quarter century. For the Party, AI is mission critical. “The command of 1.4 billion citizens by a Party-controlled authoritarian government is a herculean challenge. Since the fall of the Soviet Union, Americans have been confident that authoritarian governments are doomed to fail—eventually. But AI offers a realistic possibility of upending this proposition. AI could give the Party not just an escape hatch from the “end of history,” but a claim to advance a model of governance—a national operating system—superior to today’s dysfunctional democracies… “Third, while we share the general enthusiasm about AI’s potential to make huge improvements in human wellbeing, the development of machines with intelligence vastly superior to humans will pose special, perhaps even unique risks. In 1946, Albert Einstein warned, “the unleashed power of the atom has changed everything save our modes of thinking, and thus we drift towards unparalleled catastrophe.” “We believe the same could be said of AI. Henry Kissinger has identified these risks in what we call “Kissinger’s Specter.” In his words, AI threatens an unpredictable revolution in our consciousness and our thinking, and an “inevitable evolution in our understanding of truth and reality”… “Fourth, China’s advantages in size, data collection and national determination have allowed it over the past decade to close the gap with American leaders of this industry.” | SURPRISE “We have been collaborating over the past year in an effort to understand the national security implications of China’s great leap forward in artificial intelligence… Our purpose in this essay is to sound an alarm over China’s rapid progress and the current prospect of it overtaking the United States in applying AI in the decade ahead… “Is AI a race China is destined to win? ... It is our best judgment that on the current trajectory, while the United States will maintain a narrow lead over the next five years, China will then catch up and pass us quickly thereafter.” |
| “Wormhole Escalation in the New Nuclear Age”, by Rebecca Hersman. “Today’s global pandemic crisis offers a glimpse into how a toxic mix of disinformation, conspiracy theories, and digital technology can complicate effective crisis management, fuel competition and rivalry, shift blame, and sow mistrust… “Advanced technology is also blurring the threshold between conventional and strategic conflict, including the increasing commingling of nuclear and conventional payloads on non-ballistic missile delivery systems such as hypersonic vehicles, long-range cruise missiles, or extended-range torpedoes, as well as ever more effective missile defenses. “Similarly, conventional and strategic warning and surveillance assets and advanced command-and-control capabilities continue to be integrated in ways that potentially undermine escalatory firebreaks by creating new counterforce or precision strategic-strike opportunities and enhancing the potential efficacy of missile defenses. “These developments may bolster incentives to move first and fast in a high-end conventional fight. As traditional firebreaks between conventional and nuclear warning and delivery systems erode and the strategic effects of cyber and space operations multiply, the ability to manage and maintain strategic stability grows | SUPRRISE “Unlike traditional concepts of escalation, which suggest linear and somewhat predictable patterns from low-level crisis to all-out nuclear war, escalatory pathways in this new era of strategic competition will be less predictable. “Indeed, increasingly sophisticated sub-conventional tactics such as disinformation and weaponized social media, the blurring of nuclear-conventional firebreaks, and the continuing diffusion of global power to regional nuclear states are adding new challenges and additional complexity to crisis management even as an increasingly competitive and contested security environment fuels greater coercive risk-taking among nuclear-armed states, in particular, the United States, Russia, and China” … “This new era of strategic competition will require renewed thinking about the tools and concepts of deterrence and escalation — adapting older ideas and developing new ones.” |
| China has begun to implement its new National Security Law in Hong Kong, arresting top media and pro-democracy political leaders, as well as protesting students. Axios also reported that, “On July 31, Hong Kong authorities issued arrest warrants for six activists based abroad, including a U.S. citizen, for “incitement to secession and collusion with foreign forces." Axios further noted that, “Article 38 in the national security law states the law applies to everyone, everywhere. The indictment in late July of U.S. citizen Samuel Chu, who resides in the U.S., for "collusion with foreign forces" — in other words, Chu's own government — heralds the opening of a dark chapter both for Hong Kong and the world.” Finally, China also appeared to further escalate its use of “hostage diplomacy” by arresting popular Australian anchorwoman Cheng Lei on national security grounds (it already holds a number of Canadians, who were arrested following Canada’s detention of Huawei’s CFO at the request of the United States). | SURPRISE China’s increasingly aggressive behavior in multiple areas, from its treatment of the Uighurs to the Indian Border to Hong Kong to Taiwan, as well as its increasing use of “hostage diplomacy” could indicate that the nation’s domestic stability is more fragile than many observers believe, thus necessitating actions that generate public unity by focusing attention on external threats to China. Alternatively, Xi Jinping may perceive that COVID, the likelihood of a US constitutional crisis after the November election, and the current balance of military forces versus the US and its allies have created a set of circumstances in which China can and should move aggressively to achieve its medium term goals. This would be consistent with Xi’s previous pattern of taking surprising, risky actions that are intended to produce decisive results. The greatest risk here is a move to seize control of Taiwan, which would almost certainly trigger a kinetic conflict with the United States. The weight of evidence suggests that the probability of this occurring before the end of June 2021 has significantly increased. Our forecast probability today is 25%. |
| “Xi Jinping Is Reinventing State Capitalism. Don’t Underestimate It”. The Economist, 13Aug20 “The next phase of Chinese state capitalism is under way—call it Xinomics. Since he took power in 2012 Mr Xi’s political goal has been to tighten the party’s grip and crush dissent at home and abroad. His economic agenda is designed to increase order and resilience against threats. For good reason. Public and private debt has soared since 2008 to almost 300% of gdp. Business is bifurcated between stodgy state firms and a Wild West private sector that is innovative but faces predatory officials and murky rules. As protectionism spreads, Chinese firms risk being locked out of markets and denied access to Western technology. “Xinomics has three elements. First, tight control over the economic cycle and the debt machine. The days of supersized fiscal and lending binges are over… “The second strand is a more efficient administrative state, whose rules apply uniformly across the economy. Even as Mr Xi has used party-imposed law to sow fear in Hong Kong, he has constructed a commercial legal system in the mainland that is far more responsive to businesses. Bankruptcies and patent lawsuits, once rare, have risen fivefold since he took office in 2012…More predictable rules should allow markets to work more smoothly, boosting the economy’s productivity… “The final element is to blur the boundary between state and private firms. State-run companies are being compelled to boost their financial returns and draw in private investors. Meanwhile the state is exerting strategic control over private firms through party cells within them… “Instead of indiscriminate industrial policy, such as the “Made in China 2025” campaign launched in 2015, Mr Xi is shifting to a sharp focus on supply-chain choke-points where China is either vulnerable to foreign coercion or where it can exert influence abroad. That means building up self-sufficiency in key technologies, including semiconductors and batteries… “The real test, however, will come over time. China hopes that its new techno-centric form of central planning can sustain innovation, but history suggests that diffuse decisionmaking, open borders and free speech are the magic ingredients.” | Continued strengthening of the Chinese economy would expand its role in the world, while also providing greater resources for investment in AI technology and the nation’s military. However, as the analyst Michael Pettis has stressed for years, this outcome is far from inevitable. He recently laid out his argument in commentary for the Financial Times (“The Problems with China’s ‘Dual Circulation’ Economic Model”). To date, China’s economic growth has been driven by investment (both public and private) and exports. As a percent of GDP, private consumption has remained very low, increasing by just 2% between 2007 and 2019. An enormous amount of investment has been financed by an ever-growing amount of debt. Moreover, the marginal productivity of this new investment has been declining over time, which has made servicing it increasingly difficult. Moreover, a substantial amount of this investment has been in residential real estate. Again, with stagnant incomes, servicing the growing mountain of property debt has become more difficult as price appreciation has slowed. As Rogoff and Yang note in their new paper on “Peak China Housing”, “even before the Covid-19 shock, a decades-long housing boom had given rise to severe price misalignments and regional supply-demand mismatches, making an adjustment both necessary and inevitable.” Pettis argues that the only long-term solution is reorienting the Chinese economy towards higher incomes and private consumption. However, this will “require an economic, social and political transformation that is likely to be much greater than Beijing — and most Chinese and foreign economists, for that matter — seem to realise… “For Chinese consumption to be broadly in line with that of other developing countries, ordinary households must recover at least 10-15 percentage points of GDP at the expense of businesses [especially export oriented companies], the wealthy, or the government. This means rebalancing involves a massive shift of wealth — and with it, political power — to ordinary people. This will not be easy.” |
| “Beijing’s Strategic Ends: Harmony through Hierarchy and the End of Choice”, by George Bartle “China’s foreign policy is best understood through a neo-tributary framework that takes into account four core imperial concepts that continue to shape the Chinese Communist Party’s worldview: (1) Chinese exceptionalism as motive; (2) Trade and diplomacy as means; (3) Cultural assimilation as political strategy; (4) Image building as legitimacy defense.” “Beijing has long pursued a belief in Chinese exceptionalism, which has recently morphed into a more ethnocentric exceptionalism tied to Han Chinese identity… “Although China now recognizes the importance of trade for its national development and foreign heads of state no longer physically kowtow before Chinese rulers, the link between trade and diplomacy is still an important component of Beijing’s worldview. Much of China’s post-Mao era foreign policy initiatives, such as Good Neighbor, Going Out, and the Belt and Road Initiative are clear examples of how trade and investment remain a unidirectional endeavor—flowing out of China rather than into it from foreigners… In Imperial China, “court rituals, Chinese language, and associated cultural assimilation were the means through which Beijing exercised its power and influence… “Rituals of respect also play an important role in trade and diplomacy, and continue to shape how the People’s Republic of China conducts international relations… Like Confucian rituals of deference to the emperor, the Chinese Communist Party’s attempt to shape modern diplomatic ritual through the inclusion of slogans in joint statements or UN documents is an attempt to force smaller powers to make deferential and ritualistic statements of conformity with the People’s Republic of China in exchange for what are viewed as economic and political gifts… “Beijing’s attempts to co-opt modern-day rituals are not limited to perfunctory statements. For China, gaining influence over culture through ceremony and ritual is key to maximizing power. By making concepts, objects, and values sacred, Beijing takes them out of the political, and therefore debatable realm, and into an untouchable realm more akin to religion than international relations. Like mantras and prayers, the ritualistic repetition of slogans and physical acts of deference eventually have the effect of shifting perceptions and realities over time… “The lynchpin in China’s ability to create a neo-tributary system is its ability to maintain and project its image as a benevolent hegemon that seeks to preserve social and political harmony through peaceful hierarchy. In this sense, China’s image has historically gone hand in hand with more traditional elements of national power in legitimizing its position atop the East Asian order. This also helps explain the often-visceral reaction Beijing has to criticism… “Critically for Beijing, undermining China’s international image could eventually threaten the leadership’s domestic power. If foreign countries counter Beijing’s assertions that China’s rise under the Chinese Communist Party is benign and will contribute to social harmony and economic prosperity, it also undermines the same foundations the Chinese Communist Party uses to assert its control within China.” | SURPRISE Written by a US Foreign Service Officer (in the spirit of George Kennan’s famous 1947 “Mr. X” article on “The Sources of Soviet Conduct”), this analysis is a very useful antidote to our natural tendency to analyze China using frameworks grounded in the conduct of western nations. |
| | |
| | |
| | |
| | |
| | |
| | |
| | |
| | |
| New Health and Disease Information: Indicators and Surprises | Why Is This Information Valuable? |
| New research continues to give us a better understanding of COVID-19’s disease process and effects. In “Outcomes of Cardiovascular Magnetic Resonance Imaging in Patients Recently Recovered From Coronavirus Disease 2019 (COVID-19)”, Puntmann et al found that 78% of the recovered COVID patients they tested had abnormal cardiovascular conditions compared to matched controls who had not been infected with COVID-19. In “Cerebral Micro-Structural Changes in COVID-19 Patients”, Lu et al found “neurological symptoms were presented in 55% of COVID-19 patients.” “A Mechanistic Model And Therapeutic Interventions For COVID-19 Involving A RAS-Mediated Bradykinin Storm” by Garvin et al summarizes the results of analysis undertaken using a supercomputer at the Oak Ridge National Laboratory. The authors conclude that a key part of COVID’s disease process is the increase it triggers in levels of the peptide bradykinin, which promotes inflammation and causes blood vessels to become leaky. In turn, this can account for the multiple cardiovascular, pulmonary, and neurological symptoms observed in COVID-19 patients. The good news is that the analysis also identified existing drugs that can be used to inhibit these “bradykinin storms.” | People who survive COVID-19 may end up with chronic long-term conditions that will limit their productivity and increase overall healthcare costs. However, it appears that we may be closing in on better therapeutic approaches to limiting the development of these conditions in COVID-19 patients. |
| The broadest definition of the chance of death from a disease is the Infection Fatality Rate (IFR). While it is the one most people want to know, it is also the hardest to estimate. While the numerator (deaths) is known, the denominator (total people infected) is much more uncertain. The best way to estimate it is through seroprevalence studies, which test for the presence of disease antibodies in a statistically representative population sample. However, other research has found that some people who tested positive for COVID failed to develop antibodies (though they did show a different response, based on their levels of so-called killer T-Cells). So in the case of COVID, IFRs based solely on seroprevalence (antibodies) are likely to be too high. The largest COVID seroprevalence study conducted to date was recently published in the UK. In “Antibody Prevalence For SARS-Cov-2 Following The Peak Of The Pandemic In England: REACT2 Study In 100,000 Adults”, Ward et al found that, “COVID prevalence of 6.0% (95% Confidence Interval: 5.8, 6.1). Highest prevalence was in London (13.0%), among people of Black or Asian (mainly South Asian) ethnicity (17.3%), and those aged 18-24 years (7.9%)… One third of antibody positive individuals reported no symptoms.” The authors estimate that the overall IFR was 0.90%, with a 95% CI of (0.86, 0.94), with IFRs sharply increasing with patients’ age. This contrasts with a previous estimated IFR (based on a meta-analysis of 36 smaller studies in different locations) of between 0% and 1.31%, with a median of 0.24% (“The Infection Fatality Rate Of COVID-19 Inferred From Seroprevalence Data”, by John Ioannidis). | Developing better estimates of the Infection Fatality Ratio for COVID is critical for making better risk management decisions (e.g., regarding the need for further quarantines). While the new UK study is very important, the fact that some COVID patients fail to develop antibodies, while developing a strong killer T-Cell response, suggests that current IFR estimates are likely to be too high, but by still uncertain amount. |
| There were new warnings about what may happen when flu season arrives in the midst of our COVID pandemic. See: “What Happens When COVID-19 Collides with Flu Season?” by Rita Rubin, and “COVID-19 and Flu, a Perfect Storm” by Belongia and Osterholm | In a worst case, hospitals could be overwhelmed, because the symptoms of the two diseases overlap. However, thus far the southern hemisphere is having an extremely mild flu season, very likely because of the social distancing measures implemented to control the spread of COVID. The most dangerous case is driven by the coinfection of people with both influenza and SARS-CoV-2 which could trigger recombinations in either or both viruses, and make them more transmissible and/or more deadly. For example, SARS-CoV-2 is one of the largest and most complex of known RNA viruses. A recent paper described new research that found its RNA contains instructions for producing 23 new proteins in an infected cell whose function and effects in the disease process are still unknown (“The coding capacity of SARS-CoV-2”, by Finkel et al). |
| With students returning to schools and workers to offices, there is much more focus on COVID transmission via aerosols, and therefore on indoor air quality and the performance of HVAC systems. For example, CDS and industry groups have recommended the use of MERV-13 filters and at least 6 air changes per hour (ACH), both of which significantly increase HVAC operating costs. More sophisticated analyses are now appearing (like the ones below), whose estimation of inflection risk takes into account variables like the size of a room, the number of people in it, the length of time they are present, and the activities they are performing. “Airborne Infection R-Numbers For Regularly Attended Spaces: COVID-19 A Case-Study”, by Burridge et al “Estimation Of Airborne Viral Emission: Quanta Emission Rate Of SARS-Cov-2 For Infection Risk Assessment”, by Buonanno et al “2019 Novel Coronavirus (COVID-19) Pandemic: Built Environment Considerations To Reduce Transmission”, by Dietz et al “Can HVAC Systems Help Prevent Transmission of COVID-19?” by McKinsey & Company | SURPRISE Before COVID arrived, there was significant evidence of the negative effects of poor indoor air quality in both office buildings and schools. See, for example: “Associations of Cognitive Function Scores with Carbon Dioxide, Ventilation, and Volatile Organic Compound Exposures in Office Workers: A Controlled Exposure Study of Green and Conventional Office Environments”, by Allen et al “Ventilation Rates In Recently Constructed U.S. School Classrooms”, by Batterman, et al It is becoming clear that upgrading office and school HVAC systems to the new COVID infection prevention standards will very likely involve significant investment. In the face of uncertain future demand for office space, some landlords may choose to forgo this investment, and hand their property over to lenders. This will increase the number of commercial loans in financial distress. Shortcomings in school HVAC systems present even more problems. Because of the pressure to resume in-person schooling, school districts appear to be reluctant to fully disclose the current state of their HVAC systems. This will likely result in a growing amount of litigation, and either difficulties in renewing insurance coverage or increased payouts for districts that self-insure. In turn, this will make an already chaotic situation even worse, and further deepen students’ learning losses. |
| Two new papers illustrate the complex feedback loops that have arisen after the arrival of COVID, and how they have made controlling the pandemic even more difficult (in the absence of an effective vaccine). | In “An Epidemiological Model With Voluntary Quarantine Strategies Governed by Evolutionary Game Dynamics”, Amaral et al observe that, “During pandemic events, strategies such as quarantine and social distancing can be fundamental to curb viral spreading. Such actions can reduce the number of simultaneous infection cases and mitigate the disease spreading, which is relevant to the risk of a healthcare system collapse. “Although these strategies can be suggested, or even imposed, their actual implementation may depend on the population perception of the risks associated with a potential infection. The current COVID-19 crisis is showing that some individuals are much more prone than others to remain isolated, avoiding unnecessary contacts, and respecting other restrictions.” This leads to recurring waves of infections. In “The Unintended Consequences Of Inconsistent Pandemic Control Policies”, Althouse et al show how inconsistent implementation of pandemic control measures produce results that are worse than no measures at all. |
| Evidence on the origin of the SARS-CoV-2 virus continues to accumulate and evolve. The critical uncertainty is how the SARS-CoV-2 virus acquired a furin (an enzyme) cleavage on its spike protein of the virus, which facilitates its entry into human cells. Previous research has found that the acquisition of the furin cleavage by H5 and H7 influenza viruses makes them much more infectious and deadly (e.g., “Cleavage Activation of the Influenza Virus Hemagglutinin and Its Role in Pathogenesis”, by Garten and Klenk). Recent research has found that this is also true for coronaviruses (see, “Furin Cleavage Site Is Key to SARS-CoV-2 Pathogenesis”, by Johnson et al. However, no furin cleavage has been found to exist on the coronaviruses that are most genetically similar to SARS-CoV-2. So how did it get there? At this point, there are at least three hypotheses. The first is that it occurred naturally, most likely via recombination with another circulating virus that coinfected the same animal or human organism (see, “A Palindromic RNA Sequence As A Common Breakpoint Contributor to Copy‑Choice Recombination In SARS‑COV‑2” by William Gallagher and “The Sarbecovirus Origin Of SARS-Cov-2’s Furin Cleavage Site”, by Spyros Lystras). However, until this mysterious host is identified, a second hypothesis cannot be ruled out – that the virus originated in a laboratory (e.g., during a so-called “gain of function study” to assess how it could become more dangerous) and was released due to a lab accident (see, “Might SARS-CoV-2 Have Arisen via Serial Passage through an Animal Host or Cell Culture?”, by Sirotkin and Sirotkin). Gain of function studies are dangerous (see, “Why Do Exceptionally Dangerous Gain-of-Function Experiments in Influenza?”, by Mark Lipsitch), but the Wuhan Institute of Virology has in the past acknowledged performing them on bat coronaviruses. There is also substantial evidence from around the world that lab accidents have occurred in the past (see, “Laboratory Escapes and ‘Self-fulfilling Prophecy’ Epidemics”, by Martin Furmanski). Moreover, China continues to resist international inspection and investigation of the Wuhan Institute of Virology. However, the media has been notably reticent to investigate this hypothesis, more often than not dismissing the evidence supporting it as no more than a “conspiracy theory” (see, “Is Considering A Genetic Manipulation Origin For SARS-Cov-2 A Conspiracy Theory That Must Be Censored?”, by Rosanna Segreto). However, evidence supporting this hypothesis has continued to accumulate. For excellent summaries, see “The Case Is Building That COVID-19 Had a Lab Origin” by Latham and Wilson. This month, these authors published new evidence that (a) six miners in Mojiang, China (1,800 km from Wuhan) who became infected with a SARS like virus in 2012 (three of whom died) could have been the zoonotic host in which the furin cleavage was acquired via recombination; (b) the Wuhan Institute of Virology acquired samples of this virus; (c) it is possible that gain of functions were conducted on it; and (d) it is also possible that a sample from such a study escaped as the result of a lab accident (see, “A Proposed Origin for SARS-CoV-2 and the COVID-19 Pandemic”). This (and perhaps other) evidence is apparently sufficiently compelling that the US National Institute of Health is now also pursuing this hypotheses more aggressively, “with specific attention to addressing…whether staff [at the Wuhan Virology Lab] had Sars-Cov-2 in their possession prior to December 2019” (see, “NIH Presses U.S. Nonprofit for Information on Wuhan Virology Lab”, Wall Street Journal, 19Aug20). The third hypothesis is even scarier to contemplate, and has thus been almost completely dismissed by the media. That this virus was deliberately developed as a potential bioweapon by China, and intentionally released to disrupt the global economy, perhaps with the intention of lowering the risk to China of taking aggressive actions towards Hong Kong and Taiwan. It is not hard to understand why few want to consider the implications of this hypothesis if it were ever proven to be true: Under US strategic doctrine, the deliberate use of SARS-CoV-2 would constitute an attack on the nation using a weapon of mass destruction (nuclear, chemical, and biological), which would invite retaliation using similar weapons. | Wuhan Institute of Virology in 2012, or subsequent gain of function studies; and (b) It was released via a laboratory accident, which Chinese authorities continue to cover up. As the public becomes more aware of this body of evidence, conflict between China and many other nations will very likely substantially increase. |
| | |
| | |
| | |
| | |
| | |
| New Social Information: Indicators and Surprises | Why Is This Information Valuable? |
| Rioting continued in some American cities, with looting in Chicago’s Magnificent Mile retail district receiving widespread coverage (e.g., see “When Authority Vanishes” by John McGinnis). While the political benefits to the Trump campaign were obvious, the social forces operating below the surface are potentially more important. | SURPRISE Martin Gurri, author of the book “The Revolt of the Public and the Crisis of Authority in the New Millennium” offered an insightful analysis in his article, “Why Were the Protests and Riots So Explosive?” “The riots connect to something bigger and deeper: The tectonic collision between a public empowered by digital platforms and the elites who control the ruling institutions of modern society”… “The information sphere today contains an immense universe of voices interested in talking about ever-fewer subjects.” Donald Trump as the dominant narrative was displaced by the COVID pandemic, and then by urban protests and riots. “The information sphere has taken on the traits of an obsessive-compulsive personality” … Re: the mindset of the protesters. “Their visions of the future diverge wildly, but they are united and mobilized by a shared loathing of the established order. They stand ferociously against… Any hint of a positive program would likely shatter the movement into its component war-bands, so revolt has come to mean an exercise in pure negation, in the repudiation of the status quo without an alternative in sight. At this point, the question of nihilism becomes impossible to avoid” … “The last piece of the puzzle is the behavior of elected officials…This was a collapse in the self-confidence of our ruling elites … Many were paralyzed by fear of doing anything that might transform them into villains of the narrative … Those in charge continue to bleed out authority, and the democratic institutions they represent have begun to totter.” |
| In “Conformity to a Lie”, Heather McDonald argues that, “academia’s monolithic belief in systemic racism will further erode American institutions and the principles of our civilization… “Academia was the ideological seedbed for that violence and for its elite justifications; it will prove just as critical in the accelerated transformation of the country. “Fealty to “diversity” and denunciations of white privilege have been a unifying theme in academia for decades, of course. “What’s different this time is the sheer venom of the denunciations. College presidents and deans competed for the most sweeping indictment of the American polity, rooted in the claim that blacks are everywhere and at all times under threat.” “The claim that colleges are hotbeds of discrimination is a fantasy. Every university twists itself into knots to admit, hire, and promote as many black students and faculty as it possibly can, in light of the fierce bidding war among colleges for underrepresented minorities. “It has been taboo to hint at the reason that the millions of dollars already expended on campus diversity initiatives have yet to engineer exact proportional representation of blacks in the student body and on the faculty: the vast academic skills gap. “Now this truth will be even more professionally lethal to anyone who dares mention it. The highest reaches of the university have declared as a matter of self-evident fact that systemic racism is the defining feature of American society, one that explains every inequality. Fighting against that racism has now officially become colleges’ reason for being.” | The claim that systematic racism is responsible for the uneven racial distribution of educational, economic, and other outcomes clashes with the public’s views, as polled by Pew Research in February 2019. Among those who said being black hurt people’s ability to get ahead, only 54% of whites believed racial discrimination is a major reason for this (versus 84% of blacks). 60% of whites said less access to good schools was a major reason, compared to 72% of blacks. 50% of whites said family instability was a major reason, compared to 42% of blacks. In sum, the claim by academics and other progressives that systematic racism is the major cause of uneven racial outcomes in the United States is rejected by the majority of the public. As such, the continued assertion of this claim will very likely further increase social and political conflict in the United States. |
| Two new papers highlight less understood negative effects from inequality of economic opportunity. In “The Motivational Cost Of Inequality”, Gesiarz et al observe that, “economic inequality arising due to random circumstances is often viewed as unfair, and previous studies have shown that people support redistribution of wealth in such situations. However, much less is known about how opportunity gaps influence human motivation”. They find that “across three experiments, the unequal distribution of potential rewards for performing the same task reduced participants’ motivation to pursue rewards, even when their relative position in the distribution was high, and despite the decision being of no benefit to others” ... “Large disparities in potential rewards from work were associated with greater unhappiness, which was associated with lower willingness to work–even when controlling for absolute reward and its relative value…[In sum], “opportunity-gaps can trigger psychological dynamics that hurt the productivity and well-being of all involved.” In another recent paper, Eric Protzer tests a number of different hypotheses and concludes that, “Social Mobility Explains Populism, Not Inequality or Culture.” Note that by “social mobility” the author refers to the perception that unequal outcomes are the result of a system that unfairly limits opportunity. | SURPRISE These papers help to explain the clashing social views that underlie the rising levels of political conflict we see today in the United States and other western nations. On one side are practitioners of identity politics, who ascribe inequality of outcomes to systematic racism. On the other side are practitioners of something closer to traditional class politics, who ascribe inequality of outcomes to sources of systematic unfairness that go well beyond racism. |
| As the pandemic wears on, “COVID Fatigue” is taking a toll. Even before the pandemic arrived, the prevalence of experiencing anxiety in the past month was on the rise, especially among young adults (from 8% in 2008 to 15% in 2018, as reported by Goodwin et al in “Trends in anxiety among adults in the United States, 2008-2018”). Now prolonged exposure to multiple threats and fears triggered by COVID, along with restrictions on our access to many previous coping mechanisms (e.g., entertainment, socializing, restaurants, sports, in-person shopping, exercise) is producing a sharp increase in mental health problems. For example, according to the BBC, the incidence rate of people in the UK reporting depressive symptoms has doubled from 10% in July 2019 to 20% in June 2020. The greatest increase was in people between 16 and 34, with 33% reporting moderate or severe depressive symptoms in July. Similarly, the Federal Reserve Bank of New York reported on “The Disproportionate Effect of COVID-19 on Households with Children [under 18]” | Existing mental health resources are almost certainly insufficient to address the substantial increase in people needing professional treatment of anxiety, depression and other disorders triggered by extended exposure to the multiple challenges COVID-19 has created in many people’s lives. It is very likely that this will lead to more pressure on local and state government budgets, as well as the capacity of the healthcare system. A more long lasting impact is likely to be a long-term reduction in the productivity and earning power of a significant percentage of the population. |
| In “Half a Million Fewer Children?” Brookings' Melissa Kearney and Phillip Levine analyze the likely impact of COVID-19 on US fertility rates that were already dropping before the pandemic arrived. | If not offset by higher immigration, a drop in native births will raise the US dependency ratio in future years (the ratio of retired adults and children to working adults). If the US education system does not substantially improve (which is critical to higher future labor productivity), a sustained reduction in fertility and a rise in the dependency ratio will put additional downward pressure on future GDP growth. |
| In his book “Albion’s Seed”, David Hackett Fischer famously described the enduring impact on regional US culture of four early waves of colonists who came from different regions of England. In “Rugged Individualism And Collective (In)Action During The Covid-19 Pandemic”, Bazzi et al provide further evidence of this phenomenon. | The authors find that, “Rugged individualism—the combination of individualism and anti-statism—is a prominent feature of American culture with deep roots in the country’s history of frontier settlement. Today, rugged individualism is more prevalent in counties with greater total frontier experience (TFE) during the era of westward expansion between 1790 and 1890. “While individualism may be conducive to innovation, it can also undermine collective action, with potentially adverse social consequences. “We show that America’s frontier culture hampered the response to the COVID-19 pandemic. Across U.S. counties, greater TFE is associated with less social distancing and mask use as well as weaker local government effort to control the virus. We argue that frontier culture lies at the root of several more proximate explanations for the weak collective response to public health risks, including a lack of civic duty, partisanship, and distrust in science.” |
| | |
| | |
| | |
| | |
| | |
| | |
| | |
| New Political Information: Indicators and Surprises | Why Is This Information Valuable? |
| In the Atlantic, Tom McTague wrote about “How the Pandemic Revealed Britain’s National Illness”. Many of his comments could also apply to the United States. “What emerges is a picture of a country whose systemic weaknesses were exposed with appalling brutality, a country that believed it was stronger than it was, and that paid the price for failures that have built up for years… “When the pandemic hit, then, Britain was not the strong, successful, resilient country it imagined, but a poorly governed and fragile one. The truth is, Britain was sick before it caught the coronavirus… “At the start of 2020, Britain had been through 10 years of austerity following the 2008 financial crash—another great international crisis that hit the country harder than almost anywhere else. “The NHS was stretched and fragmented, its lines of authority and responsibility tangled by years of regulatory tinkering. Outside London, the country’s economy was unproductive and poor, and its elderly-care system an unreformed national disgrace. “The civil service, which believed itself to be the best in the world, had become a shadow of its former self, almost entirely shorn of the ability to act operationally or think strategically, its center hollowed out, weak, and ineffective. The country itself seemed divided and angry, unable to agree on a unifying national story… “Like America, the country failed to live up to its reputation as a pillar of pandemic readiness. But unlike America, Britain’s political leadership stuck closely to the script experts had drawn up for it—and the country still struggled… “What it all adds up to, then, is a sobering reality: Institutional weaknesses of state capacity and advice were not corrected by political judgment, and political weaknesses were not corrected by institutional strength” … “In remarks echoed, though perhaps not as colorfully, by politicians, officials, and diplomats, one figure close to Johnson told me of his experience at the heart of the government machine these past few months: ‘It’s a fucking disgrace.’” | One of the most important, if unacknowledged, roles of institutions is to provide people – including investors and corporate managers – with the confidence to act in the face of Keynesian uncertainty. That is, situations in which the range of possible future outcomes, their potential impact, and/or their probabilities are both unknown and unknowable. Confidence in the ability of institutions to effectively respond to the worst possible outcomes that could occur in the future gives us confidence to act in the present. If confidence in the effectiveness of institutions is lost, that can easily lead to both inaction and the search for a strongman (or woman) who can protect us should the worst outcomes occur. The weakened capacity of institutions at all levels of government (e.g., not just the CDC or NHS, but also local public schools) to rise to various challenges and deliver required results has and continues to be a slowly metastasizing cancer at the heart of the public sector. This sobering conclusion is echoed in another recent paper, “The Political Scar of Epidemics”, by Askoy et al. They find “that epidemic exposure in an individual’s impressionable years (ages 18 to 25) has a persistent negative effect on confidence in political institutions and leaders [and] find similar negative effects on confidence in public health systems, suggesting that the loss of confidence in political leadership and institutions is associated with healthcare-related policies at the time of the epidemic.” |
| In “Ethnic Antagonism Erodes Republicans’ Commitment to Democracy”, Vanderbilt University’s Larry Bartels finds that, “Most Republicans in a January 2020 survey agreed that ‘the traditional American way of life is disappearing so fast that we may have to use force to save it.” More than 40% agreed that 1a time will come when patriotic Americans have to take the law into their own hands.’ (In both cases, most of the rest said they were unsure; only one in four or five disagreed.)” Batels “uses 127 survey items to measure six potential bases of these and other antidemocratic sentiments: partisan affect, enthusiasm for President Trump, political cynicism, economic conservatism, cultural conservatism, and ethnic antagonism. “The strongest predictor by far, for the Republican rank-and-file as a whole and for a variety of subgroups defined by education, locale, sex, and political attitudes, is ethnic antagonism—especially concerns about the political power and claims on government resources of immigrants, African-Americans, and Latinos. “The corrosive impact of ethnic antagonism on Republicans’ commitment to democracy underlines the significance of ethnic conflict in contemporary US politics.” | SURPRISE This is a stunning finding, that begs the critical questions of (a) whether ethnic antagonism has increased compared to the past, and (b) what has caused it. It is hard not to believe that factors like the stagnation of real median household income, rising costs for the basics of middle class life (housing, education, healthcare, and adequate retirement saving), worsening inequality, increasing perceptions of an unfair system and declining opportunity, and, more recently, the rise of moralizing racial identity politics (particularly among the most educated voters) that attacks “white supremacy” and casts minorities as victims of structural oppression -- have not all contributed to this result. But this just begs the existential question of whether the US political system retains the capacity to effectively address these issues. |
| In August, after rioting in many cities, lethal violence finally broke out – in Kenosha, Wisconsin and Portland, Oregon – between members of America’s extreme left and right. | SURPRISE It is likely that most Americans intuitively sensed that these shootings crossed a critical line. For example, Andrew Sullivan wrote, “let’s be frank about this and call this by its name: this is very Weimar. The center has collapsed. Armed street gangs of far right and far left are at war on the streets. Tribalism is intensifying in every nook and cranny of the culture. “The establishment right and mainstream left both tolerate their respective extremes because they hate each other so much. “The pattern is textbook, if you learn anything from history: an economic crisis resulting in mass unemployment; the pent-up psychological disorders a long period of lockdown can and will unleash; a failure of nerve on the part of liberals to defend the values and institutions of liberal democracy, and of conservatives to keep their own ranks free of raw demagogues and bigots. “But critically: a growing sense of disorder and violence and rioting as simply the background noise; and a sense that authorities do not have the strength or the stomach to restore order.” |
| Both the Democratic and Republican Parties held their national conventions in August. Both conventions were criticized. Democrats were silent about both the urban rioting voters had witnessed, and how they would address the challenges facing the nation if Biden is elected (perhaps reinforcing some voters uncertainty about whether the progressive or traditional wing of the party will govern if the Democrats win). Instead of offering positive and hopeful proposals for change, they focused on criticizing Trump, led by former President Obama’s searing speech. Perhaps more damaging, as Peggy Noonan observed, “there was a nonstop hum of grievance at the convention. To show their ferocious sincerity in the struggle against America’s injustices, most of the speakers thought they had to beat the crap out of the country—over and over. Its sins: racism, sexism, bigotry, violence, xenophobia, being unwelcoming to immigrants. The charges, direct and indirect, never let up.” The Republicans didn’t even bother to publish a party platform. Apparently, Donald Trump is the platform. Incredibly, they praised Trump’s leadership during the COVID-19 crisis. But they also repeatedly focused on what Peggy Noonan called, “rising crime, looting and rioting in city protests, increased unease about personal safety, and besieged police forces.” | SURPRISE After the conventions, Joe Biden’s previous national polling advantage over Donald Trump began to shrink. He promptly flew to Pittsburgh, and in a speech strongly stated that, “rioting is not protesting. Looting is not protesting. Setting fires is not protesting. None of this is protesting. It's lawlessness, plain and simple. And those who do it should be prosecuted," Biden said. "Violence will not bring change, it will only bring destruction. It's wrong in every way." But he then proceeded to blame the nation’s urban violence on Donald Trump. There is an old saying in politics, that in the face of uncertainty and fear, voters need both truth and hope. Unfortunately, the two parties’ conventions gave them neither, and almost certainly increased uncertainty and anxiety among the swing voters in the swing states that both candidates need to win in November. In doing so, they shifted psychological focus of this campaign to security, which, the narrowing polls suggest favors Donald Trump. And thus we are confronted with an outcome that seemed very unlikely before the conventions: a tightening race, but also one in which Biden remains in the lead, both nationally and in key swing state polls. Between now and November, a COVID resurgence and/or a sharp decline in the economy will likely favor Biden. Continuation of urban violence, and/or a significant worsening in the US-China conflict, and/or a weak Biden debate performance will likely favor Trump. Finally, there is also the wildcard of election day shenanigans by the Republicans involving mail ballots, which, because of COVID, will be much more important this year (and also the likely basis of Biden challenging the election result if he loses). |
| | |
| | |
| | |
| | |
| | |
| | |
| | |
| | |
| | |
| New Financial Markets and Investor Behavior: Indicators and Surprises | Why Is This Information Valuable? |
| August saw multiple commentaries questioning current equity market valuations. For example, in “Reasons Not to Be Cheerful”, GMO’s James Montier (whose thinking I have long admired) wrote that, “Never before have I seen a market so highly valued in the face of overwhelming uncertainty.” He noted that he had “written countless times over the years that overoptimism and overconfidence are a particularly heady and potently dangerous combination because they lead to the overestimation of return and the underestimation of risk. This combination strikes me as the best description of our current juncture…Voltaire observed, “Doubt is not a pleasant condition, but certainty is absurd.” The U.S. stock market appears to be absurd.” Similarly, in “What Explains The Covid-19 Stock Market?”, Cox et al conclude that, “market movements during COVID-19 have been more reflective of sentiment than substance. | The combination of substantially overvalued stock markets, and poor appreciation of the extensive damage being done to the real economy as a result of the COVID pandemic are setting the stage for another sharp uncertainty shock. If this occurs before the November election, all else being equal it will increase the probability that Biden will win. |
| In “Choosing Investment Managers”, Goyal et al reach damning conclusions about the effectiveness of pension consultants who advise plan sponsors on investment manager selection. Specifically, they “study how plan sponsors choose investment management firms from their opportunity set when delegating $1.6 trillion in assets between 2002 and 2017. Two factors play an influential role in choice: pre-hiring returns, and pre-existing personal connections between personnel at the plan (or consultant advising the plan), and the investment management firm. “Post-hiring returns for chosen firms are significantly lower than those for unchosen firms. The post-hiring returns of firms with relationships are, at best, indistinguishable from those without relationships, and often significantly worse. “While relationships are conducive to asset gathering by investment managers, they do not appear to generate commensurate benefits for plan sponsors via higher gross returns or lower fees.” | This paper provides yet more evidence that the probability of sustaining true investment skill declines exponentially with time as the complex system generating returns on multiple assets and asset classes continues to evolve. Balanced against this evidence, however, is a powerful mix of overoptimism, overconfidence, and/or incentives that cause some people – including those with a fiduciary duty to others – to reject it, and/or to believe that it does not apply to them. |
| “Past performance is not indicative of future results” is a warning found in every investment product’s prospectus. In “Return Expectations of Institutional Pension Investors”, Andonov and Rauh provide further evidence that many the world’s largest investors don’t believe it. Specifically they study the publicly disclosed asset class return assumptions and portfolio allocations used by public pension funds in the United States, which manage USD 4 trillion in assets. They ask, “what do institutional investors believe about the expected returns of the asset classes in which they invest, and how do they set these expectations?” They find that, “institutional investors rely on past performance in setting future return expectations, and these extrapolative expectations affect their target allocations [to different asset classes].” The authors acknowledge that, “extrapolating past returns to future expectations could be justified if there is long-term persistence in the cross-section of pension fund performance. In particular, it would be rational to extrapolate past performance if the extrapolation were based on asset classes where past performance robustly predicts future performance, due to better skill or access to higher-quality external managers.” However, they find that this is not the case. | Because of its unique methodology, this paper provides exceptionally strong evidence that, despite explicit warnings against it, past investment performance still exerts a powerful influence even on the decisions of sophisticated managers with a fiduciary duty of care to pension plan beneficiaries. |
| | |
| | |
| | |
| | |
| | |
System Tipping Points/Critical Threshold Analysis
Like Professors Andrew Lo, Doyne Farmer and others, we regard financial markets as a complex adaptive system (CAS), that exist as part of a larger macro system comprised of other CAS between which there are multiple feedback loops. These other systems include those that produce technology innovations, and economic, environmental, national security (including cyber), social, demographic, and political outcomes.
We also find that these systems tend to operate and generate effects in a rough chronological sequence, albeit with many feedback loops between them. The following chart highlights that the changes we observe in different areas at any point in time are actually part of a much more complex evolutionary process.
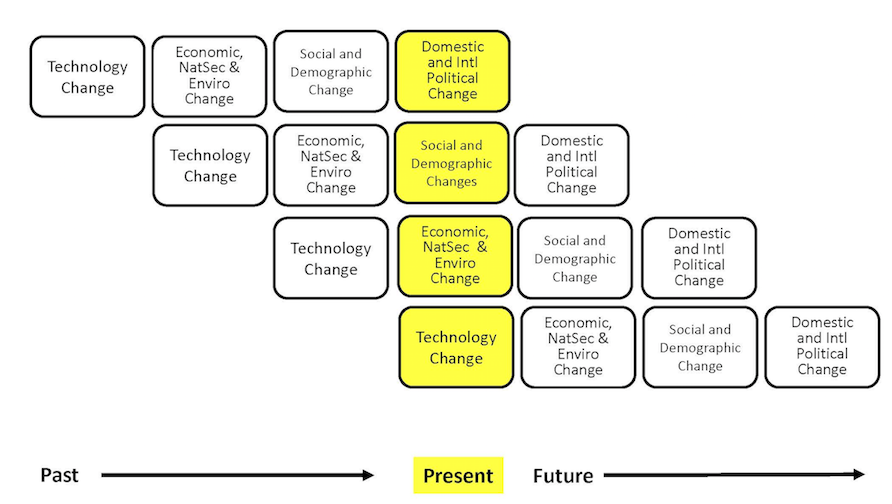
While most media coverage of these systems focused on flows (e.g., the size of the government deficit), rapid non-linear change in complex adaptive systems is often caused by a key stock (e.g., the amount of outstanding government debt) exceeding a critical threshold.
The next table highlights the key macro system stocks that we monitor.
In the next section, we will discuss information received over the past month that is related to these stocks, and which we believe is significant to our assessment of the probabilities that a critical threshold will be reached and a regime change will occur. We will conclude with our estimate, at the end of this month, of how close the macro system is to these critical thresholds, and the implications for financial market regime change probabilities.
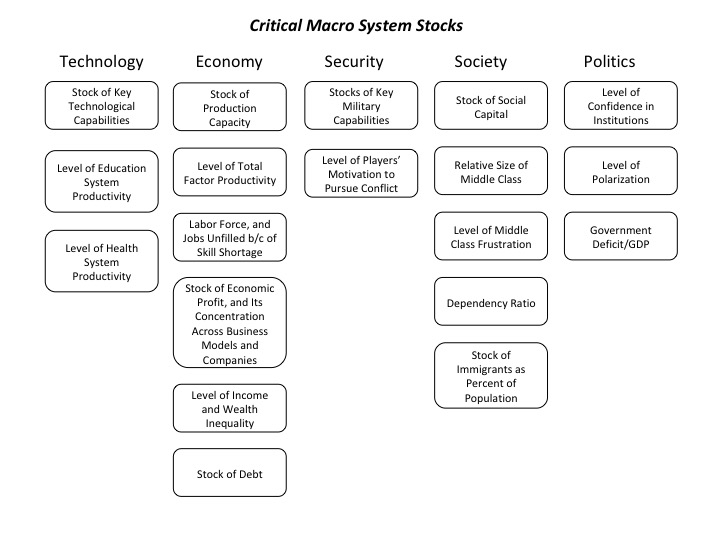
How Close is the Macro System to One or More Critical Thresholds?
As we have noted, the macro drivers of financial market regime changes typically follow a rough chronological sequence, from technology to economic, security, social, and political causes and effects. Yet there are many feedbacks loops between them, creating complex root causes for many of the critical thresholds we have identified.
Understanding the time dynamics in this complex system is critical to avoiding substantial downside investment risk.
We use the UK Met Office Warning Model to communicate our assessment of these time dynamics. We estimate the time remaining before a critical macro system threshold is reached that could trigger a regime change, which is usually accompanied by substantial changes in asset class valuations.
The model uses three increasingly serious levels of warning, from “Be Aware” (condition yellow), to “Be Prepared” (condition orange), to “Take Action” (condition red).
For our purposes, we denote as “Be Aware” (yellow) critical thresholds that we assess to be three or more years away. We estimate that “Be Prepared” (orange) thresholds could be reached within 1 to 3 years. “Take Action” thresholds are very likely to be reached within one year.
Given their nature, we also note that in our three “wildcard” areas (Environment and Energy related; Disease and Human Caused Bioevents; and Cyber and Electromagnetic Events), our forecasts have higher levels of uncertainty.
The following charts summarize our current estimate of the time remaining before different critical thresholds will be reached.
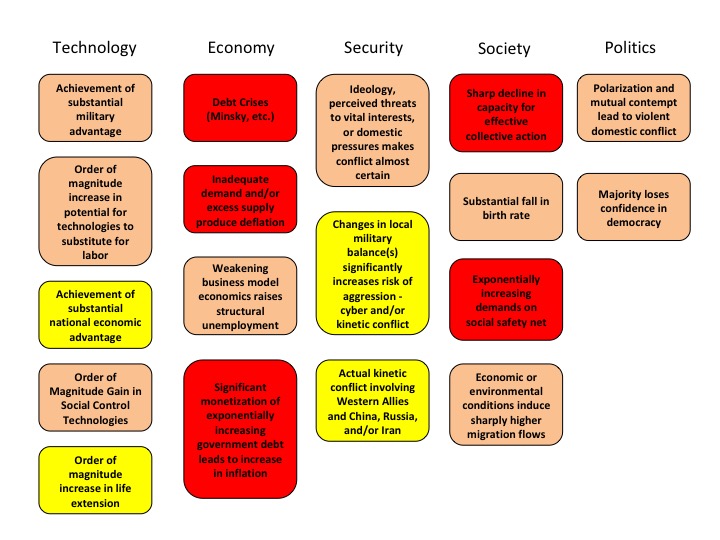
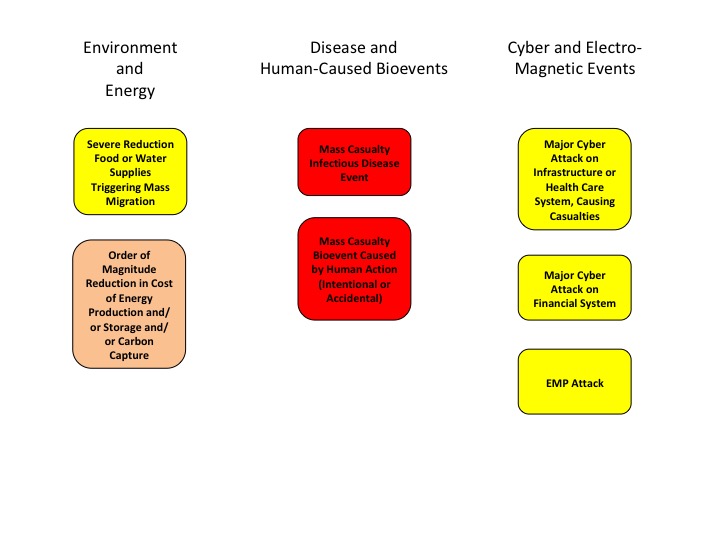
At the highest level, we believe the complex adaptive global macro system can be in one of four states, based on its degree of order versus disorder, and degree of social cooperation versus conflict. A very coarse-grained reading of history suggests that these states evolve in a predictable cycle, from ordered/cooperative, to disordered/cooperative, to disordered/conflicted, to ordered/conflicted.
We believe that the system is currently in its most uncertain state, characterized by high degrees of underlying disorder and social conflict, both domestically and internationally. Beyond some point, intensifying conflict eventually increases the degree of order in the system. That appears to be happening now, via the increasing conflict between China, Russia, and Iran and the United States and other Western nations.
If you have any questions about anything we have written in this issue, please don’t hesitate to get in touch, at contact@indexinvestor.com
Appendix: Anticipatory Thinking and Forecasting Methodologies
Our process is based on methods and tools developed over the past seven years at our affiliate, Britten Coyne Partners, which provides consulting services and education courses to executive teams and boards on strategic risk governance and management.
At The Index Investor, we engage in both anticipatory thinking to identify what could happen (e.g., different macro regimes and related events), and forecasting, to estimate the probability that events and regimes will happen, and the impact they will have if they do (e.g., on macro variables and broad asset class returns).
With respect to what could happen, we are acutely conscious of the conclusion reached by a 1983 CIA study of failed forecasts: "each involved historical discontinuity, and, in the early stages…unlikely outcomes. The basic problem was…situations in which trend continuity and precedent were of marginal, if not counterproductive value."
When it comes to forecasting, we know that in complex socio-technical systems that are constantly evolving, the accuracy of statistical or machine learning based forecasting methods declines exponentially as the time horizon lengthens, since the historical data set on which they were trained will (depending on the speed and effectiveness of any retraining cycle) bear less and less resemblance to the distribution of outcomes the system is likely to produce in the future.
Under these circumstances, forecast accuracy over longer time horizons depends on causal and counterfactual reasoning about the possible future effects of multiple interacting trends and uncertainties that are hard to quantify.
And we are acutely aware of the economist Rudi Dornbusch's famous warning: "Crises take a much longer time coming than you think, then happen much faster than you would have thought."
Our forecasting process also draws on lessons Tom Coyne learned from spending four years as a member of the Good Judgment Project team, which won the Intelligence Advanced Research Projects Activity’s forecasting tournament with forecast accuracy that was more than 50% better than the tournament's control groups (the team's experience is described in Professor Philip Tetlock's book, “Superforecasting").
Our analysis focuses on the probability of the global macro system being in four possible macro regimes 12 and 36 months from the date of our forecast: (1) Normal Times, where equity asset classes perform well; (2) a High Uncertainty regime that is usually short and transitory, where asset classes like short-term government bonds perform best and equities suffer significant declines; (3) High Inflation (which we deem 5% or more, year-on-year), where commercial property, real return bonds and other traditional hedges are favored; and (4) Persistent Deflation (a year-on-year decline in the US CPI), which up to now has only been seen in Japan, and in which the relative performance of different asset classes remains uncertain, but will likely favor high quality bonds and the consumer staples equity sector.
In response to subscriber requests, we have added a 36-month regime forecast to our existing 12 month forecast. The logic is that, in a complex evolving system like global macro, a longer forecast horizon gets beyond the “detection range” of algorithmic forecasting approaches, and therefore raises probability that a manager/investor can gain an edge in identifying emerging threats and opportunities.
That said, because evolving (i.e., “non-stationary”) complex systems populated by highly connected human agents are also capable of sudden non-linear changes (with which are hard for algorithmic approaches to predict), we are also keeping our 12 month forecast.
Our forecasting methodology starts with base rate/reference case data about the historical probability of large changes in equity and bond valuations. We then analyze the current situation from both a quantitative and qualitative perspective. In the latter, we focus on the key endogenous drivers of macro regime change, including technological, economic, national security, social, and political trends and uncertainties. We also focus on three potential sources of exogenous shocks that could also produce a macro regime change, caused by environmental, disease, and cyber related events.
While most of our attention typically focuses on various flows (e.g., economic growth, change in the price level, sales, earnings, job creation, etc.), endogenously caused regime changes result when those flows push key stocks beyond a critical threshold or tipping point, often setting off non-linear reactions across multiple areas. As noted by Hyman Minsky and others, a classic example is the steady accumulation of outstanding debt until it reaches the point where it can no longer be serviced and triggers a crisis.
Base Rate Data
Since the end of World War Two, there have been fifteen months where a downturn in the US equity market began that eventually reduced asset class value by 20% of more. That is a hazard rate of about 1.75% per month. Put differently, in any given month there is a 98.25% probability that a 20%+ downturn won’t occur, or, in a given year, an 81% probability.
However, as the time without a 20%+ downturn extends, the compound probability that one will not occur shrinks. At the end of August 2018, it is more than nine years since the last equity market decline of 20% or more. The probability of that happening is only 15%.
To estimate the base rate for a 20% fall in bond prices (which historically has been caused by a sharp increase in inflation, as we saw in the late 1970s and early 1980s), we analyzed monthly historical AAA bond yields since 1919. For consistency, we used them to calculate the price of a ten-year zero coupon bond. We then calculated the probability of a price decline of 20% or more over three different holding periods: 12, 18, and 24 months. In any month, the annualized probability of a decline of 20% or more over the subsequent 12 months is 12%; over 18 months, 20%, and over 24 months, 25%.
Market Stress Indicators Methodology
We view financial markets as a complex adaptive system. The size of changes generated by such a system follows a power law rather than a normal (Gaussian) distribution. The critical point is that large changes are much more common in complex adaptive systems than most people’s intuition leads them to believe.
While predicting the behavior of complex adaptive systems remains far more art than a science, various researchers have found that large changes in such systems are often preceded by subtle warning signs, as stress accumulates within them. While this research is not definitive, we believe that five warning signs are worth monitoring as potential indicators of growing stress within financial markets that could suddenly give rise to large changes in asset class valuations.
Our first indicator is the month-to-month autocorrelation of broad asset class returns (i.e., the relationship of this month’s returns to last month’s). A system under increasing stress loses resiliency, causing it to take longer to recover from perturbations; hence, autocorrelation increases as it approaches a critical transition (see, “Early Warning Signals for Critical Transitions” by Scheffer, et al).
The second market stress indicator we monitor is the Economic Policy Uncertainty Index published by the Federal Reserve Bank of St. Louis (via its FRED economic database), which is based on research by Baker, Bloom, and Davis (see their paper, “Measuring Economic Policy Uncertainty”). The index is based on automated text analysis of leading newspapers and magazine publications, to identify the frequency with which words and phrases are used that indicate uncertainty.
In humans’ evolutionary past, when uncertainty increased the probability of survival was enhanced by staying close to a group. All of us still have that instinct. Research has found that as uncertainty increases, we have an unconscious bias towards higher conformity of our own views with those of a larger group (i.e., reduction in cognitive diversity). Behaviorally, heightened uncertainty induces more “social copying” of others, likely due to both conformity bias and the rational belief that others may be acting on the basis of superior information. This increase in conformity and copying makes a social system more ordered as uncertainty increases, and also reduces its responsiveness to perturbations (i.e., increases autocorrelation) because of delays in the social copying process.
The key point is that increasing uncertainty induces more, not less order in social systems, and in so doing primes them for sudden non-linear change.
Our third market stress indicator is the spread between the yield on AAA rated bonds and the 10-year US Treasury. This is a proxy for the level of investor concern about financial system funding liquidity.
Our fourth market stress indicator is the yield spread between speculative BB rated bonds and the ten-year US Treasury. Throughout history, excessive credit growth has been a root cause of many financial crises. An indicator of such growth is falling credit spreads, particularly in the case of riskier borrowers. In contrast, rising BB spreads indicate growing investor concern about the consequences of such growth, and the financial distress lower rated companies could experience in an economic downturn.
Our fifth market stress indicator is what we term the “political risk premium” that is implicit in the price of gold. Our starting point for estimating this premium is the three different roles that gold plays. First, gold is a store of value in a world of fiat currencies. When the rate of money supply growth exceeds the growth of nominal GDP, gold’s price should increase to maintain its purchasing power. Between 2007 and 2017, the US money supply (M2) grew by about 86%, while nominal US GDP grew by 35%. The stock of gold grew by 18%, based on mine production over this period. We therefore infer that 33% of the increase in the price of gold represented the maximum potential gold price change that could be attributed to a desire to hedge inflation risk (86% less 35% less 18%).
Second, gold is a unit of account. We take this to mean that the annual change in GDP expressed in terms of physical gold (i.e., nominal GDP divided by the price of gold) should equal the change in real GDP calculated using the GDP price deflator to account for actual inflation over the period. A key challenge is the point at which to start this calculation.
We chose the price of gold in 1995/1996. In that period, the change in real global GDP measured using the IMF’s price deflator just about equaled the change in GDP measured in terms of physical gold. We interpret that coincidence as indicating that at that point in time, concerns about future inflation and political risk were minimal, and the change in the price of gold was mostly driven by its role as a unit of account. We calculated a subsequent series of gold prices that would produce the same change in “gold GDP” as the actual real GDP as calculated by the IMF. Between 2007 and 2017, “gold as a unit of account” warranted a 21% increase in its price.
Gold’s third role is as a hedge against inflation and what we term “political disaster” risk. We subtract the 21% estimated compensation for actual inflation from the 33% “gross” inflation risk hedge to derive an apparent 12% increase in the gold price that reflected the true risk premium to hedge against possible future inflation. However, between 2007 and 2017 the price of gold actually increased by 81%. This implies that 48% of this (81% less 21% less 12%) represented a premium for some other type of uncertainty at the end of 2017. The interesting question is the nature of the uncertainty for which gold is believed by some investors to be a superior hedge than traditional ports in a storm like short-term US government securities, or similar securities issued by other developed countries.
The logical inference is that the uncertainty in question must reflect a situation in which short term US Treasuries would be a less effective hedge than gold. This could be a world of widespread hyperinflation, capital controls, and/or radical changes in nations’ governments (of course, this would also imply a preference for investing in gold coins rather than bullion, as while the latter may be a store of value, it is far less convenient as a means of paying for transactions).
To put this in further perspective, this gold price “disaster risk” premium sharply increased from 2008 to 2012, then declined before sharply increasing again after 2016. Arguably, a significant part of the former increase reflects concerns about the potential inflationary consequences of dramatic quantitative easing by central banks. But this is not likely to be the case after 2016.