The Index Investor
October 2020
Tactical Asset Allocation Implications of Our Forecasts
Recent Quantitative Indicators
Forecast Pre-Mortem Analysis
Combining and Extremizing Forecasts to Improve Predictive Accuracy
Feature Article: Will Xi Jinping Launch a Surprise Attack on Taiwan Before the 20th Party Congress of the CCP in 2022? And What Happens if He Does?
High Value Information Observed Last Month:
- Technology
- Energy and Environment
- Health and Disease
- Economy
- National Security
- Society
- Politics
- Financial Markets and Investor Behavior
Critical System Thresholds/Tipping Points Analysis
Appendix: Anticipatory Thinking and Forecasting Methodologies
Current Macro Forecast
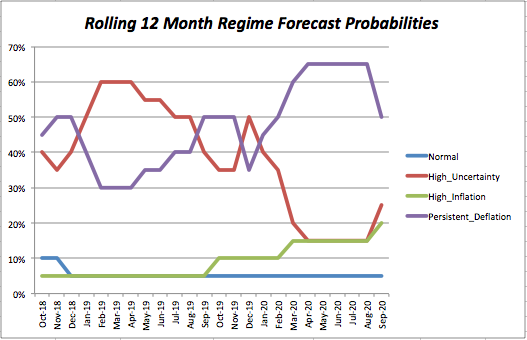
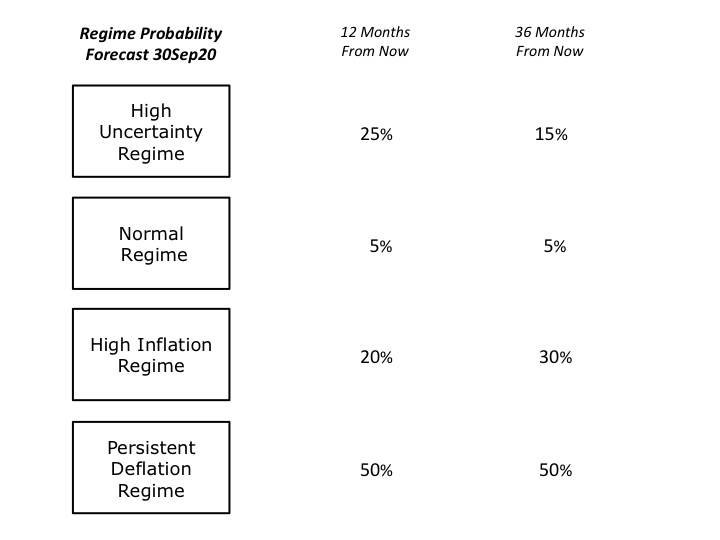
The principal reasons for these changes were (1) a large number of new indicators of worsening tensions between China and the United States, leading to increasing uncertainty about a possible Chinese attack on Taiwan before the 20th Chinese Communist Party Congress in November 2022 (the subject of this month’s feature article); (2) a faltering economic recovery, due to rising COVID infections and the failure of the United States to undertake a second fiscal stimulus initiative, which will very likely lead to an increase in the number of zombie companies as well as increasing insolvencies; and (3) continuing increases in the likelihood that the United States will face a constitutional crisis of unknown duration following the November election, coupled with new evidence of sharp increases in the negative feelings US voters have towards parties other than their own.
We have also made changes to our 36-month regime forecasts, increasing the probability of being in the High Uncertainty Regime by 5% (to 15%) and decreasing the probability of being in the High Inflation Regime by 5% (to 30%). The probability the United States will be in the Persistent Deflation Regime remains 50%, as evidence continues to accumulate that the economy will very likely suffer a deeper and longer downturn than many investors expect.
With respect to the Persistent Deflation Regime, it is important to keep in mind that the headwinds that were restraining aggregate demand growth before the devastating arrival of the COVID-19 pandemic either have not improved or are worsening. These include slower population growth and faster aging, weak productivity growth (which will worsen if students’ widespread COVID learning losses are not recovered), declining labor share of GDP, rising levels of both inequality and debt, and the growing threat of job displacement as increasingly capable automation and artificial intelligence technologies are deployed.
Thus far, the response to the COVID economic shock has been a mix of monetary stimulus (to the extent that is possible when government bond yields are at or below zero) and fiscal stimulus. The politically difficult structural policies needed to address these pre-existing headwinds are still missing.
Whether the High Inflation Regime comes to pass will depend on the interaction between COVID19’s shocks to demand and supply, along with even more important political factors.
In our view, the most logical cause of a return to the High Inflation regime over the next 36 months would be a crisis of confidence in the US government and/or economy that causes a flight from the US dollar and a sharp rise in the price of imported goods (and very likely gold as well), or the outbreak of open conflict between the China and the United States which severely disrupts global supply chains.
The increased probability of being in the High Uncertainty Regime reflects increasing conflict between the United States and China, and, given the tension between he progressive and moderate wings of the Democratic Party, increasing uncertainty about the policy consequences if the it wins the US presidency and controls both chambers of Congress after the November election.
In reviewing the current situation, we are again reminded that when uncertainty is high, people rely more heavily on social learning and copying what others are doing. Not only does this slow the diffusion of new information throughout social systems like economies and financial markets, but it also causes these systems to coalesce around a small number of increasingly fragile narratives. Under these conditions, rapid, non-linear changes are very likely to occur.
That certainly appears to be the case today in global financial markets, where valuations continue to be substantially misaligned with trends in the real economy, politics, and international relations.
As a result, further uncertainty shocks to the currently dominant market narrative almost certainly lie ahead.
Portfolio Allocation Implications of Our Forecast
We take two approaches to deriving the tactical asset allocation implications from our analyses (i.e., deviations from our "neutral" or base case model portfolio).
The first takes a systematic approach, and is based on relative asset class valuations. Our starting point is our neutral model portfolio, which is equally weighted across nine broad asset classes, and also includes 5% allocations to alpha strategies (equity market neutral and global macro) that are designed to have a low correlation to returns on broad asset classes.
Based on asset class valuations, we systematically vary the asset class weights (but not the active strategy weight), increasing from 10% to 15% when an asset class is likely undervalued, and 15% when it is very likely undervalued. In the case of overvaluations, we go to 5% and then into cash, if there are no undervalued asset classes with room for an increase. In effect, this replicates the systematic rebalancing strategy we used for 15 years in our previous model portfolios.Based on subscriber requests, this month we are re-introducing a feature from the previous version of The Index Investor: Tactical Asset Allocation Implications from our analyses.
The second tactical approach is based on our subjective view not only of current asset class valuations, but also of the implications of the broader macro trends and uncertainties that we analyze each month. Importantly, this subjective view reflects our primary goal of avoiding large downside losses, rather than seeking large upside gains.
Three final notes: First, with respect to US fixed income, we include credit products (investment grade and high yield) in the same asset class as government debt, and will shift into the former when their valuations become attractive.
Second, we regard gold not as a separate asset class to be held long-term, but rather as a complement to cash, into which we shift in periods of substantial overvaluation across multiple asset classes.
Third, we continue to be deeply concerned by the distortion in asset class valuations that have been created by negative real interest rates on sovereign bonds, which are the foundation of most asset pricing models. In August, we decided to address this distortion by using in our asset class valuation models our estimate of the economically logical real yield on inflation protected US government bonds (TIPs). This brings our quantitative valuation conclusions much closer to those based on our qualitative analysis.
More information about our investment beliefs, including our core philosophy, approach to asset allocation (including our model portfolios and their long-term track record), and views on various approaches to active and passive management can all be found here.
Here is our latest asset allocation view:
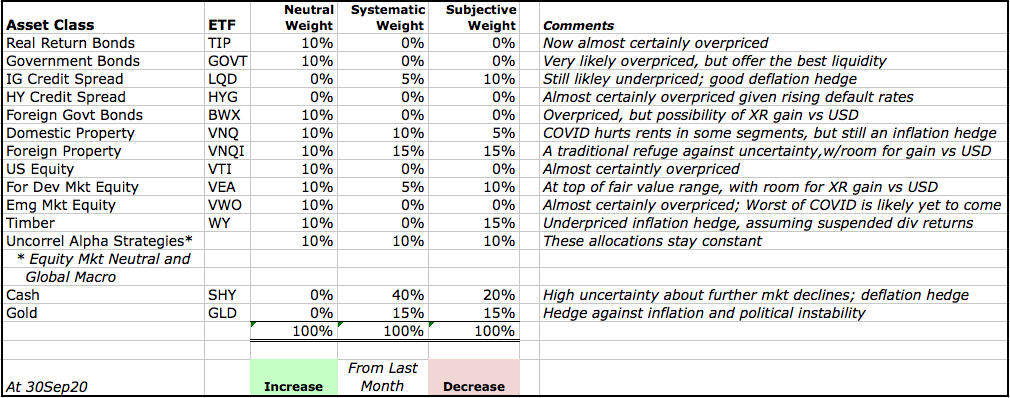
To expand our comment about timber. WY’s dividend was suspended when the COVID pandemic arrived. Up to that point, timber had very likely been undervalued. We assume the dividend will resume; hence it is very likely still is undervalued. However, if the dividend suspension is permanent, then it is almost certainly overvalued.
.
Forecast Logic: Quantitative Indicators
Implications of the Most Recent Three Month Asset Class Returns
Our quantitative forecast methodology focuses on the level and change in three-month returns, over the most recent and previous three-month periods, for those asset classes, which should perform best under different regimes (in this sense, our regimes can be regarded as macro factors). We assume that relatively higher returns are associated with more widely held investor belief in the probability that a given macro regime will develop in the future.
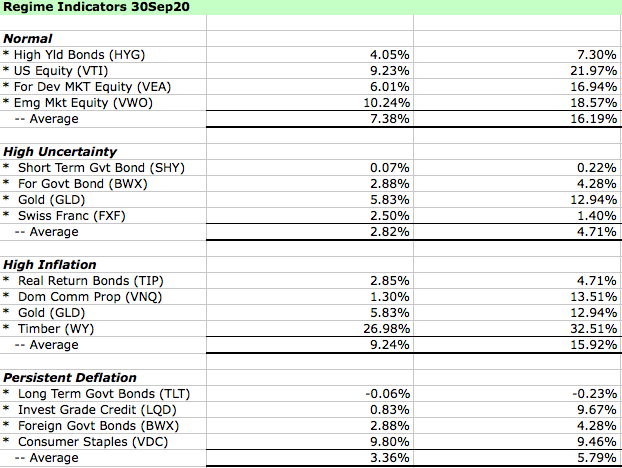
At the end of last month, rolling three-month returns on different asset classes implied that the marginal investor viewed the Normal and High Inflation regimes as the most likely to develop in the future, just as they did last month. As noted in our forecast, we disagree with this assessment, and the narratives on which it rests.
Asset Class Valuation and Momentum Indicators (@30Sep20)
| Asset Class (ETF) | Valuation | 1 Month Return | Conclusion |
| US Real Return Govt Bond (TIP) | Almost Certainly Overpriced* | (0.38)% | Decreasing Overvaluation |
| US Nom Return Govt Bond (GOVT) | Very Likely Overpriced* | 0.27% | Increasing Overvaluation |
| US Investment Grade Credit (LQD) | Likely Underpriced* | (0.44)% | Increasing Undervaluation |
| US High Yield Credit (HYG) | Almost Certainly Overpriced* | (0.93)% | Decreasing Overvaluation |
| US Commercial Property (VNQ) | Within Fairly Priced Range* | (2.69)% | Fairly Valued |
| US Equity (VTI) | Almost Certainly Overpriced* | (3.55)% | Decreasing Overvaluation |
| Foreign Devel Mkt Equity (VEA) | Within Fairly Priced Range* | (1.79)% | Fairly Valued |
| Emerging Markets Equity (VWO) | Almost Certainly Overpriced* | (1.19)% | Decreasing Overvaluation |
| Timber (WY) | Almost Certainly Overpriced* (due to temporary dividend suspension) | (5.91)% | Decreasing Overvaluation |
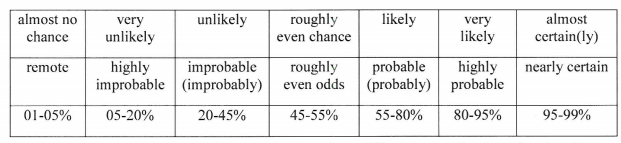
Note: The language we use to describe our estimated likelihood of asset class over or undervaluation is based on US Intelligence Community Directive 203 on Analytic Standards, which includes the following table:
Market Stress Indicators (@30Sep20)
| Market Stress Indicator | This Month vs Last Month |
| Asset Class Returns Autocorrelation (this month versus last month). Higher autocorrelation is an indicator of higher market stress. | (.73) vs .49 the previous month. This indicates a substantial increase in the level of market stress. |
| Economic Policy Uncertainty Index (how many days over the last 30 was index in top quartile of values since 1985?). A higher number equals more market stress. | On 29 days last month (one less than the previous month) the index was in the top quartile of daily values since 1985 (the 99th percentile of all rolling 30-day periods). |
| AAA Rated Bonds Spread over 10 Year Treasury Yield (month end). Higher spreads indicate rising concern about market liquidity. | 1.63% (71st percentile since 1983), vs 1.70% (76th) at the end of the previous month, indicating a high level of market stress. |
| BB Rated Bonds Spread over 10 Year Treasury Yield (month end). High spreads indicate increasing credit risk. | 4.00%, (66th percentile) up from 3.54% last month, indicating a rising level of stress. |
| Gold Price per Ounce in US Dollars (month end). Rising gold prices are an indicator of increasing market uncertainty and stress. | $1,883 vs $1,955, down (4%) from the previous month. At the end of 2017, we estimated the “disaster premium” in the gold price was 47% (see our methodology in the Appendix). At the end of last month it was 92%. |
Pre-Mortem Analysis
One of the most important forecasting disciplines is to ask yourself why your forecast could be wrong. Dr. Gary Klein’s research has shown that a very powerful and insightful way to do this is via a “pre-mortem analysis.” This method asks you to assume that it is a point in the future, and your forecast has been proven wrong (or your strategy or company has failed). You are then asked to look backward from this imagined point in the future, to explain why you failed, what you missed, and what you could have done differently to avoid your fate.
The pre-mortem method takes advantage of the fact that humans reason much more concretely and in more detail when explaining the past than they do when trying to forecast the future.
So let us assume that it is one year from now, and our current forecast has turned out to be wrong.
How did this happen? What developments did we fail to anticipate?
- A number of world leaders – Xi Jinping and Donald Trump, and to a lesser extent Vladimir Putin and Ali Khamenei are all facing sharply weakened economies and declining political popularity. History teaches us that this can lead to increased “foreign adventurism” to distract the public from worsening domestic conditions, as a nation rallies around its leader in a period of heightened external conflict. Should a “kinetic” conflict develop between China and the United States, or Iran and Israel, Saudi Arabia, and/ or the US, or between Russia and one or more European countries (e.g., due to a Russian incursion into the Baltics), it would generate a very sharp increase in uncertainty that would likely accelerate the already sharp COVID-19 economic slowdown. Given given high debt levels, this would very likely accelerate the arrival of the Persistent Deflation Regime.
- On the other hand, the removal from office (by one means or another) of Xi Jinping or Donald Trump * could * lead to a reduction in the dangerously growing conflict between the two nations, and increase cooperation in both the fight against COVID19 and the recovery of the global economy. This would somewhat reduce the probability of both the Persistent Deflation and High Inflation Regimes, and raise the relative probabilities of the High Uncertainty and Normal Times Regimes.
- A supply side shock of some type – beyond the disruption of global supply chains caused by COVID-19 -- could produce a sudden increase in inflation. The most likely scenario is a reduction in oil supplies due to a prolonged kinetic conflict between Iran and the US. An unlikely scenario could be major crop failures associated with the next solar cycle, which NASA forecasts will be the weakest in 200 years. McKinsey recently concluded that the probability of such a failure has increased due to changes in the environment, and now stands at about 10% over the next five years ("Will the World’s Breadbaskets Become Less Reliable?”).
- Another route to the high inflation regime (repeatedly noted by Bridgewater’s Ray Dalio) would be a sudden loss of confidence in the US dollar relative to other currencies (driving up import prices), perhaps because of increasing deficit monetization and policy paralysis if a severe downturn continues without meaningful policy reforms to address critical structural challenges. However, a sharp rise in import prices due to a collapse in the USD exchange rate also requires relatively higher confidence in another currency, with the Euro being the most likely candidate. This currently seems unlikely, given both the Eurozone’s economic and political uncertainty, and the prospect of an intensifying conflict between the West and China. If confidence collapsed in all major currencies, the price of gold would rise, and price inflation would only occur in terms of gold.
Note: Combining Our Forecasts with Others From Other Sources and Extremizing the Result Should Increase Your Predictive Accuracy
Research has found that three steps can improve forecast accuracy. The first is seeking forecasts based on different forecasting methodologies, or prepared by forecasters with significantly different backgrounds (as a proxy for different mental models and information). The second is combining those forecasts (using a simple average if few are included, or the median if many are). The final step, which significantly improved the performance of the Good Judgment Project team in the IARPA forecasting tournament, is to “extremize” the average (mean) or median forecast by moving it closer to 0% or 100%.
Forecasts for binary events (e.g., the probability an event will or will not happen within a given time frame) are most useful to decision makers when they are closer to 0% or 100% than the uninformative “coin toss” 50%. As described by Baron et al in “Two Reasons to Make Aggregated Probability Forecasts More Extreme”, forecasters will often shrink their probability estimates towards 50% to take into account their subjective belief about the extent of potentially useful information that they are missing.
When you average multiple forecasters’ estimates, you are including more information, which should increase forecast confidence and push the mean estimate closer to 0% or 100%. However, this doesn’t happen when you use simple averaging. For this reason, forecast accuracy is increased when you employ a structured “extremizing” technique to move the mean estimate closer to 0% or 100%.
You can download an extremizing model from our website to use when combining the forecasts you use in your decision process.
The extremizing factors in our model are those that the Good Judgment Project found maximized the accuracy of combined forecasts. Note that the extremizing factor is lower when average forecaster expertise is higher. This is based on the assumption that a group of expert forecasters will incorporate more of the full amount of potentially useful information than will novice forecasters.
Feature Article: Will Xi Jinping Launch a Surprise Attack on Taiwan Before the 20th Party Congress of the CCP in 2022? And What Happens if He Does?
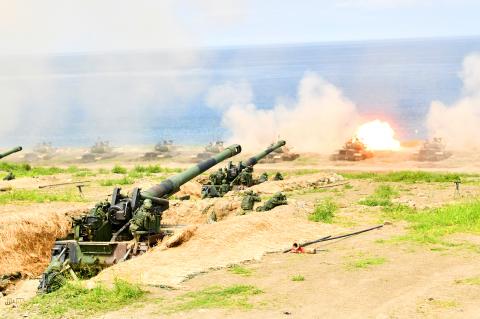
Over many years of forecasting we have always kept in mind the conclusion reached by a 1983 CIA study of failed forecasts: "Each involved historical discontinuity, and, in the early stages…unlikely outcomes. The basic problem was…situations in which trend continuity and precedent were of marginal, if not counterproductive value."
When you think about disruptive shocks that would almost certainly have a long lasting global impact, what’s the next one that comes to mind after COVID-19?
For us, it is a war between China and the United States. This analysis covers the following:
• Background: The Context in Which War Would Occur
• Why Do Nations Go to War?
• Why Xi Jinping Might Go to War – and Why He Might Not
• Recent Indicators
• The Potential Consequences of a US-China War
• Conclusions
Background: The Context in Which War Would Occur
Setting the Stage: “How China Sees the World”, by Lt. General H.R. McMaster, former US National Security Adviser
“Since the heady days of Deng Xiaoping, in the late 1970s, the assumptions that had governed the American approach to our relationship with China were these: After being welcomed into the international political and economic order, China would play by the rules, open its markets, and privatize its economy. As the country became more prosperous, the Chinese government would respect the
rights of its people and liberalize politically. But those assumptions are proving to be wrong.
“China has become a threat because its leaders are promoting a closed, authoritarian model as an alternative to democratic governance and free-market economics. The Chinese Communist Party is not only strengthening an internal system that stifles human freedom and extends its authoritarian control; it is also exporting that model and leading the development of new rules and a new international order that would make the world less free and less safe.
“China’s effort to extend its influence is obvious in the militarization of man-made islands in the South China Sea and the deployment of military capabilities near Taiwan and in the East China Sea”...
“The party’s leaders believe they have a narrow window of strategic opportunity to strengthen their rule and revise the international order in their favor—before China’s economy sours, before the population grows old, before other countries realize that the party is pursuing national rejuvenation at their expense, and before unanticipated events such as the coronavirus pandemic expose the vulnerabilities the party created in the race to surpass the United States and realize the China dream”.
“The party has no intention of playing by the rules associated with international law, trade, or commerce. China’s overall strategy relies on co-option and coercion at home and abroad, as well as on concealing the nature of China’s true intentions. What makes this strategy potent and dangerous is the integrated nature of the party’s efforts across government, industry, academia, and the military.
Setting the Stage: “The Shape of a Real Grand Strategy”, by Giselle Donnelly
“Chinese power, even Chinese “soft power”, is inherently coercive, not meant to attract, but to intimidate, to create not partners but tributaries, providers of natural materials, or both. This is not merely the case in Asia, but globally.”
Donnelly also pointedly highlights Xi Jinping’s admonition to the 19th Chinese Communist Party Congress in 2017: “The wheels of history roll on. The tides of the time are vast and mighty. History looks kindly on those with resolve, with drive and ambition, and with plenty of guts. It won’t wait for the hesitant, the apathetic, or those shy of a challenge.”
Setting the Stage: Dr. Tony Saich’s 9Sep20 “Testimony Before the US-China Economic and Security Review Commission”:
“What is the current state of the social contract between the CCP and the Chinese populace? What do Chinese citizens expect from the CCP, and how satisfied are they with the CCP’s performance? How have these changed over time?”
It is incorrect to refer to the arrangement between the Chinese people and the Chinese Communist Party (CCP) as a “social contract” as this implies that both sides have entered into to the contract knowingly and freely. This is clearly not the case as there is no way for Chinese citizens to express their views on such a “contract.” That said, there seems to be an implicit agreement on the part of many that the CCP is expected to deliver stability, economic progress, and social support for its citizens. This is referred to as “performance legitimacy.” It is distinct from CCP appeals to ideology or nationalism. It is pragmatic in nature with concrete goals covering economic growth, stability, and the enhancement of national power.”
“Performance legitimacy is fragile as measures such as good performance can wax and wane. It is inherently unstable and thus is insufficient for maintaining power, as citizens will grow used to the progress, pushing government to produce ever better outcomes to maintain its rule. If the economy continues to slow and the largesse to dispense benefits diminishes, does this mark the end to legitimacy based on economic performance?” …
“There are three predominant analyses about how Chinese citizens view their government and what the likely consequences might be.
“First, there is the view that the government is sitting on a ‘social volcano’ stoked by the rising expectations, worsening income inequality, and with citizens now having alternative information sources, there could be a crisis that triggers large-scale political unrest.”
“Second, there is the view that performance legitimacy has been effective with citizens crediting the CCP for decades of rapid income growth and therefore they are not likely to challenge its rule, unless performance drops precipitously.”
“Third, there is the view that maintains that the CCP’s grip on social order is so powerful that even a clear failure of leadership would be unlikely to affect the loyalty of most Chinese citizens.”
“The rejection of any meaningful political reform would indicate that absent coercion, the administration will remain increasingly reliant on ensuring citizen satisfaction via the provision of public goods and services. Satisfaction trends can reverse, as citizens accustomed to increases in living standards and the benefits they are provided will expect them to continue.”
There are three challenges. The first two depend on how well the government deals with the problem of corruption and the environmental damage that have been part and parcel of the reform program. The third relates to the levels of local government debt. The ability to continue providing public goods will depend on there being adequate fiscal revenue. We know that many local governments in China are heavily indebted and this could diminish their ability to keep up social investment. If economic growth continues to decline, providing adequate financial support could become more problematic…[Rising] debt combined with the aging of the population will place a major strain on government budgets and China might find itself locked into the common “guns versus butter” debates.”
Setting the Stage: “Secrecy and Stratagem: Understanding China’s Strategic Culture”, by Thomas Mahnken
“China’s national strategic culture has four tenets:
• China is culturally superior;
• China’s natural position is that of the “Middle Kingdom”;
• China must be unified internally and free from external meddling; and
• War is costly, destructive, and leads to internal dissension.”
“China’s military strategic culture also has four tenets:
• Safeguarding Chinese territorial integrity is an important military mission;
• The goal of strategy is to exploit the propensity of things, or shi, to achieve one’s objectives;
• War is a scientific process; and
• Through secrecy and stratagem, it is possible to achieve a decisive victory against a superior adversary.”
Setting the Stage: “Which Way The Dragon? Sharpening Allied Perceptions Of China’s Strategic Trajectory”, by Ross Babbag
“This report argues that China’s future trajectory and that of the broader Indo-Pacific region are inherently unstable. There is a strong possibility, maybe a probability, of major changes in the strategic landscape by 2035…
“The geographic and demographic features of China 15–20 years hence are relatively easy to discern. However, many other factors are much more dynamic and could shift in multiple directions in the period ahead…
“The assumption made by many in the West that the rapid rate of economic growth that China has experienced during the last three decades will be maintained during the 2020s is possible but very unlikely. China’s rate of GDP growth has already halved since 2007 and continues to slow. Productivity levels are also falling along with international competitiveness in many sectors. National debt is very high and the budgetary burdens of a rapidly aging population are increasing. In the face of these challenges, as well as biosecurity and other pressures, Xi Jinping’s instinct is to clamp down harder on information flows, further tighten party control, increase the centralization of power and work hard to maintain a sense of normality. Important consequences of this approach are to further constrain economic dynamism and increase the unpredictability of China’s trajectory to 2035…
“China’s current strategic situation is characterized by multiple instabilities and uncertainties. While it is possible that China will continue on its current trajectory towards 2035, it is more likely that there will be significant departures…These important but very uncertain variables include:
1. The power, performance, and durability of the Chinese Communist Party regime.
2. The economic, technological, and corporate progress of the country.
3. The extent to which the regime employs the country’s modernized military aggressively beyond China’s borders.
4. The level of international cooperation or resistance that confronts China.
5. Whether the Chinese regime will seek to rally the country by adopting highly nationalistic rhetoric and international stances.
6. The extent to which the Chinese regime moves to expand its international political, economic and military footprint in key parts of the Indo-Pacific region and beyond” …
“Credible combinations of these ‘driving forces’ [are used] to derive four alternative futures for China—and effectively for the region—in 2035:
1. Xi Jinping’s Dream—a future where just about everything goes well for Xi Jinping and the Chinese Communist Party.
2. Muddling Through—a future where the Chinese regime encounters a series of economic, international and political disappointments but, despite diminished credibility at home and abroad, survives into the late 2030s.
3. Nationalist Drive—a future where serious economic, social, international, and political difficulties cause sporadic outbursts of political dissent. A succession of domestic crises highlights the inadequacies of the party leadership and triggers the replacement of Xi Jinping and most of the current party hierarchy by a nationalist regime with an assertive international stance.
4. Macro-Singapore—a future where economic, social and political difficulties mount but Xi Jinping moves decisively to alter the country’s direction. He institutes far-reaching economic and social reforms, reduces the country’s military and international footprint, and negotiates a genuinely cooperative partnership with the West.”
Setting the Stage: “China's Grand Strategy: Trends, Trajectories, and Long-Term Competition” by Scobell et al
“Any one of the four scenarios is possible three decades hence:
• Triumphant China is least likely because such an outcome presumes little margin for error and the absence of any major crisis or serious setback between now and 2050.
• Imploding China is not likely because, to date, Chinese leaders have proved skilled at organizing and planning, adept at surmounting crises, and deft at adapting and adjusting to changing conditions.
• By 2050, China most likely will have experienced some mixture of successes and failures, and the most plausible scenarios would be an Ascendant China or a Stagnant China. In the former scenario, China will be largely successful in achieving its long-term goals, while, in the latter scenario China will confront major challenges and will be mostly unsuccessful in implementing its grand strategy.”
Why Do Nations Go to War?
Over the years, many analyses have been written about why nations go to war. One of the best known is Geoffrey Blainey’s classic book, The Causes of War. He argues that wars occur when leaders misjudge their nation’s relative strength, which is based on seven factors:
• Military strength;
• Estimates of how third party nations will behave in case of war (e.g., with which combatant they would ally, how much their contribution would be worth, or whether they would stay neutral);
• Perception of the internal unity of the enemy’s and your own nation;
• Strength of your nation’s and your enemies’ memories of their respective suffering in previous wars they have fought;
• Estimates of your nation’s and your enemy’s capacity to economically sustain the costs of war;
• Strength of your nation’s nationalism (and in some cases, ideology) compared to your enemy’s;
• Perception of the personality, mental quality, and will of the enemy’s leader(s) relative to your own.”
Other scholars note that in rare occasions, nations will go to war, even when the odds are against them, because they believe they have no other choice.
The classic example usually given is Japan’s decision in 1941 to launch a surprise attack on the United States, following Franklin Roosevelt’s August 1, 1941 decision to cut oil exports to Japan. At the time, the US provided 80% of Japan’s oil supply. Its best alternative source of oil required an attack on the Dutch East Indies, which Japan believed would inevitably result in the United States declaring war.
Why Xi Jinping Might Attack Taiwan – and Why He Might Not
What arguments might his advisors make to Xi Jinping to convince him to launch an attack on Taiwan? They might include some or all of the following:
• Following China’s passage of its new National Security Law and the de facto end of “One Country, Two Systems” in Hong Kong, peaceful unification with Taiwan seems more remote than ever before, as evidenced by the reelection of Tsai Ing-wen as the latter’s president. Her nationalist Democratic Progressive Party does not support unification with the mainland.
• Hal Brands notes in “If America and China Go to War, It Won’t Be an Accident”, that “If China concludes that Taiwan is distancing itself too far from the mainland politically, as [China perceives] the balance of power shifts in Beijing’s favor militarily, then it might decide that war is better that letting the dream of unification slip away.”
• Similarly in a Hoover Institution Webinar with former US Secretary of State Condoleeza Rice, Chris Patton, the last British Governor of Hong Kong opined that, with respect to an attempt to seize Taiwan, “If Xi thought he could get away with it, he’d try it.”
• Brands also speculated that, “if Chinese leaders worry that their domestic legitimacy is slipping [e.g., because of sharply declining economic performance], they might behave more belligerently in a crisis, for fear that war is less dangerous [to the CCP’s hold on power] than humiliation [in a crisis with the United States].”
• In the same vein, Michael Beckley has concluded that, “Beijing’s newfound assertiveness looks at first glance like the mark of growing power and ambition. But in fact it is nothing of the sort. China’s actions reflect profound unease among the country’s leaders, as they contend with their country’s first sustained economic slowdown in a generation and can discern no end in sight. China’s economic conditions have steadily worsened since the 2008 financial crisis. The country’s growth rate has fallen by half and is likely to plunge further in the years ahead, as debt, foreign protectionism, resource depletion, and rapid aging take their toll… When rising powers have suffered such slowdowns in the past, they became more repressive at home and more aggressive abroad. China seems to be headed down just such a path” (“The United States Should Fear a Faltering China”. See also, “China’s Coming Upheaval Competition, the Coronavirus, and the Weakness of Xi Jinping”, by Minxin Pei).
• In his book, “The Kill Chain”, Christian Brose (the late US Senator John McCain’s national security adviser) describes in great detail how China has focused on developing and deploying military systems designed to given it an asymmetric advantage over the United States, in order to win a war in the Western Pacific.
• The Trump administration has weakened many of the United States’ alliance relationships.
• Domestically, the US appears to be wrought by strongly held partisan divisions that could weaken public support for any reaction to a Chinese invasion of Taiwan, if care was taken to minimize US casualties.
• The US may be embroiled in a prolonged constitutional crisis following the November election.
• The US business community is likely to argue against a strong military response to the invasion of Taiwan (e.g., see, “America’s China Class Launches a New War Against Trump”, by Lee Smith, and “US companies defy Trump’s threats about ‘decoupling’ from China”, Financial Times 9Sep20).
• Xi might also conclude that the United States decision to cut off Chinese technology firms’ access to advanced technology from the United States will be so harmful to its economy as to justify an attempt to seize Taiwan Semiconductor’s chip fabrication plants, which are among the world’s most advanced and largest volume suppliers (e.g., see, “The Geopolitics of Semiconductors” by the Eurasia Group, “US-China Fight Spreads to the Chip Factory”, by Ina Fried, “The Chip Wars of the 21st Century” by Steve Blank, “AI Chips: What They Are and Why They Matter” by Khan and Mann”, and “Could Donald Trump’s War Against Huawei Trigger a Real War With China?” by Graham Allison).
What arguments might other advisors make to Xi Jinping to convince him NOT to launch an invasion of Taiwan?
• China recently publicized the results of a wargame that showed it could successfully conquer Taiwan. However a 24Sep20 article in India Defence News raised some practical objections to this conclusion. To begin with, there is “the well-known phrase that no battle plan survives first contact with the enemy.” Second, the assumption that an attacking Chinese force would quickly ’suppress’ any US intervention is, at the very least, optimistic if not absurd, based upon any kind of objective analysis…Also, the assumption that attacking Chinese forces could destroy Taiwan’s air defences in a few hours seems highly suspect.”
• If seizing Taiwan’s semiconductor chip fabrication plants intact is a critical objective of any invasion, there is no guarantee that they will not be destroyed.
• Many other analyses have noted that China does not have significant experience of actual combat, much less combat against a peer competitor (e.g., “People Win Wars: The PLA Enlisted Force and Other Related Matters”, by Clay and Blasko). Reports indicate that in China’s recent attack on Indian troops in the Himalayas, it incurred a significant (and thus far undisclosed) number of casualties (see, “China Is Paying A High Price For Provoking India”, by Brahma Chellaney from ASPI). There are also continuing concerns about the impact of corruption in the PLA on its warfighting effectiveness and political reliability (e.g., “The Consolidation of Political Power in China Under Xi Jinping: Implications for the PLA and Domestic Security Forces”, by Timothy Heath from RAND).
• A further uncertainty is potential domestic political reaction to a large number of Chinese casualties, almost all of who will be, due to the one child policy, their families’ only child. As RAND’s Andrew Scobell notes in “Something Old, Something New: Continuity and Change in China’s Foreign Policy”, “Chinese leaders are preoccupied with maintaining domestic stability and tend to be ultrasensitive to the prospect of chaos.” See also, “If China Loses a Future War, Entropy Could be Imminent”, by Jan Kallberg.
• Following China’s recent attack on Indian troops in their disputed border region, Russia suspended deliveries of its most advanced S-400 air defense missile system (since Russia has historically had close relations with India, while China has allied with Pakistan). This is critical because S-400 batteries located near Taiwan that can cover all of the latter’s airspace are likely critical to any Chinese invasion plans e.g., “How China’s New Russian Air Defense System Could Change Asia”, by Timothy Heath). S-400 deliveries to China only began in 2018, and it is unclear how many have been delivered and whether operational training by Russian advisers have been completed.
• Chinese war plans almost certainly include the aggressive use of cyber weapons to limit the United States’ ability to respond. As Burke et al describe in “China’s Strategic Culture”, its military doctrine “recognizes the centrality of information both as a domain in which war occurs and as the central means to wage military conflict when the dominant mode of warfare is confrontation between ‘information-based systems-of-systems’”. Similarly, in “How to Prevent a War in Asia”, Michele Flournoy (who is touted as the next US Secretary of Defense if Biden wins the November election) notes that China “relies on “system destruction warfare”—crippling an adversary at the outset of conflict, by deploying sophisticated electronic warfare, counterspace, and cyber-capabilities to disrupt what are known as C4ISR networks (command, control, communications, computers, intelligence, surveillance, and reconnaissance), and thereby thwarting its power projection and undermining its resolve.”
• Aggressive use of cyber weapons and attacks will very likely occur under both a war plan that seeks rapid victory and presents the US with a fait accompli, or one that is based on an all out attack on US assets in the Western Pacific and perhaps the homeland too. In both cases, cyber attacks would almost certainly be used in an attempt to blind US military information systems (probably accompanied by attacks on space based surveillance and communications assets), and very likely to shut down critical infrastructure (e.g., power) around military bases in the United States.
• However, many recent analyses have highlighted that cyber attacks by China would almost certainly lead to rapid escalation of a conflict with highly unpredictable consequences (e.g., “The Escalation Inversion and Other Oddities of Situational Cyber Stability”, by Jason Healey, Robert Jervis, “Wormhole Escalation in the New Nuclear Age”, by Rebecca Hersman, “Deterrence in the Age of Thinking Machines”, by Wong et al from RAND, “Preparing the Cyber Battlefield: Assessing a Novel Escalation Risk in a Sino-American Crisis”, by Buchanan and Cunningham, and “Would China Go Nuclear?” by Catlin Talmadge).
• An even more aggressive Chinese attack plan (which would likely trigger nuclear retaliation) would be the detonation of an electromagnetic pulse weapon (a high altitude nuclear blast) over the United States in an attempt to shatter the economy in one blow by knocking out electric grids, gas and water pipelines, and unshielded electronic equipment (e.g., your computer, your television, your phone, and all the electronics in the nation’s hospitals) . In “CHINA: EMP THREAT: The People’s Republic of China Military Doctrine, Plans, and Capabilities for Electromagnetic Pulse (EMP) Attack”, Dr. Peter Vincent Pry, the Executive Director of the EMP Task Force on National and Homeland Security notes that, “China's military doctrine regards nuclear HEMP (High Altitude Electro Magnetic Pulse) attack as an extension of information or cyber warfare, and deserving highest priority as the most likely kind of future warfare. Chinese military writings are replete with references to making HEMP attacks against the United States as a means of prevailing in war.”
• A successful conquest of Taiwan and victory over the US in a Western Pacific War would almost certainly strengthen the emerging global alliance to contain China. Absent an overwhelming victor over the US, China would be unlikely to receive much help from allies of its own (see the recent RAND analysis by Derek Grossman, “China’s Friends are Few and Unreliable”). Finally, a Chinese victory could lead to an embargo of maritime imports of energy and food on which it depends (implemented by blocking the Straits of Malacca and other maritime choke points). Overcoming these threats would require an overwhelming defeat of the United States, which would very likely breach the nuclear threshold.
Recent Indicators
There is no shortage of recent headlines indicating a sharp increase in the China-US conflict over Taiwan. Here are just a few:
• “China Set Its Sights on Taiwan After Hong Kong Crackdown” – Bloomberg
• “China Launches Combat Drills In Taiwan Strait, Warnings US Not To Play With Fire” – Washington Post
• “China Ramps Up A War Of Words, Warning The US Of Its Red Lines” – New York Times
• “US Warns China Against Taiwan Attack, Stresses US Ambiguity” – Reuters
• “China’s Sabre-Rattling Over Taiwan Rises As US Tensions Grow” – Financial Times
• “China Air Force Video Appears To Show Simulated Attack On U.S. Air Base On Guam” -- Reuters
• “China Warns U.S. It May Detain Americans - Blunt Message Suggests U.S. Nationals In China At Risk Of Becoming Hostages” -- Wall Street Journal
• “Chinese Military Beefs Up Coastal Forces As It Prepares For Possible Invasion Of Taiwan” – South China Morning Post
The Potential Consequences of a US-China War
What would happen if China invades Taiwan and the United States intervenes?
The US public is largely unaware that multiple analyses predict that if it was fought today, the US would very likely lose the initial phase of a war with China in the Western Pacific. These analyses include:
• “The Scary Wargame Over Taiwan that the US Loses Again and Again”, by Richard Bernstein
• “How the U.S. Could Lose a War With China”, by Kathy Gilsinan
• “Could A Chinese Surprise Attack Beat The US Military?” by David Axe
• “How Does The Next Great Power Conflict Play Out? Lessons From A Wargame”, by James Lacey
• “What War With China Could Look Like”, by Todd South
• “We Asked an Expert to Imagine a U.S.-China War. We Wish We Hadn't”, by Robert Farley
• “How the United States Could Lose a Great-Power War”, by Colby and Ochmanek
• “A History of the 2025 Sino–American War in the South China Sea”, by Michael Auslin
• “The War that Never Was” (parts 1 and 2)”, by Winnefeld and Morell
• “In Future Wars, the U.S. Military Will Have Nowhere to Hide”, by Michael Beckley
In “War With China: Thinking Through the Unthinkable”, Gompert et al from RAND take a longer term view, and describe four different paths a war between the US and China could take.
“Technological advances in the ability to target opposing forces are creating conditions of conventional counterforce, whereby each side has the means to strike and degrade the other’s forces and, therefore, an incentive to do so promptly, if not first. This implies fierce early exchanges, with steep military losses on both sides, until one gains control…
“Unless both US and Chinese political leaders decline to carry out counterforce strategies, the ability of either state to control the ensuing conflict would be greatly impaired…
“[A protracted] conflict could be decided by domestic political, international, and economic factors, all of which would favor the United States in a long, severe war. Because much of the Western Pacific would become a war zone, China’s trade with the region and the rest of the world would decline substantially. China’s loss of seaborne energy supplies would be especially damaging. A long conflict would also expose China to internal political divisions”…
“The path of war might be defined mainly by two variables: intensity (from mild to severe) and duration (from a few days to a year or more). Thus, we analyze four cases: brief and severe, long and severe, brief and mild, and long and mild. The main determinant of intensity is whether, at the outset, U.S. and Chinese political leaders grant or deny their respective militaries permission to execute their plans to attack opposing forces unhesitatingly. The main determinant of duration, given that both powers have the material wherewithal to fight a long war, is whether and when at least one side loses the will to fight or calculates that continuing to do so would be counterproductive” …
Brief and Severe: “If either U.S. or Chinese political leaders authorize their military commanders to carry out plans for sharp strikes on enemy forces, a severely violent war would erupt… It could be unclear then whether continued fighting would result in victory for either side. Economically, even a brief, severe war would produce a shock to Chinese global trade, most of which would have to transit the Western Pacific war zone, whereas U.S. economic damage would largely be confined to bilateral trade with China. International and domestic political responses would have little impact.
Long and Severe: “Inconclusive results in early fighting could motivate both sides to fight on despite heavy losses incurred and still expected… As the fighting persisted, much of the Western Pacific, from the Yellow Sea to the South China Sea, could become hazardous for commercial sea and air transport. Sharply reduced trade, including energy supplies, could harm China’s economy disproportionately and badly. The longer and harsher a conflict, the greater would be the likelihood of involving other states, especially U.S. allies in the region—most importantly, Japan”.
Brief and Mild: “Given the uncertain prospects of swift military victory, the risks of losing control, and the specter of major economic damage, both Chinese and U.S. leaders—for it would take both—might decline to authorize all-out strikes on the other side’s forces. What could follow is tightly restricted, low grade, sporadic, inconclusive fighting, with minimal military losses. Assuming that leaders of both states were inclined and had enough political latitude to compromise, such a conflict could be ended before it produced major economic damage or domestic and international political tremors… Once either military is authorized to commence strikes, the ability of both to control the conflict would be greatly compromised.”
“Each side could regard preemptive attack on the other’s forces as a way to gain a major early and sustainable edge in losses and thus in capabilities to prevail; this underscores the instability inherent in mutual, conventional counterforce capabilities and warfighting concepts”.
Long and Mild: “With fighting contained and losses tolerable, the sides could try to escape the political costs of compromise by continuing a low-grade conflict. Because neither would gain the upper hand militarily, this could go on for some time. In the meantime, even with fighting limited, economic losses would grow especially for China. With the passage of time, domestic and international political reactions would intensify, though less consequentially than in the long, severe case.”
“The prospect of a military standoff means that war could eventually be decided by nonmilitary factors. These should favor the United States. Although war would harm both economies, damage to China’s could be catastrophic and lasting: on the order of a 25–35 percent reduction in Chinese gross domestic product (GDP) in a year-long war, compared with a reduction in U.S. GDP on the order of 5–10 percent.
“Even a mild conflict, unless ended promptly, could weaken China’s economy. A long and severe war could ravage China’s economy, stall its hard-earned development, and cause widespread hardship and dislocation. Such economic damage could in turn aggravate [internal] political turmoil and embolden separatists in China. Although the regime and its security forces presumably could withstand such challenges, doing so might necessitate increased oppressiveness, tax the capacity, and undermine the legitimacy of the Chinese regime in the midst of a very difficult war.
“In contrast, U.S. domestic partisan skirmishing could handicap the war effort but not endanger societal stability, much less the survival of the state, no matter how long and harsh the conflict, so long as it remains conventional. Escalating cyber warfare, while injurious to both sides, could worsen China’s economic problems and impede the government’s ability to control a restive population.
“International responses could, on balance, also favor the United States in a long and severe war: The support of U.S. East Asian allies could hurt China’s military chances; responses of Russia, India, and NATO would have less impact; and NATO could neutralize Russian opportunistic threats in Europe. Japan’s entry would be likely if the nation were party to the underlying dispute and almost certain if
its territory (where U.S. bases are) were attacked”.
Conclusion
As Professor Philip Tetlock describes in his book “Superforecasting”, predictive accuracy is maximized when a forecaster starts with “base rate” or “reference” case outcomes, and then uses new evidence to constantly update their prior view.
In “By Fait Accompli, Not Coercion: How States Wrest Territory from Their Adversaries”, Dan Altman finds that, “from 1918 to 2015, 105 land grabs seized territory by fait accompli. In that same span, only 12 publicly-declared coercive threats elicited cessions of territory”. However, few of these land grabs involved islands, much less one as large as Taiwan.
Four examples of successful conquests of relatively large islands come to mind – the German airborne attack on Crete in May 1941, the Japanese attack on the Philippines in December 1941, the United States’ World War 2 “island hopping” campaign in the Pacific, and the Argentine seaborne attack on the Falklands in April 1982.
The battle of Crete was hard fought, and though the Germans eventually won (after nearly losing), the cost was high on both sides. In the Philippines, material shortages, a disorganized initial defense, and a significantly larger attacking force led to Japanese victory. Later in the war, American forces’ island invasions ultimately succeeded against Japanese defenders, but casualties were very heavy despite overwhelming US material superiority.
In the case of the Falklands, Argentine forces easily overwhelmed the small Royal Marin garrison. Substantially more casualties occurred when Britain retook the Falklands.
In so far these reference cases are applicable to the specific case of Taiwan, the key lessons appear to be that successfully seizing large islands, especially when defenders are well-prepared, almost always does not happen quickly, and almost always results in substantial casualties on both sides.
In sum:
• An attempt by China to conquer Taiwan through coercion alone is very unlikely to succeed.
• An attempt to conquer it via invasion is likely to trigger a protracted and bloody fight, particularly if the United States becomes involved.
• The United States is almost certain to become involved if China invades Taiwan, given the immense negative impact if it does not -- on its economy, on its standing in the world, and on the global balance of power. And any president who refused to involve the United States would immediately be accused of appeasement.
• If the United States becomes involved, escalation of the conflict is almost certain, due to the unpredictable interactions and feedback cycles triggered by cyber (and space) attacks.
• Escalation will almost certainly result in high casualties on both sides, which will shock large number of people in both China and the United States.
• As RAND’s analysis of potential US-China war scenarios concludes, those shocks are likely to be far more politically destabilizing in China than in the United States.
This brings us to the critical question with which we began: What is the probability that China will launch a Surprise Attack on Taiwan Before the 20th Congress of the CCP in 2022?
History is a function of three drivers: Situational and systemic factors, human agency, and randomness – i.e., luck, both good and bad.
Having analyzed situational and systemic factors, let’s now turn to human agency.
On the one hand, we have Xi Jinping’s statement at the 19th CCP Congress in 2017:
“The wheels of history roll on. The tides of the time are vast and mighty. History looks kindly on those with resolve, with drive and ambition, and with plenty of guts. It won’t wait for the hesitant, the apathetic, or those shy of a challenge.”
We also have Xi’s behavior. From his anti-corruption drive to building artificial islands in the South China Sea, to repression of the Uighurs, recent actions in Hong Kong, cyber attacks on other nations (e.g., Australia), and taking foreign hostages (e.g., Canadians and Australians), Xi has repeatedly demonstrated a willingness to act suddenly and aggressively to achieve his goals.
And we have H.R. McMaster’s warning (and others that are similar):
“The [CCP] party’s leaders believe they have a narrow window of strategic opportunity to strengthen their rule and revise the international order in their favor—before China’s economy sours, before the population grows old, before other countries realize that the party is pursuing national rejuvenation at their expense, and before unanticipated events such as the coronavirus pandemic expose the vulnerabilities the party created in the race to surpass the United States and realize the China dream”.
On the other hand, we have reviewed the likely outcome of a Chinese invasion of Taiwan, in both the short and longer terms. It clearly involves multiple critical uncertainties, the most likely resolution of which do not favor China, even if it initially defeats the United States in the Western Pacific. Over a longer period, any Chinese victory would likely prove to be pyrrhic, with its compounding negative effects resulting in the Chinese Communist Party’s loss of power, and very likely far worse personal consequences for its leaders.
The rational answer to our question is almost certainly not to invade Taiwan – or at least not yet, until if and when China’s relative military power versus the United States becomes stronger and potentially more decisive (e.g., able to successfully challenge any attempted blockade of energy and food supplies).
Unfortunately, time and again history has shown that leaders’ decisions have not always met the test of rationality.
Research has demonstrated that human beings are naturally overoptimistic and overconfident, and are more likely to take risk after they have experienced or anticipate losses (i.e., Prospect Theory), and/or when the outcome of a decision will be observed by others (i.e., Social Choice/Comparison Theory).
Another critical question is whether other top leaders of the CCP (e.g., the members of the Politburo Standing Committee), and other factions in the CCP (including those which have been targeted in Xi’s anti-corruption initiatives) would support a decision by Xi Jinping to pursue an attack against Taiwan. And even if they did, would they also agree to an aggressive initial attack against US military bases and assets?
There is evidence that Xi Jinping’s hold on power may be weaker than many outside of China perceive (e.g., “China’s Coming Upheaval”, by Minxin Pei, “Xi Jinping’s Leadership Of China Looks Secure – But His Enemies Are Circling”, by George Magnus, and “Xi Jinping: The Backlash” by Richard McGregor).
Taking all this evidence into consideration, in October 2020, I estimate that there is a 25% probability that China will attack Taiwan before the 20th CCP Congress, which is scheduled for November 2022.
In terms of our macro regime probabilities and their implications for portfolio asset allocation, an increasing likelihood of a Chinese attack on Taiwan will logically correlate with a rising probability for the High Uncertain Regime. If a Chinese attack on Taiwan actually takes place and leads to either of RAND’s “severe” war scenarios, disruption to global supply chains will be extensive, and the resulting supply shocks would likely lead to the High Inflation Regime until new capacity is built.
As always, please remember that predictive accuracy can be improved by combining this forecasts with others.
High Value Information Observed In September 2020
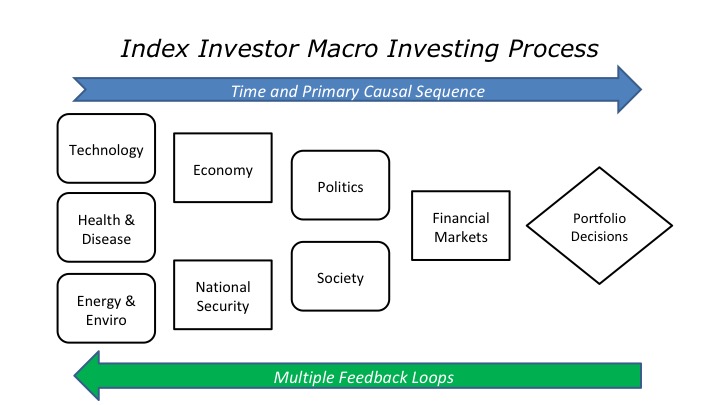
In our model of the complex global macro system, change drivers are arrayed across a roughly chronological process (albeit one with many feedback loops), in which technological and environmental changes precede changes in the economy and national security, which in turn lead to changes in society and politics, all of which produce the effects we observe in investor behavior and financial market valuations and returns.
In our methodology, we classify new information as significant and highly valuable if either it (1) is an “indicator”, which reduces our uncertainty about the value of a parameter in our mental model for making sense of the dynamic macro system, or (2) it is a “surprise” which increases our uncertainty about either the range of potential values for a parameter or the structure of our model. With respect to indicators, the higher our priori probability is for a regime, the more we look for indicators that it will not occur, and the lower our prior probability for a regime, the more we look for indicators that it will occur. Put differently, we tend to look for high value indicators that disconfirm our prior views.
| New Technology Information: Indicators and Surprises | Why Is This Information Valuable? |
| “Investigation of Competition in Digital Markets”, by the Subcommittee on Antitrust, of the US House of Representatives See also, “Concentrated Power of Big Tech Harms the US” by Rana Foroohar in the Financial Times | This long awaited report found multiple instances of large technology leaders exercising monopoly power. If Democrats end up controlling the White House and both the US House and Senate after the November election, this report will likely form the basis of much more aggressive government action against these companies. This will also likely lead to closer cooperation between the US and EU on the regulation of technology companies. From the Report: “On June 3, 2019, the House Judiciary Committee announced a bipartisan investigation into competition in digital markets,2 led by the Subcommittee on Antitrust, Commercial, and Administrative Law. "The purpose of the investigation was to (1) document competition problems in digital markets; (2) examine whether dominant firms are engaging in anticompetitive conduct; and (3) assess whether existing antitrust laws, competition policies, and current enforcement levels are adequate to address these issues” … “Over the past decade, the digital economy has become highly concentrated and prone to monopolization. Several markets investigated by the Subcommittee—such as social networking, general online search, and online advertising—are dominated by just one or two firms. The companies investigated by the Subcommittee—Amazon, Apple, Facebook, and Google—have captured control over key channels of distribution and have come to function as gatekeepers. "Just a decade into the future, 30% of the world’s gross economic output may lie with these firms, and just a handful of others. “In interviews with Subcommittee staff, numerous businesses described how dominant platforms exploit their gatekeeper power to dictate terms and extract concessions that no one would reasonably consent to in a competitive market” … “This significant and durable market power is due to several factors, including a high volume of acquisitions by the dominant platforms. Together, the firms investigated by the Subcommittee have acquired hundreds of companies just in the last ten years. In some cases, a dominant firm evidently acquired nascent or potential competitors to neutralize a competitive threat or to maintain and expand the firm’s dominance. "In other cases, a dominant firm acquired smaller companies to shut them down or discontinue underlying products entirely—transactions aptly described as “killer acquisitions.” “In the overwhelming number of cases, the antitrust agencies did not request additional information and documentary material under their pre-merger review authority in the Clayton Act, to examine whether the proposed acquisition may substantially lessen competition or tend to create a monopoly if allowed to proceed as proposed. For example, of Facebook’s nearly 100 acquisitions, the Federal Trade Commission engaged in an extensive investigation of just one acquisition: Facebook’s purchase of Instagram in 2012. “During the investigation, Subcommittee staff found evidence of monopolization and monopoly power.” As the Financial Times noted, “The best way to police [large tech companies] is to reinvent a US antitrust model still based on the concept of consumer harm, or whether prices are being driven up. The focus should be broadened to the impact of corporate power on market structure, competition, innovation, and quality (“The Growing Momentum Towards Curbing Big Tech”). |
| Far less remarked upon than the antitrust report was a new proposal by the Trump administration to repeal Section 230 of the 1996 Communications Decency Act – and Joe Biden’s apparent agreement with it. | In the early days of the internet, there was increasing litigation against technology companies that allowed community content creation for the nature of the content on their websites. This prompted the Communications Decency Act, in which section 230 states that, unlike traditional media companies, “No provider or user of an interactive computer service shall be treated as the publisher or speaker of any information provided by another information content provider”. This effectively eliminated the threat of litigation against technology companies operating network platforms (e.g., Facebook, Twitter, etc.). We’ve come a long way since then, and today, faced with allegations of foreign interference in American elections and controversies over “fake news”, platform companies have begun to censor different types of content. Predictably, this has led to protests from across the political spectrum. While antitrust is one approach to reducing the power of technology companies, so too is elimination or reform of Section 230, which would almost certainly result in very substantial changes to social and political dynamics in many countries. |
| “From AI To Facial Recognition: How China Is Setting The Rules in New Tech”, by James Kynge and Nian Liu in the Financial Times | The authors note that, “the intensifying geopolitical battleground of technological standards, a much overlooked yet crucial aspect of a new struggle for global influence between China and the US. “Such standards might seem obscure, but they are a crucial element of modern technology. If the cold war was dominated by a race to build the most nuclear weapons, the contest between the US and China — as well as the EU — will partly be played out through a struggle to control the bureaucratic rule-setting that lies behind the most important industries of the age”… “Standard-setting has for decades largely been the preserve of a small group of industrialised democracies…But China now has other ideas”… “An intensifying US-China battle to dominate standards, especially in emerging technologies, could start to divide the world into different industrial blocs… Strategic competition between the US and China raises the spectre of a fragmentation of standards that creates a new technological divide.” |
| “The Security of 5G”, by the Defence Committee of the UK House of Commons. | “Our inquiry into the security of 5G was launched in the context of a lively debate on the security of the UK’s 5G network in Parliament and across the country from late 2019 and through 2020 with a focus on the presence in our network of high-risk vendors, particularly Huawei… “The presence of Huawei equipment in our network increased the risk posed by cyber attacks and there is no doubt that Huawei’s designation as a high-risk vendor was justified. The Huawei Cyber Security Evaluation Centre consistently reported on its low-quality products and concerning approach to software development, which has resulted in increased risk to UK operators and networks. The presence of Huawei in the UK’s 5G networks posed a significant security risk to individuals and to our Government” … “A further geopolitical consideration our inquiry highlighted was Huawei’s relationship with the Chinese state. It is clearly strongly linked to the Chinese state and the Chinese Communist Party, despite its statements to the contrary, as evidenced by its ownership model and the subsidies it has received. Additionally, Huawei’s apparent willingness to support China’s intelligence agencies and China’s 2017 National Intelligence Law are further cause for concern. "Having a company so closely tied to a state and political organisation sometimes at odds with UK interests should be a point of concern and the decision to remove Huawei from our networks is further supported by these links. Concern about Huawei is based on clear evidence of collusion between the company and the Chinese Communist Party apparatus” … “China dominates the telecommunications industry and it is evident that the UK has a lack of industrial capacity in this sector. This is not unique to the UK and in order to combat China’s dominance, we support the principle of proposals for forming a D10 alliance of democracies to provide alternatives to Chinese technology.” |
| “Multi-agent Social Reinforcement Learning Improves Generalization”, by Ndouse et al. “Social learning is a key component of human and animal intelligence. By taking cues from the behavior of experts in their environment, social learners can acquire sophisticated behavior and rapidly adapt to new circumstances. “This paper investigates whether independent reinforcement learning (RL) agents in a multi-agent environment can use social learning to improve their performance using cues from other agents… "We are able to train agents to leverage cues from experts to solve hard exploration tasks. The generalized social learning policy learned by these agents allows them to not only outperform the experts with which they trained, but also achieve better zero-shot transfer performance than solo learners when deployed to novel environments with experts”. “Importance Weighted Policy Learning and Adaption”, by Galashov et al from Google. The ability to exploit prior experience to solve novel problems rapidly is a hallmark of biological learning systems and of great practical importance for artificial ones. In the meta reinforcement learning literature much recent work has focused on the problem of optimizing the learning process itself. In this paper we study a complementary approach [that] achieves competitive adaptation performance compared to meta reinforcement learning baselines and can scale to complex sparse-reward scenarios.” “A Survey of Deep Meta Learning”, by Huisman et al. “Deep neural networks can achieve great successes when presented with large data sets and sufficient computational resources. However, their ability to learn new concepts quickly is quite limited. Meta-learning is one approach to address this issue, by enabling the network to learn how to learn. The exciting field of Deep Meta-Learning advances at great speed, but lacks a unified, insightful overview of current techniques. This work presents just that.” | SURPRISE These new papers provide evidence of further progress in critical areas of machine learning and artificial intelligence. Today, artificial intelligence is almost always based on what Judea Pearl refers to a “associative” reasoning (e.g., complex statistical relationships and pattern matching). It has not yet been able to reach Pearl’s higher levels of causal and counterfactual reasoning (particularly involving complex adaptive systems and networks), which will require continued progress in many technologies (see Pearl’s “The Book of Why”). When and if artificial intelligence is able to incorporate causal and counterfactual reasoning, it will very likely result in an order of magnitude (or more) improvement in its performance and range of applications. For this reason, we continuously look for indicators of progress in this area. |
| “How to Talk When a Machine is Listening: Corporate Disclosure in the Age of AI”, by Cao et al “This paper analyzes how corporate disclosure has been reshaped by machine processors, employed by algorithmic traders, robot investment advisors, and quantitative analysts. Our findings indicate that increasing machine and AI readership, proxied by machine downloads, motivates firms to prepare filings that are friendlier to machine parsing and processing. “Moreover, firms with high expected machine downloads manage textual sentiment and audio emotion in ways catered to machine and AI readers, such as by differentially avoiding words that are perceived as negative by computational algorithms as compared to those by human readers, and by exhibiting speech emotion favored by machine learning software processors.” | This paper is an excellent example of a critical challenge faced by the deployment of artificial intelligence technologies in systems (and especially social systems) where agents can adapt to their presence and in so doing degrade their expected performance. Another example is algorithm versus algorithm trading in financial markets. See also this month’s National Security Evidence File, on how automated cycles of rapid adaptation can lead to uncontrolled escalation in the realm of cyberwar. |
| | |
| | |
| | |
| | |
| | |
| | |
| | |
| New Energy and Environment Information: Indicators and Surprises | Why Is This Information Valuable? |
| As both Biden and Trump fought to win the swing states of Pennsylvania and Ohio, fracking again became an issue in the US presidential campaign, with Trump claiming Biden will ban it, and the latter denying the charge. | All else being equal, a fracking ban would almost certainly lead to a substantial increase in energy prices, which would put upward pressure on overall inflation and thus could very likely weaken or reverse an incipient economic recovery from COVID. However all else is unlikely to remain equal – the upward price impact from any fracking restrictions and resulting cuts in oil and gas supplies could be offset by weakening economic demand, if COVID cases continue to rise and the US Congress fails to pass a second, and more effective, stimulus package. |
| Speaking to the UN General Assembly, Xi Jinping announced plans for China to become carbon neutral by 2060. | It is hard to reconcile this pledge (however much certain audiences cheered it) with the fact that China as nearly 150GW of new coal plants either planned or under construction. This is about equal to the total amount of the European Union’s coal-fired electricity generation capacity today. Through the Belt and Road Initiative (BRI), China is also financing the construction of new coal plants in other countries. |
| “Petra Nova Mothballing Post-Mortem: Closure of Texas Carbon Capture Plant Is a Warning Sign”, by the Institute for Energy Economics and Financial Analysis | SURPRISE The gap between China’s claims and reality was made starker by the announcement that a carbon capture plant in Texas will be mothballed. This is also yet another example of how when it comes to emissions reducing technologies, the hope and the hype they inspire too often outrun the much slower pace of the science and engineering progress that are needed to make them cost effective (speaks someone who has more than his fair share of scar tissue from experience in this area). “The 240-megawatt Petra Nova carbon capture and storage project at Unit 8 of NRG Energy’s W.A. Parish Generating Station near Houston is the only operational coal-fired power plant CCS facility in the U.S. As such, it is frequently cited by promoters of CCS retrofits at other coal-fired power projects as proof that the process works and that it is an economically viable option for cleaning up coal-fired generation. “But there have long been serious questions about the performance at Petra Nova. These questions have only been heightened by NRG’s official announcement in late July that it mothballed the carbon capture project in the spring due to falling oil prices. NRG’s plans for the project remain uncertain, with the company only saying it could be brought back online “when economics improve.” “The mothballing of Petra Nova highlights the deep financial risks facing other proposed U.S. coal-fired carbon capture projects, including Enchant Energy’s plan for the San Juan Generating Station in New Mexico and Minnkota Power Cooperative’s Tundra Project at the Milton R. Young Station in North Dakota. |
| | |
| | |
| | |
| | |
| | |
| | |
| | |
| | |
| | |
| | |
| New Economic Information: Indicators and Surprises | Why Is This Information Valuable? |
| In Europe and the United States, there has been an accelerating surge of new COVID infections. | This will almost certainly prolong and worsen the economic downturn, and very likely lead to more severe social and political consequences in the absence of better policy responses than seem likely today. |
| Various post-COVID bailout programs for private sector companies run the risk of increasing the number of “zombie” firms in the economy, with negative consequences for employment, investment, and productivity growth (as was seen for years after the beginning of Japan’s financial crisis in 1991). The risks posed by “zombie companies” have been increasingly recognized in the media (e.g., “What To Do About Zombie Firms”, The Economist; and “Pandemic Debt Binge Creates New Generation Of ‘Zombie’ Companies”, Financial Times) | Growth in the number of zombie companies is another channel of likely economic harm resulting from COVID-19 that will almost certainly prolong the downturn. In “Corporate Zombies: Anatomy and Lifecycle”, Banerjee and Hoffman from the Bank for International Settlements (BIS) “use data on listed non-financial companies in 14 advanced economies, to document a rise in the share of zombie firms, defined as unprofitable firms with low stock market valuation, from 4% in the late 1980s to 15% in 2017.” “These zombie firms are smaller, less productive, more leveraged and invest less in physical and intangible capital… The literature has so far focused largely on the causes and the consequences of the rise of these firms for other firms and for aggregate productivity. But little is known about the zombies themselves, except that they are commonly found to be less productive than their non-zombie peers.” The authors find that zombies’ “performance deteriorates several years before zombification and remains significantly poorer than that of non-zombie firms in subsequent years. Over time, some 25% of zombie companies exited the market, while 60% exited from zombie status”… However, “recovered zombie firms however remain weak and fragile. Their productivity, profitability, investment and employment growth remain well below those of non-zombies. Reflecting this weak performance, they face a high probability of relapsing into zombie state. By 2017, the probability of becoming a zombie firm in the subsequent year was, at 17%, three times higher for a recovered zombie compared to a firm that has never been a zombie firm. This relapse probability of recovered zombies has increased more than threefold over the past decade.” Writing in the Financial Times, Martin Sandbu concludes that, “a big recapitalisation plan is the only way to address the serious damage that has been done to companies” (“The Corporate Zombies Stalking Europe”). |
| “The Economic Impact of Learning Losses” by Hanushek and Woessman for the OECD See also, “Tapping into Talent: Coupling Education and Innovation Policies for Economic Growth” by Akcigit | Large and very likely unrecovered COVID-19 learning losses for elementary and secondary students is another channel through which the pandemic will negatively affect economic growth, and lead to negative social and political effects. “The worldwide school closures in early 2020 led to losses in learning that will not easily be made up for even if schools quickly return to their prior performance levels. These losses will have lasting economic impacts both on the affected students and on each nation unless they are effectively remediated. “While the precise learning losses are not yet known, existing research suggests that the students in grades 1-12 affected by the closures might expect some 3 percent lower income over their entire lifetimes. For nations, the lower long-term growth related to such losses might yield an average of 1.5 percent lower annual GDP for the remainder of the century.” "These economic losses would grow if schools are unable to re-start quickly. The economic losses will be more deeply felt by disadvantaged students. All indications are that students whose families are less able to support out-of-school learning will face larger learning losses than their more advantaged peers, which in turn will translate into deeper losses of lifetime earnings.” |
| “Demographic Origins of the Decline in Labor's Share” [of National Income in the United States], by Glover and Short. | SURPRISE In the absence of an effective policy response, this represents another channel through which demographic forces will likely slow economic growth and worsen inequality, thus very likely leading to more severe social and political consequences. “An aging workforce has contributed to the decline in labor's share. We formalize this hypothesis in an on-the-job search model, in which employers of older workers may have substantial monopsony power due to the decline in labor market dynamism that accompanies age. This manifests as a rising wedge between a worker's earnings and marginal product over the life-cycle…We find that a sixty-year-old worker receives half of her marginal product relative to when she was twenty, which, together with recent demographic trends, can account for 59% of the recent decline in the US labor share.” |
| Joshua Rauh, one of the leading public finance economists in the US, proposed that, “Municipal Bond Investors Have to Share the Burden in State Bailouts.” “When Greece had its government debt crisis a decade ago, it received several rounds for bailout funding from the European Commission, the European Central Bank, and the International Monetary Fund. Key to the negotiations were not only the extent to which Greece would reform its public finances, but also how much the existing owners of its debt would have to suffer losses before the country received the bailout funding. “The private investors in Greek bonds ultimately took haircuts that reduced the value of their positions by 59 percent in 2012. “Now in the United States, many are calling on the federal government to provide massive transfers for bailouts of state and local governments as they face their own debt crisis… Absent among these requests has been any mention of the existing bond holders, the creditors who voluntarily loaned nearly $4 trillion to state and local governments in the municipal bond market.” Other research has found that, because municipal bond income is exempt from federal taxes, 42% of municipal bonds (by value) are held by the top 0.5% of the income distribution.” | SURPRISE That Rauh’s proposal was published by The Hill (a widely read publication in Washington DC) marks a watershed in the development of the worsening state and local financial crisis in the United States. However the fact that Rauh failed to also ask for reductions in unfunded public sector pension plan liabilities (via cuts in retiree benefits) indicates the ugly nature of the conflict that lies ahead. In the Federal Reserve’s most recent release, these liabilities were estimated to be $4 trillion at the end of 2017. Since then, they have undoubtedly increased. There is no way that municipal bondholders and state and local taxpayers will accept a deal that provides more federal money and cuts muni bond payments in order to reduce unfunded public pension liabilities. |
| In the US, analyses have criticized the design and results of the first COVID fiscal stimulus package (e.g., “Doomed To Fail’: Why a $4 Trillion Bailout Couldn’t Revive The American Economy: An avalanche of U.S. grants and loans helped the wealthy and companies that laid off workers. Individuals received about one-fifth of the aid”, by Whoriskey et al in the Washington Post). Similar criticisms have already been made of the yet to be disbursed EU fiscal stimulus package. For example, in the Financial Times, Wolfgang Munchau writes that, “Last week, the European Commission produced an important document that set out guidelines to EU governments on how to spend the money and how to prevent it from ending up in a pork barrel. It is not a bad list, although I think the priorities are too diffuse. The bigger problem, though, is that member states will almost certainly not follow these guidelines… National political pressures will divert money from truly worthwhile projects” (“Beware Of Smoke And Mirrors In The EU’s Recovery Fund”). | Faced with an unprecedented collapse in global demand, governments have dithered in putting together and the implementing often poorly-designed fiscal stimulus packages. In the meantime, central banks have been left to do what they can to keep the economy (barely) afloat with the limited monetary tools they have available at the zero lower interest rate bound. Unfortunately, while central banks can effectively resolve liquidity issues, resolving solvency issues requires effective fiscal and structural policy. In their absence, insolvencies will rise, forcing many more people out of work. In the US, much of this increase in unemployment, at least at first, will likely fall on people in the lower three quintiles of household income, which account for almost 40% of consumption expenditure (the top four quintiles account for 61%), in an economy where private consumption accounts for almost 70% of GDP. People in the highest quintile cannot remain unscathed for much longer if the collapse of employment (in the US, U6 – the broadest measure of unemployment – was at nearly 13% at the end of September) and consumption beneath them continues for much longer (e.g., “Harvard’s Chetty Finds Economic Carnage in Wealthiest ZIP Codes” on Bloomberg). Unfortunately, discussion of serious structural policy actions – the need for which was abundantly clear as the economy weakened in 2019 before COVID arrived – is thus far wholly absent. The last thing the world needs right now is more wasted fiscal stimulus. But that increasingly looks like what we’re going to get, if (in the US at least), a polarized Congress ever reaches agreement on the shape of the next stimulus package. The resulting sputtering, staggering, and weak economic recovery (driven by rising insolvencies) will almost certainly increase social and political conflict. It is therefore no surprise that, as Pew Research found, “Views of The Economy Have Turned Sharply Negative In Many Countries Amid COVID-19”. |
| | |
| | |
| | |
| | |
| | |
| | |
| | |
| | |
| | |
| | |
| | |
| | |
| | |
| New National Security Information: Indicators and Surprises | Why Is This Information Valuable? |
| “The Escalation Inversion and Other Oddities of Situational Cyber Stability”, by Jason Healey, Robert Jervis | SURPRISE This excellent analysis shows that we have likely underestimated the potential for the use of cyber weapons to lead to rapid escalation in any great power conflict. “Are cyber capabilities escalatory? The pessimists, in whose camp we normally reside, observe a two-decade trend of increasing cyber aggression acting like a ratchet, not a pendulum…The optimists have equally compelling arguments — including the contention that so far, none of these admittedly worrying cyber attacks has ever warranted an armed attack with kinetic weapons in response… “This paper examines this debate. Much of the dispute about the escalatory potential of cyber capabilities comes down to scope conditions. The question is not “whether” cyber capabilities are stabilizing or destabilizing. Rather, the issue is which outcome is more likely under certain geopolitical circumstances… “During periods of relative peace and stability — that is, since the end of the Cold War in 1991 — several characteristics drive cyber capabilities to act as a pressure-release valve. Cyber capabilities open up stabilizing, non-lethal options for decision-makers, which are less threatening than traditional weapons with kinetic effects. “During periods of acute crisis, however, cyber capabilities have other destabilizing characteristics. In these situations, there are greater opportunities for provocation, misperception, mistake, and miscalculation. Dangerous positive feedback loops can amplify cyber conflict so that it takes on a life of its own with diminishing room for strategic choices by policymakers.” |
| A new analysis from Gallup finds that the world has grown much less accepting of migrants. Willingness to accept immigrants dropped in South American countries that “have experienced large inflows of Venezuelans fleeing the humanitarian crisis in their country”. There were also substantial drops in “countries where migration continues to be a polarizing subject, including European countries such as Belgium and Switzerland, where right-wing, anti-immigration parties continued to gain ground between 2016 and 2019” … “The countries that were the least accepting of migrants in 2019 include several EU member states, such as Hungary, Croatia, Latvia and Slovakia.” Canada was the nation most accepting of migrants. | This if further evidence of the potential for significant future conflict, particularly in Europe, if climate change, COVID, war, and/or state failure substantially increase migrant flows out of the Middle East and North Africa. |
| “It Will Take More Than A Biden Victory To Solve NATO’s Strategic Malaise” by Sara Moller. “For an alliance that has long prided itself on its commonality of purpose and interests, the truth is that NATO is in danger of losing both… "If and when the Biden team embarks on its grand European tour, it seems virtually certain that, beyond the expressions of gratitude for America’s “return” that will surely follow them wherever they go, the delegation can expect to be met with a lengthy list of items requiring their immediate attention. “Moreover, appeals for Washington’s assistance are likely to differ from capital to capital, with each NATO ally arguing that their particular issue or concern represents the most pressing challenge and therefore requires the most attention and resources. "In Warsaw and the capitals of the Baltic states, the US delegation will hear that, despite a new U.S. rotational troop deployments, a revanchist Russia necessitates additional NATO (but especially U.S.) military commitments along the Eastern flank of the alliance. “In Rome, Athens, and Madrid, U.S. policymakers will learn that the Mediterranean countries represent the ‘soft underbelly’ of NATO and that the alliance must do more to project stability along its southern arc of instability. “In Ankara, the message will be one of anger directed at what the Erdogan government perceives as NATO’s collective failure to support Turkish actions in Syria and elsewhere. In Paris, the message for the U.S. delegation will be that the alliance must strengthen its counter-terrorism efforts in the Middle East and North Africa, while in Berlin the focus will be on reforming NATO’s nuclear posture and salvaging expiring arms-control agreements. “Meanwhile, securing the Arctic and halting the effects of climate change will be at the top of the agenda in Copenhagen and Oslo. “In short, wherever the Biden presidential delegation goes, it will be met with requests that Washington —and with it, the NATO alliance — prioritize everything, thereby fulfilling the old adage that, “When everything is a priority, nothing is a priority.” | If Biden wins the presidency, his team will very quickly have to manage both rising tensions with China and many unresolved issues in relations with Europe, at a time when the US economy, society, and political system will almost certainly all be under great stress. |
| A number of new stories and analyses highlighted a range of new developments in China. “Pollution Exacerbates China’s Water Scarcity and Its Regional Inequality”, by Ma et al: “inadequate water quality exacerbates China’s water scarcity, which is unevenly distributed across the country. North China often suffers water scarcity throughout the year, whereas South China, despite sufficient quantities, experiences seasonal water scarcity due to inadequate quality. “Over half of the population are affected by water scarcity, pointing to an urgent need for improving freshwater quantity and quality management to cope with water scarcity.” The Australian Strategic Policy Institute reported that, “Credible data on the extent of Xinjiang’s post-2017 detention system is scarce. But researchers at ASPI’s International Cyber Policy Centre have now located, mapped and analysed 380 suspected detention facilities in Xinjiang, making it the most comprehensive data on Xinjiang’s detention system in the world. “This new database highlights ‘re-education’ camps, detention centres, and prisons which have been newly built or expanded since 2017, and we believe it covers most such detention facilities. “The findings of this research contradicts Chinese officials’ claims that all “re-education camp” detainees had ‘graduated’ in December 2019. It presents satellite imagery evidence that shows newly constructed detention facilities, along with growth in several existing facilities that has occurred across 2019 and 2020. “The second key piece of research on our new website is a project investigating the rate of cultural destruction in Xinjiang. This research estimates that 35% of mosques have been demolished; and a further 30% have been damaged in some way, usually by the removal of Islamic or Arabic architectural features such as domes, minarets or gatehouses. We estimate approximately 16,000 mosques have been damaged or totally destroyed throughout Xinjiang (65% of the total). The majority of demolished sites remain as empty lots.” The Financial Times reported that "Senior Chinese Communist party officials have been sending an ominous message to private sector entrepreneurs in recent weeks. “In a series of policy announcements and meetings, they have emphasised that private companies have an important role to play in “United Front work” — a euphemism for efforts aimed at ensuring that non-party organisations and entities support the party’s top policy objectives as well as its iron grip on power… “China’s private sector still accounts for 50 per cent of government tax revenues, 60 percent of economic output and employs 80 per cent of all urban workers. This is despite years of systemic discrimination, such as limited access to bank loans compared with their state-owned peers. “Under the new guidelines, party committees that previously wielded little power at private companies are supposed to play a role in personnel appointments and other important decisions” (“Chinese Communist Party Asserts Greater Control Over Private Enterprise”). | Xi Jinping faces a growing number of short and long-term domestic challenges. The CCP’s response has been further increases in repression and attempts to exert more state and party control. It is often said that authoritarian regimes are more brittle than many outside observers realize, and thus their collapse can occur much more quickly than one would expect. With respect to China, a critical uncertainty is the balance between the rate at which domestic problems and pressures are accumulating, and the rate at which the CCPs ability to control these pressures (e.g., through surveillance and social control technologies and direct repression) is improving. |
| | |
| | |
| | |
| | |
| | |
| | |
| | |
| | |
| | |
| | |
| New Health and Disease Information: Indicators and Surprises | Why Is This Information Valuable? |
| The percent of Americans who said they would definitely or probably get the COVID vaccine if it was available today dropped from 72% in May to 51% in September, according to Pew Research. The percent that said they would definitely not get the vaccine rose from 11% to 24% over the same period. Pew also found that, “Concern over side effects, uncertainty about effectiveness top reasons for those not planning to get a COVID-19 vaccine.” | SURPRISE Gaining permanent control of the COVID pandemic is broadly a function of three variables: (1) the efficacy of a vaccine (including how it changes over time as the SARS-CoV-2 virus evolves; (2) the percentage of the population that is willing to take the vaccine; and (3) the natural development of herd immunity, as people become infected and survive. This reduction in willingness to take the vaccine implies that the US will be struggling to gain control of the pandemic for longer than many people |
| “Covid-19: Do many people have pre-existing immunity? Population Immunity: Underestimated?” by Peter Doshi in the British Medical Journal 17Sep20 “Seroprevalence surveys measuring antibodies have been the preferred method for gauging the proportion of people in a given population who have been infected by SARS-CoV-2 (and have some degree of immunity to it), with estimates of herd immunity thresholds providing a sense of where we are in this pandemic. “Whether we overcome it through naturally derived immunity or vaccination, the sense is that it won’t be over until we reach a level of herd immunity. “The fact that only a minority of people, even in the hardest hit areas, display antibodies against SARS-CoV-2 has led most planners to assume the pandemic is far from over… “But memory T cells are known for their ability to affect the clinical severity and susceptibility to future infection and the T cell studies documenting pre-existing reactivity to SARS-CoV-2 in 20-50% of people suggest that antibodies are not the full story… “The research offers a powerful reminder that very little in immunology is cut and dried. Physiological responses may have fewer sharp distinctions than in the popular imagination: exposure does not necessarily lead to infection, infection does not necessarily lead to disease, and disease does not necessarily produce detectable antibodies. “And within the body, the roles of various immune system components are complex and interconnected. B cells produce antibodies, but B cells are regulated by T cells, and while T cells and antibodies both respond to viruses in the body, T cells do so on infected cells, whereas antibodies help prevent cells from being infected.” | The rate at which herd immunity is naturally developing is another critical uncertainty. Seroprevalence studies, which only measure the presence of antibodies, have almost certainly underestimated the percentage of the population that has already developed some degree of immunity. |
| The US Centers for Disease Control released updated estimates of the COVID-Infection Fatality Rate (IFR). This is the ration of COVID-19 related deaths to the estimated total number of people, both symptomatic and non-symptomatic, that have become infected (it is lower than the Case Fatality Rate, which uses only people who have tested positive for COVID-19 in the denominator). The latest overall IFR estimate is 0.65% (65/100s of 1%). In a separate analysis (“A Systematic Review And Meta-Analysis Of Published Research Data On COVID-19 Infection-Fatality Rates”), Myerowitz-Katz and Merone estimate an IFR of 0.68%, with a 95% confidence interval of 0.53% to 0.82%. By comparison, estimated IFRs for seasonal influenza range from 0.10% to 0.18%. The estimated IFR from the 1957 H2N2 influenza pandemic is 0.67% and the 1918 pandemic greater that 2.5%. However, these estimates are noisy, because of considerably uncertainty about the percent of influenza infections that were non-symptomatic. This is also a challenge for studies that estimate COVID’s IFR. Determining the number of people who have been infected is not easy, because not all who become infected develop antibodies that can be identified through serology testing. However, some infected people who don’t have antibodies develop a strong T-Cell immune response that requires a separate test to identify. Given the relatively limited scope of T-Cell testing thus far, we may still be overestimating COVID-19’s true IFR. | To a significant degree, the politicization of COVID-19 reflects an anxious public’s demand for reassurance when it comes to multiple uncertainties about the disease process itself, the percent of the population that has already been infected, the extent of immunity that confers (due to antibody and T-Cell responses), and, above all, SARS-CoV-2’s Infection Fatality Rate (IFR). As more evidence has accumulated, estimates of COVID’s IFR have fallen. However thus far it is still above estimates of the IFRs for all but the 1918 influenza pandemic (after taking the likely percentage of non-symptomatic influenza cases into account). So saying “COVID-19 is just like flu” is almost certainly incorrect. Yet that is a message that hasn’t been clearly communicated, which has allowed this issue to become highly polarized, and thus led to widely varying social responses (distancing, mask wearing, etc.) that are almost certainly prolonging the pandemic and worsening its economic consequences. |
| On 29 September, the Royal Society (the UK equivalent of the US National Academy of Sciences) released the most comprehensive analysis yet of indoor air quality issues related to the aerosol transmission of SARS-CoV-2, and, critically, how building HVAC systems can manage them (“The Ventilation Of Buildings And Other Mitigating Measures For COVID-19: A Focus On Winter 2020”). | SURPRISE Aerosol transmission of SARS-CoV-2 and indoor air quality and HVAC issues have thus far in the COVID-19 crisis been relatively ignored. With the northern hemisphere heading into winter, these issues can no longer be ignored. This outstanding analysis shows how they can be managed (e.g., room CO2 monitors are good proxies for viral aerosol concentrations) – if building owners, school systems, and other parties take the issue seriously (and can afford the expense involved in upgrading HVAC systems and related management skills). The flip side of this is that publication of this information also creates new causes for litigation if building owners fail to follow the Royal Society’s recommendations and someone falls ill. It is therefore almost certain that this will lead to further conflicts this winter between insurance carriers and building owners, which could slow the economic recovery from the COVID-19 shock. |
| Professor Limeng Yan of the University of Hong Kong published two papers setting out why she believes that SARS-CoV-2 was deliberately engineered by the Chinese government: “Unusual Features of the SARS-CoV-2 Genome Suggesting Sophisticated Laboratory Modification Rather Than Natural Evolution and Delineation of Its Probable Synthetic Route” and “SARS-CoV-2 Is an Unrestricted Bioweapon: A Truth Revealed through Uncovering a Large-Scale, Organized Scientific Fraud.” These reports attracted from support from apparently knowledgeable people, including Lawrence Sellin, PhD, a retired US Army Colonel who worked at the US Army Medical Research Institute for Infectious Diseases, and later in clinical research in the pharmaceutical industry. He notes that, “Since the beginning of the COVID-19 pandemic, the Chinese Communist Party supported by some Western scientists and a politically-motivated media have desperately tried to convince the world that the COVID-19 virus originated as a bat beta-coronavirus which underwent a natural mutation process and was then acquired by humans after exposure to infected animals. "Undoubtedly, such subterfuge is meant to protect certain vested interests, including the potentially devastating political and economic consequences for China, global corporate and private investment in China and a negative effect on scientific collaboration and funding of major Western research laboratories… “On February 3, 2020, ‘batwoman’ Dr. Zheng-Li Shi of the Wuhan Institute of Virology published an article suggesting that COVID-19 originated in bats and a bat coronavirus named RaTG13 was shown to be 96.2% identical to the COVID-19 virus, thus supporting the naturally-occurring theory. “Since then, literally hundreds of scientific articles have used RaTG13 as a basis for investigating the natural origin of the COVID-19 pandemic, despite the fact that RaTG13 exists only on paper because no live virus or intact genome of RaTG13 have ever been isolated or recovered. Dr. Yan and her colleagues now make multiple arguments indicating that RaTG13 is a fabricated virus.” Publication of the Yan reports also triggered critical responses. One of the most detailed (and condescending) is “In Response: Yan et Al Preprint Examinations of the Origin of SARS-CoV-2” by the Johns Hopkins University School of Public Health. | SURPRISE Yan’s reports are not the first to claim that, either because of a lab accident that released a virus involved in “gain of function” studies, or because of the accidental release of a bioweapon under development, SARS-CoV-2 and the COVID-19 pandemic were not accidents of nature. These claims have met with widespread resistance, by a range of authors who have studiously ignored asking why China continues to prevent international investigation of virology labs in Wuhan and the source of the virus. Nor have they asked what is perhaps the most frightening question: If this virus was deliberately engineered (and either accidentally or deliberately released), “Cui Bono?” Given the possible answers, and their potentially world changing implications, it is not hard to understand why so many choose to attack those who dare to challenge the conventional wisdom about the origins of the virus. |
| | |
| | |
| | |
| | |
| | |
| | |
| New Social Information: Indicators and Surprises | Why Is This Information Valuable? |
| “Socially Distant How Our Divided Social Networks Explain Our Politics” by Cox et al from AEI “Americans have a more positive view of the Democratic Party than the Republican Party, but only marginally so. “Thirty-seven percent of Americans have a favorable view of the Republican Party, while close to half (45 percent) of the public expresses a positive opinion of the Democratic Party. “A majority of Americans have a negative view of both the Republican Party (63 percent) and the Democratic Party (54 percent). “Partisans generally express greater animosity toward the opposing party than affection for their own. More than three-quarters (78 percent) of Democrats have a favorable view of the Democratic Party, but only 23 percent express a very favorable opinion. Eighty-nine percent of Democrats view the GOP negatively, including 55 percent who have a very negative view. “Seventy-seven percent of Republicans have positive impression of their party; however about only one-quarter (24 percent) say their view is very positive. More than nine in 10 (92 percent) Republicans view the Democratic Party unfavorably, while nearly two-thirds (64 percent) say they have a very unfavorable opinion. “The immediate political social context appears to and influence how Democrats respond to the opposition. “Democrats and Republicans who have more politically diverse social circles feel less hostility toward the opposing political party… “Most partisans have close social ties that reflect their political predispositions. A majority (54 percent) of Republicans report that their core social network is exclusively composed of Donald Trump supporters. The pattern is identical among Democrats.” | SURPRISE This paper describes some very important trends, and indirectly reflects others we have noted in our Evidence Files. Back in 1988, Michael Weiss published “The Clustering of America”, which explored the extent to which American communities (defined by Zip Codes) were becoming more homogenous. Twenty years later, Bill Bishop published his book, “The Big Sort”, which showed how acceleration of the trends identified by Weiss had led to an increasingly divided and polarized not-so-United States. In 2012, Charles Murray published “Coming Apart”, and in 2015 Robert Putnam published “Our Kids” – books that focused on the destructive consequences of the increasing differences and mutual incomprehension (and increasing contempt) between the two Americas. In 2016, the result was Donald Trump. In parallel with this sorting trend there has been an accelerating decline in religious belief and participation (e.g., see “Giving Up on God” by Ronald Inglehart). Whether it is a cause, effect, or coincidence with the decline of strongly felt religious identify, at the same time, multiple researchers have found that political parties have become “meta-identities” which can now be used to reliability predict members views on a much wider range of issues than before (e.g., “Identity as the Dependent Variable: How Americans Shift Their Identities to Align With Their Politics”, by Patrick Egan; “From Politics to the Pews: How Partisanship and the Political Environment Shape Religious Identity” by Michele Margolis, and “The Tie That Divides: Cross-National Evidence of the Primacy of Partyism”, by Westwood et al). Most disturbing of all, perhaps, is evidence that the decline of religion and rise of political party as a meta-identity has led to party members having very different perceptions of the morality of the other party’s members (e.g., “Seeing Beyond Political Affiliations: The Mediating Role Of Perceived Moral Foundations On The Partisan Similarity-Liking Effect”, by Bruchmann et al). This is dangerous, because perceived moral differences make compromise extremely difficult. One of the effects of these interacting trends is what Cox et al found: Feelings of dislike (and, in their stronger forms, disrespect, animosity, and contempt) for members of the other party are much stronger than positive feelings towards one’s own. In sum, it is clear that American politics has become tribal, which bodes ill for any leader’s ability to reverse the trend towards greater social and political conflict (at least in the absence of an existential external threat to the nation). |
| “Golfing with Trump: Social Capital, Decline, Inequality, and Populism in the US” by Rodriguez-Pose et al. “This paper analyses the extent to which the election of Donald Trump was related to levels of social capital and interpersonal inequalities and posits a third alternative: that the rise in vote for Trump in 2016 was the result of long-term economic and population decline in areas with strong social capital. “This hypothesis is confirmed by the econometric analysis conducted for counties across the US. Long-term declines in employment and population – rather than in earnings, salaries, or wages – in places with relatively strong social capital propelled Donald Trump to the presidency. “By contrast, low social capital and high interpersonal inequality were not connected to a surge in support for Trump. These results are robust to the introduction of control variables and different inequality measures. “The analysis also shows that the discontent at the base of the Trump margin is not just a consequence of the 2008 crisis but had been brewing for a long time…“The surge in populism in the US – epitomised by the election of Donald Trump in 2016 – may not have come from, as suggested by Putnam (2020), low social capital or high interpersonal inequality (at least, at the local level), or their combination. “We argue that a fundamental driver in the swing of votes towards Donald Trump in the 2016 election is a factor that has remained relatively unnoticed not just in Putnam’s Bowling alone, but also in the overwhelming majority of the literature on the rise of populism in the US: The long-term economic and demographic decline of American towns and rural areas and the related rise in interterritorial inequality… “Places in the US that remained cohesive but witnessed an enduring decline are no longer bowling alone, they are golfing with Trump.” | SURPRISE This new analysis aligns with those noted above, but extends them to capture another effect of the combination of America’s “big sort” with the impact of globalization and technological change not on the economy overall, but on communities across the nation. On a personal note, this paper really grabbed me, because it described my anecdotal experience with communities around where I grew up in the Northeast United States. Contrary to what many perceive to be a solid Democratic bloc, in 2016 the region also cast a surprising number of votes for Trump, many of them clustered in communities like those described by Rodriguez-Post and his fellow authors. |
| | |
| | |
| | |
| | |
| | |
| | |
| | |
| | |
| | |
| | |
| | |
| New Political Information: Indicators and Surprises | Why Is This Information Valuable? |
| “How Hatred Came to Dominated American Politics”, by Lee Drutman, and “The Future is Faction” by Teles and Saldin | SURPRISE These papers explore similar trends to those noted above, but with more of a focus on their political implications. Like Cox, Drutman begins by describing the sharp decline in “favorable and warm” feelings that people have to “the other political party” between 1979 and 2016, in contrast to relatively unchanged feelings towards their own. He claims that three trends are at work: “(1) the nationalization of American politics, (2) the sorting of Democrats and Republicans along urban/rural and culturally liberal/conservative lines (cultural values are much more connected to geography than economic values), and (3) the increasingly narrow margins in national elections…which shifted the focus of politics such that Washington became the arbiter of national values.” Drutman concludes that, “there are two possible ways this ends. The first is the one we all fear – the unwinding of our democracy… The second scenario is a major realignment and/or a collapse of one (or both) of the two major parties, which could reorient American political coalitions and resurrect some of the overlaps of an earlier era.” Teles and Saldin offer a third possibility: the renewal of party factions, which could create new opportunities for cross-party compromises between their relatively moderate/centrist factions. Clearly, the renewal of factions is already visibly underway in the Democratic Party. The critical uncertainty is whether a center/right faction can re-emerge in the Republican Party, to compete for party loyalists with the nationalist/populists. A Trump loss in November could make this possible, while also shoring up the traditional Democrat faction against strengthening Democratic Socialist/progressive faction on its left. On the other hand, a Trump victory would be bad news for both the survival of the center/left Democratic faction and a rebirth of a center/right Republican faction. The end result would very likely be much more extreme and volatile politics in the United States. |
| In a campaign speech, Donald Trump launched an attack on “critical race theory”, and banned the use of federal funding for “race sensitivity training.” | SURPRISE Resentment against increasing “political correctness” in speech and behavioral “cancel culture” has been building for many years. However, up until recently, speech restrictions and cancel culture were mostly confined to university campuses and partisans on the more extreme political left. However, following this summers “Black Lives Matter” protests and riots, they have rapidly spread into many other institutions (e.g., see “Why is Wokeness Winning?” by Andrew Sullivan). Trump"s very public counterattack has provided a very public signal about the resistance and resentment many feel towards rapid and repressive cultural change. For better or worse, however, coming as it did from the mouth of an unpopular president in the middle of a bitter campaign, its medium-term effects are highly uncertain. That said, it is very likely to reinforce the increasingly bitter party divisions noted above. |
| More in Common released interesting survey data on the impact of COVID-19 on people in France, Germany, Italy, Netherlands, Poland, the UK and the US. Key findings: “Trust in each other has fallen, in some cases by a daunting margin… About half report feeling alone, and many perceive growing levels of division… In every country, majorities fears greater division, political instability, and severe economic depressions… In the UK, US, France, and Poland, people tend to feel deeply disappointed by their government’s handling of the crisis so far, while Germans and the Dutch feel greater levels of pride… Correspondingly, confidence in the government’s ability to tackle future crises is low everywhere except for Germany and the Netherlands.” | SURPRISE As I noted in a recent column published on LinkedIn (“COVID, Keynes, and Long-Term Confidence”), the COVID-19 pandemic is likely to be far more damaging to the economy than many currently expect, for a reason that many overlook: The long-term reduction in confidence and rise in uncertainty caused by the poor response of many institutions to the COVID pandemic. |
| “Welcome to the Turbulent Twenties” by Jack Goldstone. The author developed Demographic-Structural Theory, to demonstrate “how population changes shift state, elite and popular behavior.” In 2010, Peter Turchin applied this theory in his now famous paper, “Political Instability May Be A Contributor In The Coming Decade”. He observed that, “quantitative historical analysis reveals that complex human societies are affected by recurrent — and predictable — waves of political instability. In the United States, we have stagnating or declining real wages, a growing gap between rich and poor, overproduction of young graduates with advanced degrees, and exploding public debt. These seemingly disparate social indicators are actually related to each other dynamically. They all experienced turning points during the 1970s. Historically, such developments have served as leading indicators of looming political instability.” Turchin’s prescient conclusion was, “The next decade is likely to be a period of growing instability in the United States and western Europe” (see also, “The 2010 Structural-Demographic Forecast For The 2010–2020 Decade: A Retrospective Assessment”, by Turchin and Kotoayev). In his new paper, Goldstone concludes that “worse likely lies ahead.” His logic is as follows: “Our model is based on the fact that across history, what creates the risk of political instability is the behavior of elites, who all too often react to long-term increases in population by committing three cardinal sins. “First, faced with a surge of labor that dampens growth in wages and productivity, elites seek to take a larger portion of economic gains for themselves, driving up inequality. Second, facing greater competition for elite wealth and status, they tighten up the path to mobility to favor themselves and their progeny. Third, anxious to hold on to their rising fortunes, they do all they can to resist taxation of their wealth and profits, even if that means starving the government of needed revenues, leading to decaying infrastructure, declining public services and fast-rising government debts. “Such selfish elites lead the way to revolutions. They create simmering conditions of greater inequality and declining effectiveness of, and respect for, government. But their actions alone are not sufficient. “Urbanization and greater education are needed to create concentrations of aware and organized groups in the populace who can mobilize and act for change. “Top leadership matters. Leaders who aim to be inclusive and solve national problems can manage conflicts and defer a crisis. “However, leaders who seek to benefit from and fan political divisions bring the final crisis closer. Typically, tensions build between elites who back a leader seeking to preserve their privileges and reforming elites who seek to rally popular support for major changes to bring a more open and inclusive social order. “Each side works to paint the other as a fatal threat to society, creating such deep polarization that little of value can be accomplished, and problems grow worse until a crisis comes along that explodes the fragile social order… “In short, given the accumulated grievances, anger and distrust fanned for the last two decades, almost any election scenario this fall is likely to lead to popular protests on a scale we have not seen this century. Trump’s claims of millions of fraudulent mail-in ballots and a rigged, unfair election may be playing with fire; but our model shows there is plenty of dangerous tinder piled up, and any spark could generate an inferno.” | SURPRISE Goldstone and Turchin’s quantitative approach to “big history” is relatively rare (though that is changing as more young scholars follow the same path). For that reason, as well as its apparent predictive accuracy, for years I have found it very thought provoking. Goldstone’s latest analysis, and the forecast it makes, highlights the extreme importance of going beyond monetary and fiscal responses to the COVID crisis, and making long overdue structural reforms that will increase productivity and economic growth, and reduce the inequality in the distribution of its benefits. As Goldstone notes, and as Donald Trump’s presidency has made painfully clear, that requires very talented leadership, particularly in an era of extreme polarization and political parties as near-religious meta-identities. The stakes are obviously extremely high. The critical uncertainty is whether, if they win in November, Joe Biden and Kamala Harris are up to the challenges they will face at a pivotal moment in history. More broadly, this uncertainty applies to American elites in general, especially those in charge of the country’s public, private, and not-for-profit institutions (see Martin Gurri’s “The Revolt of the Public and the Crisis of Authority in the New Millennium”, and Ed Luce’s “The Discreet Terror Of The American Bourgeoisie”). |
| | |
| | |
| | |
| | |
| | |
| | |
| | |
| | |
| | |
| New Financial Markets and Investor Behavior: Indicators and Surprises | Why Is This Information Valuable? |
| “How Much Information Is Incorporated In Financial Asset Prices?” by Page and Siemroth “We investigate the informational content of prices in financial asset markets… We find that public information is almost completely reflected in prices, but that surprisingly little private information -- less than 50% -- is incorporated in prices.” In “How Market Ecology Explains Market Malfunction”, Scholl et al add both uncertainty and time varying weights of different investment strategies that are active in markets at any point in time as further reasons why financial markets can operate far from equilibrium for long periods of time. | Both of these new papers reinforce critical points that we have made time and again: Market prices don’t fully reflect the implications of investors’ private information, nor do they fully take into account the effects of uncertainty (which unlike risk cannot be quantified, priced, and transferred), perhaps the most important of which is investors’ tendency to copy the behavior of others when it is high. These factors can cause the emergence of large losses, which usually happen much more suddenly than large gains. |
| In its September Quarterly Review, the Bank for International Settlements was surprisingly blunt: “Financial markets recorded further gains during the review period, despite the challenging macroeconomic outlook. A divergence emerged between, on the one hand, elevated stock valuations and tightening credit spreads and, on the other, the reality of an economic recovery that looked incomplete and fragile… “The evolution of aggregate equity valuations appeared to be somewhat at odds with the general economic outlook… “Similarly to aggregate stock market patterns, credit spreads looked remarkably tight when contrasted with subdued expectations for the real economy… “These spreads indicate that credit markets seem to expect that corporate bankruptcy rates will continue to be low, even though this would be at odds with historical experience. Concretely, if historical relationships continued to hold, the 2020 GDP growth forecasts – ranging between –(4.5%) and (11.0%) – would be consistent with bankruptcies increasing by 20–40% in 2020.” | Today’s markets seem to be an excellent example of the points made above – as the BIS notes, valuations seem to be at substantial variance with economic reality. In his typical fashion, the Financial Times’ John Dizard bluntly noted the implications of this divergence in his column, “Why Be a Hero? Sell ‘Em All.” As he warned, “This rally, by the way, is pretty close to the recovery in US shares between November 1929 and May 1930.” |
| “Roboadvisers Make Slow Progress Gaining Ground With Investors”, by Rheaa Rao in the Financial Times. “Many large asset managers have shelled out time and money to develop roboadvisers. But, while assets invested in them are growing, only a small proportion of investors actually use such digital services, according to a report by data and analytics firm Hearts & Wallets. “Just 8 percent (10 million) of US households report having money in such services… Use of robos is highest among millennials and so-called Generation X households (those born between the mid 1960s and early 1980s), with 13 per cent and 10 per cent respectively enrolled in robo…More than half of investors who use robo-advisers appear to be nudged into them by companies whose funds they already use.” | Will COVID sink roboadvisers? Here’s why it seems likely: (1) Roboadvisers generally stay fully invested; they may switch between asset classes, and securities within them, but generally not into cash. (2) Consider the nature of the algorithms that are making these allocation decisions. The fundamental problem is that the system that generated the data on which they were trained is constantly evolving (i.e., non-stationary). In such systems, particularly if they are quickly evolving, the past is a poor basis for predicting the future. To be sure, some algorithms are continuously updated on the basis of the latest market results. Yet as we have seen, there are many reasons that markets can operate far from equilibrium for long periods of time. Hence constantly updating an algorithm using recent data is arguably a form of herding that does not eliminate, and in fact may increase exposure to the rapid emergence of large losses. Other algorithms seek to avoid such losses by incorporating various signals that in the past have provided early warning of trouble ahead. But this works only under two conditions: the signals have to remain valid, and relatively few algorithms have to incorporate them – otherwise when they appear they will trigger a sudden rush to sell that may actually worsen realized losses. As we have repeatedly noted, current machine learning algorithms are based on associational, not causal or counterfactual reasoning. That is why human beings are able to reason about complex adaptive systems like global macro and financial markets beyond the “detection horizon” of algorithms, and spot substantial downside risks before they generate signals that will trigger algorithmic portfolio allocation decisions. On the other hand, that is also why in in our Technology Evidence File you will see a substantial amount of evidence related to the rate at which algorithmic implementation of more complex causal and counterfactual reasoning, and related technologies (e.g., natural language processing, knowledge networks, and agent based modeling) are developing. In so far as the global political economy and financial markets are now, post-COVID, operating in unchartered territory, we suspect that at some point roboadvisers’ algorithms may be blindsided by the tail events that we know complex adaptive systems produce, with the effects amplified by their tendency to always remain fully invested, regardless of metrics indicating worsening overvaluation across multiple asset classes. |
| “BDs Selling Far Riskier Investments Than RIAs, NASAA Finds”, by Tracey Longo “Broker-dealers were two to eight times more likely than registered investment advisors to recommend risky investments in 2018,according to the findings of nationwide regulatory examinations designed to benchmark the practices of more than 2,000 firms and 360,000 practitioners working with 68 million retail investor accounts… “One finding that stands out from the examinations, performed in 34 states: When complex products were sold, broker-dealers were twice as likely as investment advisors to recommend the purchase of leveraged and inverse ETFs, seven times as likely to recommend private placements, eight times as likely to recommend variable annuities, and nine times as likely to recommend non-traded REITs, the North American Securities Administrators Association (NASAA) said in its exam report.” | We’re just shocked, shocked. RIAs have a fiduciary duty to put the client’s interest ahead of their own. Broker Dealers do not have a fiduciary duty to clients, and must only be able to justify that an investment was suitable, given a client’s needs. However, much the BD community may argue that in practice there is no difference between fiduciary duty and suitability, surveys like this are a strong argument that very significant differences still exist. |
| | |
| | |
| | |
| | |
System Tipping Points/Critical Threshold Analysis
Like Professors Andrew Lo, Doyne Farmer and others, we regard financial markets as a complex adaptive system (CAS), that exist as part of a larger macro system comprised of other CAS between which there are multiple feedback loops. These other systems include those that produce technology innovations, and economic, environmental, national security (including cyber), social, demographic, and political outcomes.
We also find that these systems tend to operate and generate effects in a rough chronological sequence, albeit with many feedback loops between them. The following chart highlights that the changes we observe in different areas at any point in time are actually part of a much more complex evolutionary process.
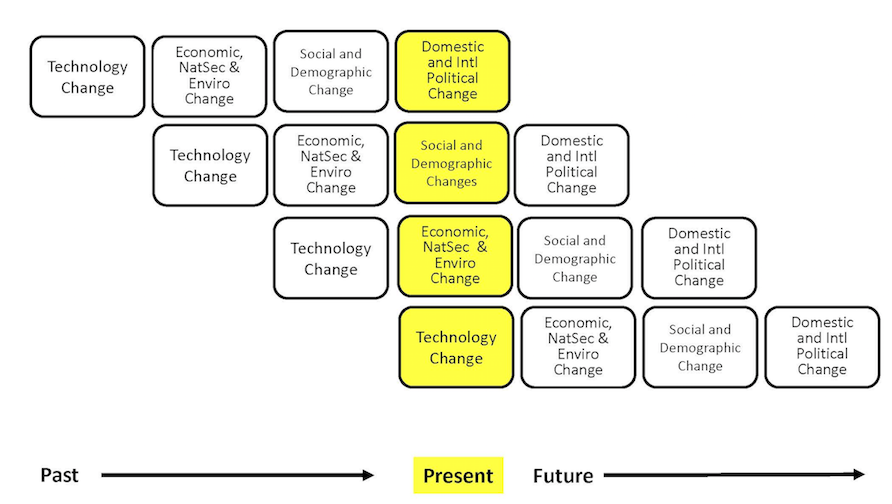
While most media coverage of these systems focused on flows (e.g., the size of the government deficit), rapid non-linear change in complex adaptive systems is often caused by a key stock (e.g., the amount of outstanding government debt) exceeding a critical threshold.
The next table highlights the key macro system stocks that we monitor.
In the next section, we will discuss information received over the past month that is related to these stocks, and which we believe is significant to our assessment of the probabilities that a critical threshold will be reached and a regime change will occur. We will conclude with our estimate, at the end of this month, of how close the macro system is to these critical thresholds, and the implications for financial market regime change probabilities.
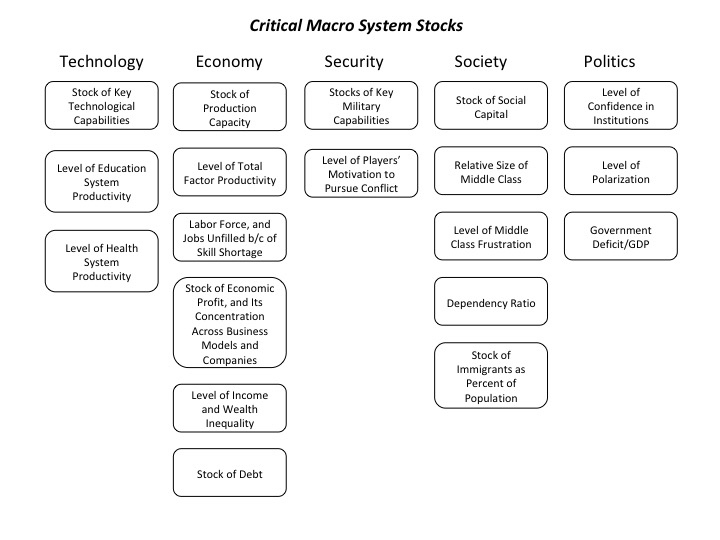
How Close is the Macro System to One or More Critical Thresholds?
As we have noted, the macro drivers of financial market regime changes typically follow a rough chronological sequence, from technology to economic, security, social, and political causes and effects. Yet there are many feedbacks loops between them, creating complex root causes for many of the critical thresholds we have identified.
Understanding the time dynamics in this complex system is critical to avoiding substantial downside investment risk.
We use the UK Met Office Warning Model to communicate our assessment of these time dynamics. We estimate the time remaining before a critical macro system threshold is reached that could trigger a regime change, which is usually accompanied by substantial changes in asset class valuations.
The model uses three increasingly serious levels of warning, from “Be Aware” (condition yellow), to “Be Prepared” (condition orange), to “Take Action” (condition red).
For our purposes, we denote as “Be Aware” (yellow) critical thresholds that we assess to be three or more years away. We estimate that “Be Prepared” (orange) thresholds could be reached within 1 to 3 years. “Take Action” thresholds are very likely to be reached within one year.
Given their nature, we also note that in our three “wildcard” areas (Environment and Energy related; Disease and Human Caused Bioevents; and Cyber and Electromagnetic Events), our forecasts have higher levels of uncertainty.
The following charts summarize our current estimate of the time remaining before different critical thresholds will be reached.
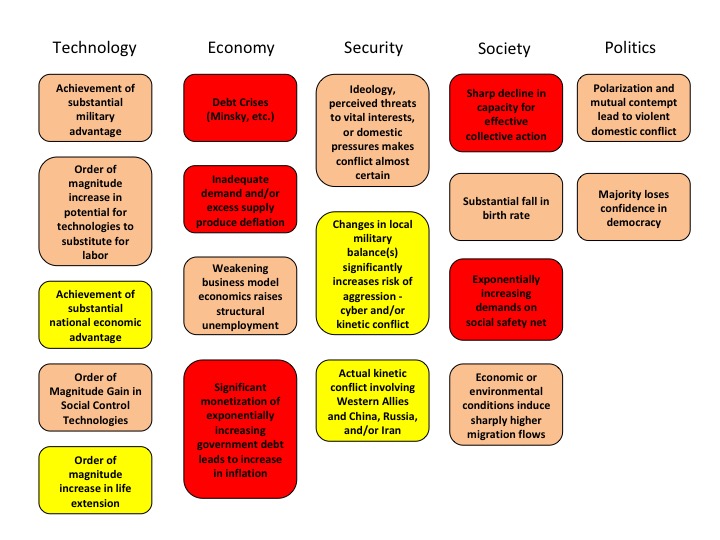
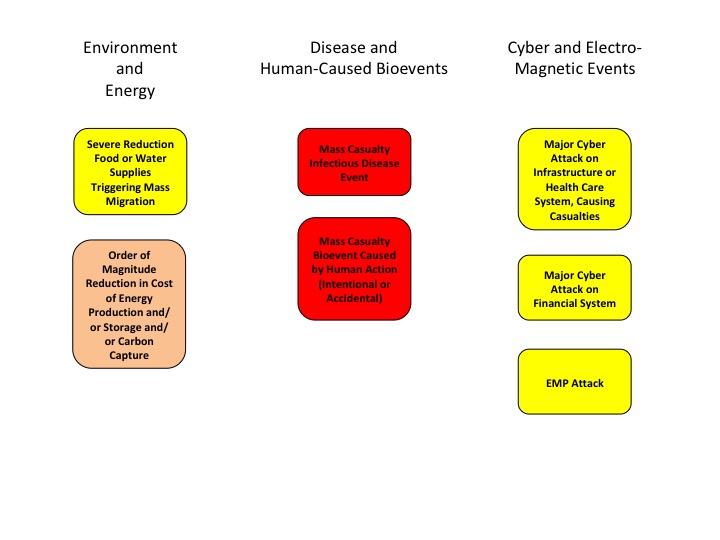
At the highest level, we believe the complex adaptive global macro system can be in one of four states, based on its degree of order versus disorder, and degree of social cooperation versus conflict. A very coarse-grained reading of history suggests that these states evolve in a predictable cycle, from ordered/cooperative, to disordered/cooperative, to disordered/conflicted, to ordered/conflicted.
We believe that the system is currently in its most uncertain state, characterized by high degrees of underlying disorder and social conflict, both domestically and internationally. Beyond some point, intensifying conflict eventually increases the degree of order in the system. That appears to be happening now, via the increasing conflict between China, Russia, and Iran and the United States and other Western nations.
If you have any questions about anything we have written in this issue, please don’t hesitate to get in touch, at contact@indexinvestor.com
Appendix: Anticipatory Thinking and Forecasting Methodologies
Our process is based on methods and tools developed over the past seven years at our affiliate, Britten Coyne Partners, which provides consulting services and education courses to executive teams and boards on strategic risk governance and management.
At The Index Investor, we engage in both anticipatory thinking to identify what could happen (e.g., different macro regimes and related events), and forecasting, to estimate the probability that events and regimes will happen, and the impact they will have if they do (e.g., on macro variables and broad asset class returns).
With respect to what could happen, we are acutely conscious of the conclusion reached by a 1983 CIA study of failed forecasts: "each involved historical discontinuity, and, in the early stages…unlikely outcomes. The basic problem was…situations in which trend continuity and precedent were of marginal, if not counterproductive value."
When it comes to forecasting, we know that in complex socio-technical systems that are constantly evolving, the accuracy of statistical or machine learning based forecasting methods declines exponentially as the time horizon lengthens, since the historical data set on which they were trained will (depending on the speed and effectiveness of any retraining cycle) bear less and less resemblance to the distribution of outcomes the system is likely to produce in the future.
Under these circumstances, forecast accuracy over longer time horizons depends on causal and counterfactual reasoning about the possible future effects of multiple interacting trends and uncertainties that are hard to quantify.
And we are acutely aware of the economist Rudi Dornbusch's famous warning: "Crises take a much longer time coming than you think, then happen much faster than you would have thought."
Our forecasting process also draws on lessons Tom Coyne learned from spending four years as a member of the Good Judgment Project team, which won the Intelligence Advanced Research Projects Activity’s forecasting tournament with forecast accuracy that was more than 50% better than the tournament's control groups (the team's experience is described in Professor Philip Tetlock's book, “Superforecasting").
Our analysis focuses on the probability of the global macro system being in four possible macro regimes 12 and 36 months from the date of our forecast: (1) Normal Times, where equity asset classes perform well; (2) a High Uncertainty regime that is usually short and transitory, where asset classes like short-term government bonds perform best and equities suffer significant declines; (3) High Inflation (which we deem 5% or more, year-on-year), where commercial property, real return bonds and other traditional hedges are favored; and (4) Persistent Deflation (a year-on-year decline in the US CPI), which up to now has only been seen in Japan, and in which the relative performance of different asset classes remains uncertain, but will likely favor high quality bonds and the consumer staples equity sector.
In response to subscriber requests, we have added a 36-month regime forecast to our existing 12 month forecast. The logic is that, in a complex evolving system like global macro, a longer forecast horizon gets beyond the “detection range” of algorithmic forecasting approaches, and therefore raises probability that a manager/investor can gain an edge in identifying emerging threats and opportunities.
That said, because evolving (i.e., “non-stationary”) complex systems populated by highly connected human agents are also capable of sudden non-linear changes (with which are hard for algorithmic approaches to predict), we are also keeping our 12 month forecast.
Our forecasting methodology starts with base rate/reference case data about the historical probability of large changes in equity and bond valuations. We then analyze the current situation from both a quantitative and qualitative perspective. In the latter, we focus on the key endogenous drivers of macro regime change, including technological, economic, national security, social, and political trends and uncertainties. We also focus on three potential sources of exogenous shocks that could also produce a macro regime change, caused by environmental, disease, and cyber related events.
While most of our attention typically focuses on various flows (e.g., economic growth, change in the price level, sales, earnings, job creation, etc.), endogenously caused regime changes result when those flows push key stocks beyond a critical threshold or tipping point, often setting off non-linear reactions across multiple areas. As noted by Hyman Minsky and others, a classic example is the steady accumulation of outstanding debt until it reaches the point where it can no longer be serviced and triggers a crisis.
Base Rate Data
Since the end of World War Two, there have been fifteen months where a downturn in the US equity market began that eventually reduced asset class value by 20% of more. That is a hazard rate of about 1.75% per month. Put differently, in any given month there is a 98.25% probability that a 20%+ downturn won’t occur, or, in a given year, an 81% probability.
However, as the time without a 20%+ downturn extends, the compound probability that one will not occur shrinks. At the end of August 2018, it is more than nine years since the last equity market decline of 20% or more. The probability of that happening is only 15%.
To estimate the base rate for a 20% fall in bond prices (which historically has been caused by a sharp increase in inflation, as we saw in the late 1970s and early 1980s), we analyzed monthly historical AAA bond yields since 1919. For consistency, we used them to calculate the price of a ten-year zero coupon bond. We then calculated the probability of a price decline of 20% or more over three different holding periods: 12, 18, and 24 months. In any month, the annualized probability of a decline of 20% or more over the subsequent 12 months is 12%; over 18 months, 20%, and over 24 months, 25%.
Market Stress Indicators Methodology
We view financial markets as a complex adaptive system. The size of changes generated by such a system follows a power law rather than a normal (Gaussian) distribution. The critical point is that large changes are much more common in complex adaptive systems than most people’s intuition leads them to believe.
While predicting the behavior of complex adaptive systems remains far more art than a science, various researchers have found that large changes in such systems are often preceded by subtle warning signs, as stress accumulates within them. While this research is not definitive, we believe that five warning signs are worth monitoring as potential indicators of growing stress within financial markets that could suddenly give rise to large changes in asset class valuations.
Our first indicator is the month-to-month autocorrelation of broad asset class returns (i.e., the relationship of this month’s returns to last month’s). A system under increasing stress loses resiliency, causing it to take longer to recover from perturbations; hence, autocorrelation increases as it approaches a critical transition (see, “Early Warning Signals for Critical Transitions” by Scheffer, et al).
The second market stress indicator we monitor is the Economic Policy Uncertainty Index published by the Federal Reserve Bank of St. Louis (via its FRED economic database), which is based on research by Baker, Bloom, and Davis (see their paper, “Measuring Economic Policy Uncertainty”). The index is based on automated text analysis of leading newspapers and magazine publications, to identify the frequency with which words and phrases are used that indicate uncertainty.
In humans’ evolutionary past, when uncertainty increased the probability of survival was enhanced by staying close to a group. All of us still have that instinct. Research has found that as uncertainty increases, we have an unconscious bias towards higher conformity of our own views with those of a larger group (i.e., reduction in cognitive diversity). Behaviorally, heightened uncertainty induces more “social copying” of others, likely due to both conformity bias and the rational belief that others may be acting on the basis of superior information. This increase in conformity and copying makes a social system more ordered as uncertainty increases, and also reduces its responsiveness to perturbations (i.e., increases autocorrelation) because of delays in the social copying process.
The key point is that increasing uncertainty induces more, not less order in social systems, and in so doing primes them for sudden non-linear change.
Our third market stress indicator is the spread between the yield on AAA rated bonds and the 10-year US Treasury. This is a proxy for the level of investor concern about financial system funding liquidity.
Our fourth market stress indicator is the yield spread between speculative BB rated bonds and the ten-year US Treasury. Throughout history, excessive credit growth has been a root cause of many financial crises. An indicator of such growth is falling credit spreads, particularly in the case of riskier borrowers. In contrast, rising BB spreads indicate growing investor concern about the consequences of such growth, and the financial distress lower rated companies could experience in an economic downturn.
Our fifth market stress indicator is what we term the “political risk premium” that is implicit in the price of gold. Our starting point for estimating this premium is the three different roles that gold plays. First, gold is a store of value in a world of fiat currencies. When the rate of money supply growth exceeds the growth of nominal GDP, gold’s price should increase to maintain its purchasing power. Between 2007 and 2017, the US money supply (M2) grew by about 86%, while nominal US GDP grew by 35%. The stock of gold grew by 18%, based on mine production over this period. We therefore infer that 33% of the increase in the price of gold represented the maximum potential gold price change that could be attributed to a desire to hedge inflation risk (86% less 35% less 18%).
Second, gold is a unit of account. We take this to mean that the annual change in GDP expressed in terms of physical gold (i.e., nominal GDP divided by the price of gold) should equal the change in real GDP calculated using the GDP price deflator to account for actual inflation over the period. A key challenge is the point at which to start this calculation.
We chose the price of gold in 1995/1996. In that period, the change in real global GDP measured using the IMF’s price deflator just about equaled the change in GDP measured in terms of physical gold. We interpret that coincidence as indicating that at that point in time, concerns about future inflation and political risk were minimal, and the change in the price of gold was mostly driven by its role as a unit of account. We calculated a subsequent series of gold prices that would produce the same change in “gold GDP” as the actual real GDP as calculated by the IMF. Between 2007 and 2017, “gold as a unit of account” warranted a 21% increase in its price.
Gold’s third role is as a hedge against inflation and what we term “political disaster” risk. We subtract the 21% estimated compensation for actual inflation from the 33% “gross” inflation risk hedge to derive an apparent 12% increase in the gold price that reflected the true risk premium to hedge against possible future inflation. However, between 2007 and 2017 the price of gold actually increased by 81%. This implies that 48% of this (81% less 21% less 12%) represented a premium for some other type of uncertainty at the end of 2017. The interesting question is the nature of the uncertainty for which gold is believed by some investors to be a superior hedge than traditional ports in a storm like short-term US government securities, or similar securities issued by other developed countries.
The logical inference is that the uncertainty in question must reflect a situation in which short term US Treasuries would be a less effective hedge than gold. This could be a world of widespread hyperinflation, capital controls, and/or radical changes in nations’ governments (of course, this would also imply a preference for investing in gold coins rather than bullion, as while the latter may be a store of value, it is far less convenient as a means of paying for transactions).
To put this in further perspective, this gold price “disaster risk” premium sharply increased from 2008 to 2012, then declined before sharply increasing again after 2016. Arguably, a significant part of the former increase reflects concerns about the potential inflationary consequences of dramatic quantitative easing by central banks. But this is not likely to be the case after 2016.