The Index Investor
October 2019
Market Stress Indicators
Macro Regime Forecast
Tactical Asset Allocation Implications of Our Forecasts
Pre-Mortem Analysis
Critical System Thresholds/Tipping Points Analysis
Combining and Extremizing Forecasts to Improve Predictive Accuracy
High Value Information Observed Last Month
Feature Article: Macro and Asset Allocation Implications of Environmental Trends and Uncertainties
Appendix: Anticipatory Thinking and Forecasting Methodologies
Asset Class Valuation and Momentum Indicators (@30Sep19)
| Asset Class (ETF) | Valuation | 1 Month Return | Conclusion |
| US Real Return Govt Bond (TIP) | Likely Overvalued* | (1.11)% | Decreasing Overvaluation |
| US Nom Return Govt Bond (GOVT) | Likely Overvalued* | (0.82)% | Decreasing Overvaluation |
| US Investment Grade Credit (LQD) | Close to Fairly Valued* | (0.75)% | Close to Fairly Valued |
| US High Yield Credit (HYG) | Almost Certainly Overvalued* | 0.44% | Increasing Overvaluation |
| US Commercial Property (VNQ) | Likely Undervalued* | 1.91% | Decreasing Undervaluation |
| US Equity (VTI) | Likely Overvalued* | 1.78% | Increasing Overvaluation |
| Foreign Devel Mkt Equity (VEA) | Very Likely Undervalued* | 3.16% | Decreasing Undervaluation |
| Emerging Markets Equity (VWO) | Very Likely Overvalued* | 0.94% | increasing Overvaluation |
| Timber (WY) | Almost Certainly Undervalued* | 6.58% | Decreasing Undervaluation |
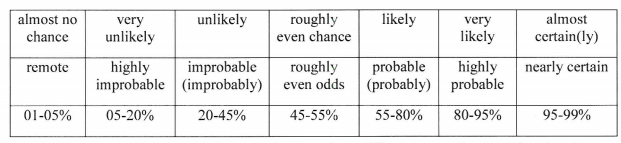
Note: The language we use to describe our estimated likelihood of asset class over or undervaluation is based on US Intelligence Community Directive 203 on Analytic Standards, which includes the following table:
Market Stress Indicators (@30Sep19)
| Market Stress Indicator | This Month vs Last Month |
| Asset Class Returns Autocorrelation (this month versus last month). Higher autocorrelation is an indicator of higher market stress. | (.50) vs .29 last month. Indicates a higherlevel of market stress compared to last month. |
| Economic Policy Uncertainty Index (how many days over the last 30 was index in top quartile of values since 1985?) | On 11 days the index was in the top quartile of daily values since 1984 (the 72nd percentile of all rolling 30 day counts). This is a decrease from 16 last month, but still a high level. |
| AAA Rated Bonds Spread over 10 Year Treasury Yield (month end). Higher spreads indicate rising concern about market liquidity. | 1.33% (53rd percentile since 1983), essentially unchanged from last month. This is still considerably higher than in April 2018 when the liquidity spread was only 1.00%. |
| BB Rated Bonds Spread over 10 Year Treasury Yield (month end). High spreads indicate increasing credit risk. | 2.32% (18th percentile since 1996), essentially unchanged since last month. Extremely low after ten years without a recession. |
| Gold Price per Ounce in US Dollars (month end). Rising gold prices are an indicator of increasing market uncertainty and stress. | $1,487 vs $1,526, down 2.6% from last month. At the end of 2017, we estimated the "disaster premium" in the gold price was 47% (see our methodology in the Appendix). At the end of last month, the estimated premium was 62%. |
At the end of September, four of our five quantitative indicators showed either an unchanged level of relatively high market stress, or a slight decline, and one showed an increase. However, these must be seen in the light of qualitative evidence, like repo funding problems and rising uncertainty, that indicate a very high level of underlying market tension and potential for sudden disruptive change.
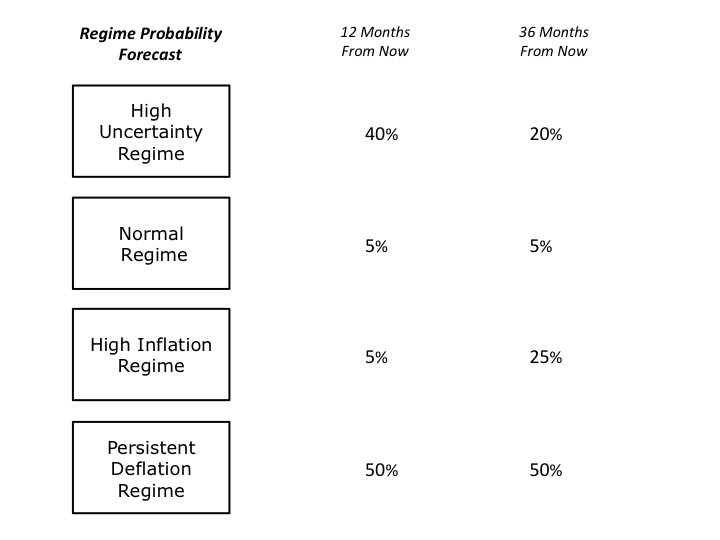
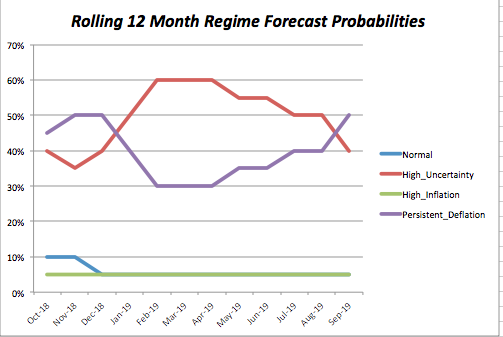
Macro Regime Forecast Probabilities (@30Sep19)
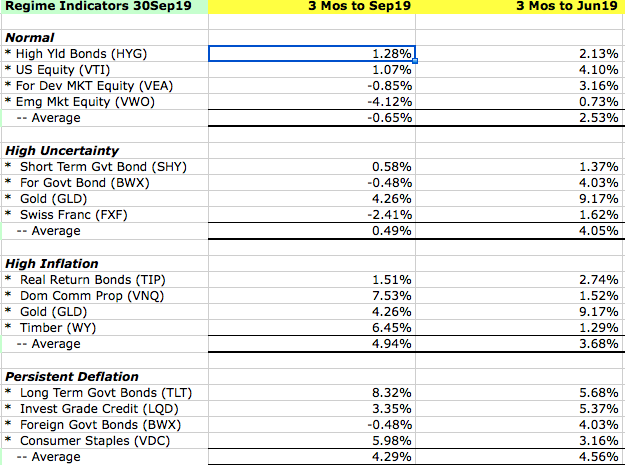
The Current State of Quantitative Regime Predictors
Our quantitative forecast methodology focuses on the level and change in three-month returns, over the most recent and previous three-month periods, for those asset classes, which should perform best under different regimes (in this sense, our regimes can be regarded as macro factors). We assume that higher returns are associated with a higher underlying probability for the relevant macro regime.
Qualitative Considerations
As covered in more detail in this month’s Evidence File (see below), here are the most important new indicators and surprises that influenced this month’s changes to our regime probability forecast:
- Technology: Indications that AI deployment may be faster and more powerful than previously expected, which could cause greater job losses, worsening inequality, and weaker aggregate demand.
- Economy: Further increases in uncertainty, which depress demand with a lagged effect, and more indications of weakening global aggregate demand.
- National Security: Continuing indicators (e.g., the military hardware displayed at the Chinese Communist Party’s 70th anniversary parade) that the conflict between China, the West, and some of its regional neighbors is more likely to intensify rather than moderate in the years ahead. Also the Iranian attack on Saudi oil facilities, and further worsening of the Honk Kong crisis.
- Society: New data showing accelerating economic growth divides between different US regions, and a widening values divide between different groups, both of which further undermine the nation’s capacity for collective action (in the face of internal challenges, if not external threats).
- Politics: Launch of the process to impeach, convict, and remove Donald Trump from office.
- Financial Markets: Repo market problems, revelation that 60% of high yield bonds and leveraged loans are held by retail collective investment vehicles promising daily liquidity to investors, Boston Fed president Rosengren’s comments on how the co-working boom (and the underlying maturity transformation of office leasing) may pose a systemic threat, the sharp increase in secondary private equity transactions, the negative impact of credit derivatives in the Thomas Cook bankruptcy (as an indicator of what lies ahead on a larger scale when the global economy turns down), and new research showing that 25% of US public sector pension assets are valued on an appraisal basis.
Tactical Asset Allocation Implications of Our Forecasts
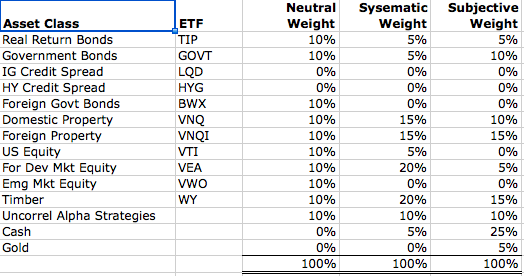
Based on subscriber requests, this month we are re-introducing a feature from the previous version of The Index Investor: Tactical Asset Allocation Implications from our analyses.
These take two forms. The first takes a systematic approach, and is based on relative asset class valuations. Our starting point is our “neutral” model portfolio, which is equally weighted across nine broad asset classes, and also includes a 10% allocation to alpha strategies (equity market neutral and global macro) that are designed to have a low correlation to returns on broad asset classes. Based on asset class valuations, we systematically vary the asset class weights (but not the active strategy weight), increasing from 10% to 15% when an asset class is likely undervalued, and 15% when it is very likely undervalued. In the case of overvaluations, we go to 5% and then into cash, if there are no undervalued asset classes with room for an increase. In effect, this replicates the systematic rebalancing strategy we used for 15 years in our previous model portfolios.
The second tactical approach is based on our subjective view not only of current asset class valuations, but also of the implications of the broader macro trends and uncertainties that we analyze each month. Importantly, this subjective view reflects our primary goal of avoiding large downside losses, rather than seeking large upside gains.
Two final notes. First, with respect to US fixed income, we include credit products (investment grade and high yield) in the same asset class as government debt, and will shift into the former when their valuations become attractive. Second, we regard gold not as a separate asset class to be held long-term, but rather as a complement to cash, into which we shift in periods of substantial overvaluation across multiple asset classes.
Here are our tactical asset allocation views at the start of October:
Pre-Mortem Analysis
One of the most important forecasting disciplines is to ask yourself why your forecast could be wrong. Dr. Gary Klein’s research has shown that a very powerful and insightful way to do this is via a “pre-mortem analysis.” This method asks you to assume that it is a point in the future, and your forecast has been proven wrong (or your strategy or company has failed). You are then asked to look backward from this imagined point in the future, to explain why you failed, what you missed, and what you could have done differently to avoid your fate.
The pre-mortem method takes advantage of the fact that humans reason much more concretely and in more detail when explaining the past than they do when trying to forecast the future.
So let us assume that it is one year from now, and our current forecast has turned out to be wrong.
How did this happen? What developments did we fail to anticipate? Here are three possibilities:
- The leaders of the world’s three major powers – Xi Jinping, Donald Trump, and Vladimir Putin are all facing weakening economies and declining political popularity. History teaches us that this can lead to increased “foreign adventurism” to distract the public from worsening domestic conditions, as a nation rallies around its leader in a period of heightened external conflict. Should a “kinetic” conflict develop between China and the United States, or between Russia and one or more European countries (e.g., due to a Russian incursion into the Baltics), it would generate a very sharp increase in uncertainty that would likely cause an equally sharp economic slowdown which, given high debt levels, would speed the arrival of the Persistent Deflation Regime.
- While the probability is remote, a supply side shock of some type could produce a sudden increase in inflation – the most likely scenario being a reduction in oil supplies due to a prolonged kinetic conflict between Iran and the US that produced a extended disruption in global oil supplies, or, less likely, an infectious disease pandemic or major crop failures (e.g., due to climate change and/or disease).
- Though we still believe it is unlikely, it is becoming easier envision a scenario in which both Xi Jinping and Donald Trump leave their current roles, and are replaced by leaders who are more committed to lessening the intensifying conflict between China and other nations. This would likely provide a strong boost to confidence (and thus lead to an equally strong reduction in uncertainty). However, a reduction in perceived external threats might also intensify already substantial internal divisions and conflicts in China and the United States, which could, ironically, also lead to the deflation regime.
System Tipping Points/Critical Threshold Analysis
Like Professors Andrew Lo, Doyne Farmer and others, we regard financial markets as a complex adaptive system (CAS), that exist as part of a larger macro system comprised of other CAS between which there are multiple feedback loops. These other systems include those that produce technology innovations, and economic, environmental, national security (including cyber), social, demographic, and political outcomes.
We also find that these systems tend to operate and generate effects in a rough chronological sequence, albeit with many feedback loops between them. The following chart highlights that the changes we observe in different areas at any point in time are actually part of a much more complex evolutionary process.
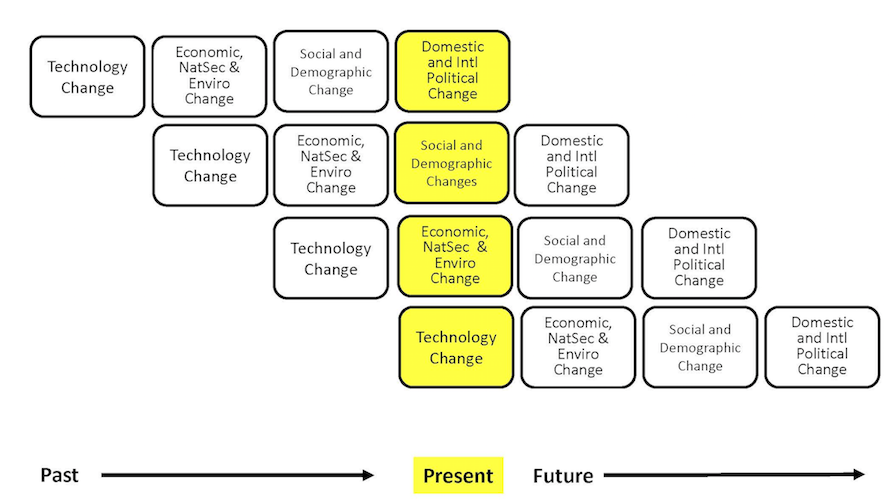
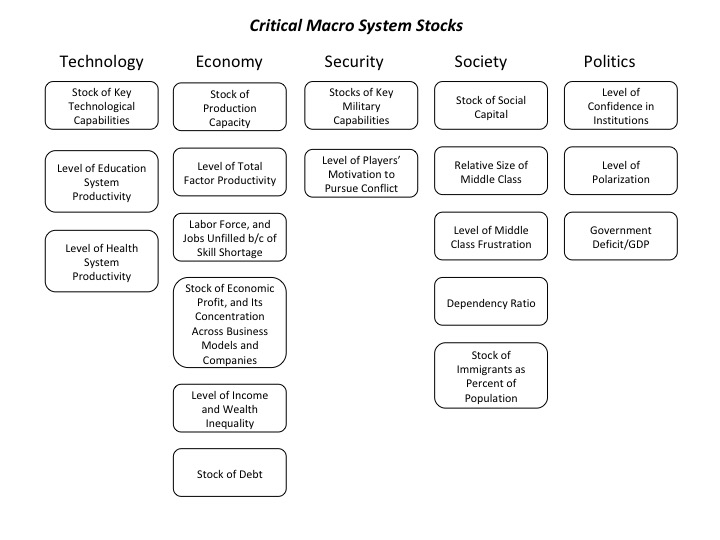
While most media coverage of these systems focused on flows (e.g., the size of the government deficit), rapid non-linear change in complex adaptive systems is often caused by a key stock (e.g., the amount of outstanding government debt) exceeding a critical threshold.
The next table highlights the key macro system stocks that we monitor.
In the next section, we will discuss information received over the past month that is related to these stocks, and which we believe is significant to our assessment of the probabilities that a critical threshold will be reached and a regime change will occur. We will conclude with our estimate, at the end of this month, of how close the macro system is to these critical thresholds, and the implications for financial market regime change probabilities.
How Close is the Macro System to One or More Critical Thresholds?
As we have noted, the macro drivers of financial market regime changes typically follow a rough chronological sequence, from technology to economic, security, social, and political causes and effects. Yet there are many feedbacks loops between them, creating complex root causes for many of the critical thresholds we have identified.
Understanding the time dynamics in this complex system is critical to avoiding substantial downside investment risk.
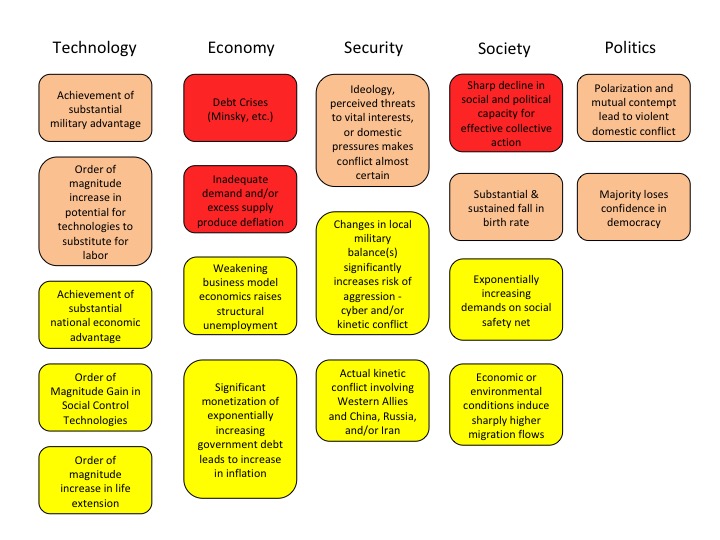
We use the UK Met Office Warning Model to communicate our assessment of these time dynamics. We estimate the time remaining before a critical macro system threshold is reached that could trigger a regime change, which is usually accompanied by substantial changes in asset class valuations.
The model uses three increasingly serious levels of warning, from “Be Aware” (condition yellow), to “Be Prepared” (condition orange), to “Take Action” (condition red).
For our purposes, we denote as “Be Aware” (yellow) critical thresholds that we assess to be three or more years away. We estimate that “Be Prepared” (orange) thresholds could be reached within 1 to 3 years. “Take Action” thresholds are very likely to be reached within one year.
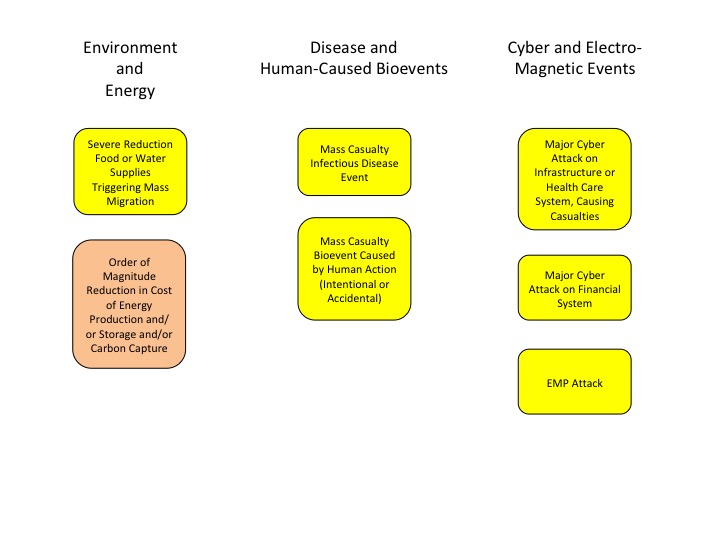
Given their nature, we also note that in our three “wildcard” areas (Environment and Energy related; Disease and Human Caused Bioevents; and Cyber and Electromagnetic Events), our forecasts have higher levels of uncertainty.
The following charts summarize our current estimate of the time remaining before different critical thresholds will be reached.
At the highest level, we believe the complex adaptive global macro system can be in one of four states, based on its degree of order versus disorder, and degree of social cooperation versus conflict. A very coarse-grained reading of history suggests that these states evolve in a predictable cycle, from ordered/cooperative, to disordered/cooperative, to disordered/conflicted, to ordered/conflicted.
We believe that the system is currently in its most uncertain state, characterized by high degrees of underlying disorder and social conflict, both domestically and internationally. Beyond some point, intensifying conflict eventually increases the degree of order in the system. That appears to be happening now, via the increasing conflict between China, Russia, and Iran and the United States and other Western nations.
Note: Combining Our Forecasts with Others From Other Sources and Extremizing the Result Should Increase Your Predictive Accuracy
Research has found that three steps can improve forecast accuracy. The first is seeking forecasts based on different forecasting methodologies, or prepared by forecasters with significantly different backgrounds (as a proxy for different mental models and information). The second is combining those forecasts (using a simple average if few are included, or the median if many are). The final step, which significantly improved the performance of the Good Judgment Project team in the IARPA forecasting tournament, is to “extremize” the average (mean) or median forecast by moving it closer to 0% or 100%.
Forecasts for binary events (e.g., the probability an event will or will not happen within a given time frame) are most useful to decision makers when they are closer to 0% or 100% than the uninformative “coin toss” 50%. As described by Baron et al in “Two Reasons to Make Aggregated Probability Forecasts More Extreme”, forecasters will often shrink their probability estimates towards 50% to take into account their subjective belief about the extent of potentially useful information that they are missing.
When you average multiple forecasters’ estimates, you are including more information, which should increase forecast confidence and push the mean estimate closer to 0% or 100%. However, this doesn’t happen when you use simple averaging. For this reason, forecast accuracy is increased when you employ a structured “extremizing” technique to move the mean estimate closer to 0% or 100%.
You can download an extremizing model from our website to use when combining the forecasts you use in your decision process.
The extremizing factors in our model are those that the Good Judgment Project found maximized the accuracy of combined forecasts. Note that the extremizing factor is lower when average forecaster expertise is higher. This is based on the assumption that a group of expert forecasters will incorporate more of the full amount of potentially useful information than will novice forecasters.
High Value Information Observed In September 2019
In our model of the complex macro change drivers are arrayed in a roughly chronological process (albeit one with many feedback loops), in which technological change precedes changes in the economy and national security, which in turn lead changes in society and politics, all of which produce the effects we observe in investor behavior and financial market valuations and returns.
In our methodology, we classify new information as significant and highly valuable if either it (1) is an “indicator”, which reduces or increases our uncertainty about the value of a parameter in our mental model for making sense of the dynamic macro system, or (2) it is a “surprise” which increases our uncertainty about, and causes us to revaluate the structure of our mental model.
| New Technology Information: Indicators and Surprises | Why Is This Information Valuable? |
| The 12Sep19 edition of The Economist had a special section on the next revolution in technology. | Some highlights: “Drastic falls in cost are powering another computer revolution…The Internet of Things is the next big idea in computing.” “Over the past century electricity has allowed consumers and businesses at least in the rich world, access to a fundamental, universally useful good—energy—when and where they needed it. The IoT aims to do for information what electricity did for energy.” “The computerisation of everything is a big topic, and one that will take decades to play out. The result will be a slow-burning revolution of quantifiability in which knowledge that used to be fuzzy or incomplete or even non-existent becomes increasingly precise. That will give rise to what sports coaches call “marginal gains”. A 10% decrease in costs or a 15% cut in energy use are individually unexciting. Put enough of them together, though, and they will amount to a revolution in productivity…” |
| “Augmented Data Science: Towards Industrialization and Democratization of Data Science”, by Uzunalioglu et al from Nokia Bell Labs | Surprise If deployed at scale, this technique could substantially speed the deployment and implementation of data science methods. “Conversion of raw data into insights and knowledge requires substantial amounts of effort from data scientists. Despite breathtaking advances in Machine Learning (ML) and Artificial Intelligence (AI), data scientists still spend a majority of their effort in understanding and then preparing the raw data for ML/AI. The effort is often manual and ad hoc, and requires some level of domain knowledge. The complexity of the effort increases dramatically when data diversity, both in form and context, increases. “We introduce our solution, Augmented Data Science (ADS), towards addressing this “human bottleneck” in creating value from diverse datasets. ADS is a data-driven approach and relies on statistics and ML to extract insights from any data set in a domain-agnostic way to facilitate the data science process.” |
| “Google Claims to Have Reached Quantum Supremacy”, Financial Times, 20Sep19 | Surprise “Google claims to have built the first quantum computer that can carry out calculations beyond the ability of today’s most powerful supercomputers, a landmark moment that has been hotly anticipated by researchers. “A paper by Google’s researchers seen by the FT, that was briefly posted earlier this week on a Nasa website before being removed, claimed that their processor was able to perform a calculation in three minutes and 20 seconds that would take today’s most advanced classical computer, known as Summit, approximately 10,000 years…” “The researchers said this meant the “quantum supremacy”, when quantum computers carry out calculations that had previously been impossible, had been achieved…. “The Google researchers called it ‘a milestone towards full-scale quantum computing’. They also predicted that the power of quantum machines would expand at a “double exponential rate”, compared to the exponential rate of Moore’s Law, which has driven advances in silicon chips in the first era of computing.” See also, “The Next Decade in Quantum Computing – and How to Play”, by Gerbert and Ruess from BCG, and, predictably, “Rivals rubbish Google’s claim of quantum supremacy” by Richard Waters (FT 23Sep19) |
| “Superhuman AI for Multiplayer Poker” by Brown and Sandholm in Science | Surprise The difficulty of the challenge met by Pluribus shows how AI technology can now be applied to situations involving complex strategic interactions between multiple parties. “The past two decades have witnessed rapid progress in the ability of AI systems to play increasingly complex forms of poker. However, all prior breakthroughs have been limited to settings involving only two players. Developing a superhuman AI for multiplayer poker was the widely-recognized main remaining milestone.” This paper describes, “Pluribus, an AI capable of defeating elite human professionals in six-player no-limit Texas hold’em poker, the most commonly played poker format in the world...” “Multiplayer games present fundamental additional issues beyond those in two-player games, and multiplayer poker is a recognized AI milestone… “The core of Pluribus’s strategy was computed via self play [i.e., the use of generative adversarial networks, or GANS], in which the AI plays against copies of itself, without any data of human or prior AI play used as input. The AI starts from scratch by playing randomly, and gradually improves as it determines which actions, and which probability distribution over those actions, lead to better outcomes against earlier versions of its strategy…” “As Jonathan Russo noted in The Observer, Texas hold’em is the epitome of multi-player strategic thinking, cue analysis, advanced future predictability and the most powerful, yet unquantifiable, skill of all, bluffing…The shocking fact that Pluribus out-bluffed the world’s top five players and won a big pot of money, means AI has reached a new critical level, because bluffing is one of the traits that enables us to succeed or fail by processing, and then utilizing, what we have learned in the past about the behaviors of others and thus affect the future to our advantage…. “The race to build better bluffing programs will be brutal. If a machine can out-bluff human traders or analysts, the foundation of the financial industry will be undermined.” |
| “Are You Developing Skills that Won’t Be Automated?” by Stephen Kosslyn in HBR 25Sep19 | This is a thoughtful article that addresses a critical question more and more people are asking themselves. “After reflecting on characteristics of numerous jobs and professions, two non-routine kinds of work seem to me to be particularly common, and difficult to automate: “First, emotion. Emotion plays an important role in human communication…It is critically involved in virtually all forms of nonverbal communication and in empathy. But more than that, it is also plays a role in helping us to prioritize what we do, for example helping us decide what needs to be attended to right now as opposed to later in the evening… “Emotion is not only complex and nuanced, it also interacts with many of our decision processes. The functioning of emotion has proven challenging to understand scientifically (although there has been progress), and is difficult to build into an automated system...” “Second, context. Humans can easily take context into account when making decisions or having interactions with others. Context is particularly interesting because it is open ended— for instance, every time there’s a news story, it changes the context (large or small) in which we operate. Moreover, changes in context (e.g., the election of a maverick President) can change not just how factors interact with each other, but can introduce new factors and reconfigure the organization of factors in fundamental ways. This is a problem for machine learning, which operates on data sets that by definition were created previously, in a different context. Thus, taking context into account is a challenge for automation… “Our ability to manage and utilize emotion and to take into account the effects of context are key ingredients of critical thinking, creative problem solving, effective communication, adaptive learning, and good judgment. It has proven very difficult to program machines to emulate such human knowledge and skills, and it is not clear when (or whether) today’s fledgling efforts to do so will bear fruit.” |
| “RCP Poll: K-12 Education Falls Short, and Hope for Gains Lags” on Real Clear Politics | K-12 education is a “social technology” whose improve performance (or not) will be a key driver of future labor productivity improvement. “One of a few areas that Democrats and Republicans can agree on these days are their views related to the state of education in the United States. It’s not good. Fifty-one percent of Republicans and 55% of Democrats rate American education as ‘only fair’ or ‘poor’”… Only 13% of respondents believe that in 20 years, the American public school system will be a model for excellence around the world. If the system can’t be changed, what are the chances it could be displaced by a new business model? AEI’s Rick Hess highlighted a hint of what might be possible in the future in a recent Education Week interview with Dan Ayoub, the the general manager of mixed reality, artificial intelligence, and STEM education for Microsoft. Intriguingly, before his current role Ayoub spent 20 years in the games industry, leading the development of the wildly popular game Halo. As Hess noted, “it often seems like game designers have figured out some things about engaging youths that have yet to show up in educational software. Ayoub’s reply was intriguing: “I think there’s a lot of what games do well that make sense in the classroom. Like making the student the center of the experience, gradually giving skills, and building on them. I think games are also great at teaching grit, resilience, and the understanding that failure is a part of success. Games are also increasingly social in nature, which is really interesting to think about in educational scenarios…” However, experience shows that simply adding advanced technology to a traditional business process never fully realizes the technology’s potential benefits. For that, you need to at minimum change the process, and often change the underlying business model. Unfortunately, both seem a long way off, at least in American K-12 education. |
| | |
| | |
| | |
| | |
| | |
| | |
| | |
| New Economic Information: Indicators and Surprises | Why Is This Information Valuable? |
| “The Behavioral Foundations of New Economic Thinking, by Sanjit Dhami & Eric Beinhocker | This paper is an outstanding review of this critical new direction in economics. |
| “Growth is taking a dangerous downward turn”, posted on September 19, 2019 on the OECD website by Laurence Boone, OECD Chief Economist | “The events of the last 18 months are not just a passing trend. The proliferation of tariffs and subsidies and the increasing unpredictability of trade policies have destroyed growth in international trade, triggering a sharp slowdown in industrial output and investments. When companies do not know what tomorrow will bring, they exercise their “wait-and-see option”. Given that an investment is a long-term commitment, they are waiting for this insidious trade war to settle down in order to know where to invest. However, when temporary uncertainty is recurrent and rooted, large amounts of investments are withheld, thereby affecting not just present day demand but also tomorrow’s growth potential and employment… “The investment gap created by the current situation will have a long-term and structural impact on growth, all the more so as it will take time to clarify the new trade policy environment…There is a danger of growth being bogged down for a long time.” |
| “The repo markets mystery reminds us that we are flying blind”, by the FT’s Gillian Tett | Surprise “The development that is sowing shock and confusion is related to the normally arcane matter of financial plumbing. At the start of the week, overnight borrowing rates in the repurchase or repo market, where traders do short-term deals to swap Treasuries for cash, suddenly rose to 10 per cent, up from their normal levels of 2-2.5 per cent…the last time we experienced this scale of gyrations in repo rates was the 2008 financial crisis… “The fact that a “temporary” cash squeeze created so much drama shows that neither the Fed nor investors completely understand how the cogs of the modern financial machine mesh.” |
| “Assessing Economic Conditions and Risks to Financial Stability”, by Eric S. Rosengren President & Chief Executive Officer Federal Reserve Bank of Boston | Surprise Without mentioning WeWork by name, in this speech Rosengren highlighted that maturity mismatch is no less dangerous in commercial real estate as it is in commercial banking. “Evolving market models, along with low interest rates, are creating a new type of potential financial stability risk in commercial real estate. One such market model is the development of co-working spaces in many major urban office markets…What makes this form of development a potential financial stability risk is two-fold. “First, co-working companies – which enter into long-term leases with the property owners – have tended to re-lease to smaller-sized and less mature companies on a shorter-term basis. This segment of the economy is likely to be particularly susceptible to an economic downturn, potentially resulting in office vacancies rising more quickly than they have historically. Thus, in a downturn the co-working company would be exposed to the loss of tenant income, which puts both them and the property owner at risk if they cannot make lease" payments to the owner of the building…" “A second reason for concern is that some companies may utilize bankruptcy-remote special purpose entities, or SPEs, for leases. This structure may allow the co-working company to potentially walk away from unprofitable lease arrangements in an economic downturn without the property owner having recourse to the ultimate parent, the co-working company. Simply put, I am concerned that commercial real estate losses will be larger in the next downturn because of this growing feature of the real estate market, which could ultimately make runs and vacancies more likely due to this new leasing model…” |
| “Long-Term Firm Growth: An Empirical Analysis of US Manufacturers 1959-2015”, by Dosi et al | Surprise “Firm growth is an essential feature of market economies, shaping together macroeconomic performance and the evolution of industry structures. As a potential indicator of organizational fi tness within a competitive environment, firm growth is also a central concern to both the practice and theory of business strategy.” “Despite both its theoretical and practical importance, though, growth remains a poorly understood property of fi rms. While previous studies have documented the highly skewed nature of rm growth rates, we know far less about the persistence of growth rates over long-periods of time…” The authors find “that growth rate persistence is there and may be even substantial for some fi rms, but it is rare.” They also find “circumstantial but widespread evidence that heterogeneity across firms correlates with industry dynamism…High growth industries are fueled by underlying industrial dynamics involving highly heterogeneous firms.” This is an important finding, and supports the hypothesis that increasing concentration and declining competition in many industries has been an important cause in the productivity slowdown. |
| “Investment Update: How Do Public Plans Value Their Assets?” by Aubry and Wandrei, Center for Retirement Research at Boston College | The funded status of public defined benefit pension plans has become a critical risk in countries around the world. Funded ratios (the value of plan assets to the present value of future plan payment liabilities to pension beneficiaries) have been declining (with the difference often being termed “pension debt”). The authors note that, “since higher returns reduce the burden of contributions (on plan sponsors, participants and, ultimately, taxpayers), achieving adequate returns is critical…” Unfortunately, the manner in which plans have pursued these returns may have led to an overly rosy view of their funded ratios. “Since 2001, in the US plans have incrementally reduced their assumed return from 8.0 percent to 7.2 percent. But, the average annualized return for public plans from 2001-2018 has been only 5.9 percent. Virtually all plans underperformed their assumed return over the period, but some fared much worse than others… “Starting in 2017, the Governmental Accounting Standards Board (GASB) has required public plans to disclose how the value of their investments is determined. The new standard – GASB 72 – uses the same basic framework as the Financial Accounting Standards Board (FASB), which provides guidance for private sector accounting… “Both FASB and GASB use the same fair value hierarchy for disclosure purposes: Level 1: Assets with an immediately known, and quoted, market value of redemption (e.g., stocks and Treasury securities). Level 2: Assets without known quoted prices where fair value is modeled using observed, direct or indirect, market values (e.g., corporate and municipal bonds).Level 3: Assets where fair value is determined using unobservable assumptions (e.g., real estate appraisals)…” The authors’ analysis finds that nearly a quarter of plan assets are valued at Level 3. They conclude that, “since valuation of Level 3 assets is the most subjective of the three levels, this finding suggests that the reported values for a significant portion of plan assets could vary more from the value that plans would receive if they were to liquidate their holdings.” |
| Global Debt Surges to Highest Level in Peacetime, FT 25Sep19 | “The level of government debt around the world has ballooned since the financial crisis, reaching levels never seen before during peacetime…the world’s major economies have debts on average of more than 70 per cent of GDP, the highest level of the past 150 years except for a spike around the second world war — raising profound questions about the sustainability of the global debt pile... “Unlike earlier eras, when governments typically ran surpluses during peacetime, the pressures of modern democracy and welfare systems have made persistent deficits the norm in many countries.” What this article leaves out is the critical point that this has occurred at the same time as a range of demand and supply side constraints on faster economic growth have appeared in many countries. To avoid an explosive debt trap (leading to some form of Minsky moment), it is imperative that interest rates on this huge debt burden be kept at or below the economy’s constrained rate of growth. |
| The History and Future of Debt, by Reid et al from DB Research | Surprise This thought-provoking analysis should be combined with our forecast of what lies ahead and the ones by Ray Dalio from Bridgewater. “Common wisdom suggests that the prudent upper threshold for government debt/GDP is in the range of 70-90% for high-income countries, 50-70% for euro area countries and 30-50% for the EM complex. Evidence has suggested that growth slows past these thresholds and thus risks creating an unsustainable and negative debt/GDP cycle. Today many countries are above these levels, with the globe seeing the highest peacetime debt in history, and yet until recently hardly a week went by without fresh record lows in bond yields…” “Do we have to rethink our view on debt sustainability or is this a big bubble? Much depends on the future interaction between governments and central banks. In a world of stubbornly low growth and low inflation, and with populist governments increasingly looking at reversing prior fiscal consolidation/ austerity, eventually the temptation to use negative/ultra-low rates to borrow to spend will prove too tempting…” “Ironically, the biggest risk to a plan to borrow at low/negative rates to facilitate fiscal spending might be that it is actually successful. If inflation is generated (as it should be with such policies), then the bonds that are [not held by central banks] may be much more vulnerable than they are today, when markets don't believe inflation is possible… “The key to a sustainable debt environment over the next decade(s) will be about keeping nominal yields well below nominal GDP. As such, financial repression and aggressive central bank purchases might still be in the early stages…So higher debt, higher inflation, higher nominal GDP, higher yields, and higher central bank balance sheets.” |
| “Toward Fair and Sustainable Capitalism”, by Leo Strine, Chief Justice, Delaware Supreme Court | Surprise Along with the Business Roundtable’s recent pronouncement that companies should balance the increasing shareholder value with the pursuit of other goals, Strine’s law review article marks an important turning point in the debate about the relationship between financialized capitalism and the viability of democracy in the face of worsening inequality. “The incentive system for the governance of American corporations has failed in recent decades to adequately encourage long-term investment, sustainable business practices, and most importantly, fair gainsharing between shareholders and workers. That should not be so. This state of affairs exists in no small part because we have made public companies more and more responsive to the desires of the stock market, as represented by institutional investors with a demand for immediate returns. This has resulted in declines in gainsharing of corporate profits with workers, a large increase in stock buybacks, skyrocketing CEO pay, and growing inequality… “When looking for the causes of growing inequality and a corporate governance system that does not work for all, the usual subjects of criticism are the CEOs and boards of large companies, but very little is said about those who wield over 75% of shareholder voting power: institutional investors. Most stock today is owned not by mom-and-pop investors who directly hold stock in individual companies, but by institutional investors who control human investors’ capital… “Corporations will not give more thoughtful consideration to their employees and social responsibility—that is, our corporate governance system and economy will not change—unless the institutional investors who elect corporate boards also support doing so.” |
| “Has the dollar lost ground as the dominant international currency?” by Eswar Prasad, from Brookings and “Are Investors Ready for the ‘Doomsday Dollar’ Scenario?” by Rana Foroohar in the 29Sep19 Financial Times | A sharp fall in confidence in the US dollar and declines in its exchange rate versus other currencies features prominently in Ray Dalio’s scenario for a sharp rise in US inflation in the future. It is therefore important to continue monitoring early warning indicators that Dalio’s forecast is becoming reality. Prasad concludes that, “the euro has stumbled, the renminbi has stalled, and dollar supremacy remains unchallenged. In contrast, Foroohar notes that, “shifts in the global reserve system take time…if US companies are perceived as no longer being the most competitive in the world, their share price will fall, as will the dollar. Are we at that point? Not yet. But given the erosion of America’s skills base, its ailing infrastructure and lack of research investment, I wonder if we might be soon…” |
| The curious case of copper prices | In “Why is nobody buying the copper needed for a greener world?”, the FT’s always interesting John Dizard notes that, “Wind and solar [power generation] require three to fifteen times as much copper per unit of output as fossil fuel generation. This is after decades of technological development and efficiency improvements… Paul Gait and his team of metals mining analysts at Bernstein in London have come up with estimates of the copper price levels needed to finance new mines. “We believe copper needs to be priced at $8,800/tonne, or a 40 per cent uplift, to meet the government-agreed 2030 targets for decarbonisation…” Given this, current copper prices of around $5,500/MT must reflect a very substantial fall in underlying global economic demand that has not yet been fully recognized by investors in other asset classes. |
| Following Iran’s attack on Saudi oil facilities, oil prices only briefly increased | As Sherlock Holmes notes, sometimes it is the dog that doesn’t bark that provides the most important clue. It is very important to note that the reaction of oil prices was short-lived, due to increasing supply capacity outside of the Middle East, as well as market fears of a weakening economy and declining petroleum demand. On balance, we conclude that this makes a US and Saudi retaliatory strike against Iranian Republican Guard Corps assets more likely if another violent provocation occurs in response to the United States’ imposition of tighter sanctions on Iran. |
| New National Security Information: Indicators and Surprises | Why Is This Information Valuable? |
| “US Intelligence Needs Another Reinvention”, by Amy Zegart | Surprise Zegart is the author of an excellent analysis of the intelligence failures leading up to the 9/11 attacks (“Spying Blind: The CIA, the FBI, and the Origins of 9/11). Her conclusions are as applicable to the intelligence analysis challenges facing investors and corporations as they are to those facing nation states. She notes that “today’s threat landscape is vastly more complex than it was in 2001. Terrorists are one item on a long list of concerns, including escalating competition and conflict with Russia and China, rising nuclear risks in North Korea, Iran, India and Pakistan, roiling instability in the Middle East, and authoritarians on the march around the world. Supercharging all these threats are new technologies that are accelerating the spread of information on an enormous scale and making intelligence both far more important and challenging... “Now, as in the run-up to 9/11, early indicators of the coming world are evident, and the imperative for intelligence reform is clear…as in the 1990s, many in the intelligence community are sounding alarms and trying to make changes…But these efforts are nowhere near enough. What’s missing is a wholesale reimagining of intelligence for a new technological era... “In the past, intelligence advantage went to the side that collected better secrets, created better technical platforms (such as billion-dollar spy satellites), and recruited better analysts to outsmart the other side. In the future, intelligence will increasingly rely on open information collected by anyone, advanced code and platforms that can be accessed online for cheap or for free, and algorithms that can process huge amounts of data faster and better than humans.” “This is a whole new world. The U.S. intelligence community needs a serious strategic effort to identify how American intelligence agencies can gain and sustain the edge while safeguarding civil liberties in a radically different technological landscape.” |
| China celebrated 70 years of Communist Party rule | Surprise In conjunction with the 70th anniversary, a number of writers with long perspectives on the region analyzed China’s future prospects. In The National Interest, Thayer and Han argue that, “Xi Jinping will usher in a dark age for China.” They note that on the 70th anniversary, “Xi will convey China’s global strategy in veiled and honeyed terms. Under his leadership, the world has witnessed China rising beyond regional power into superpower status. He will continue to advance a new global governance framework that is benignly termed “the common destiny of mankind,” less benignly, Chinese domination…Xi’s predatory character and limitless ambition has made him far more reckless and repressive than his predecessors—only Mao is his equal. His megalomania and his weakness will compel him to overcompensate… [Xi] “is guiding China back to a nadir…China’s economy is worse off than it was at the dawn of his regime. China is also less secure due to the maladroit actions of his regime. The Chinese people are worse off as well…China’s economic, military, and political power will present an existential challenge to the free world and western civilization. It is unclear whether the world is ready to meet that challenge.” In “The China Dream: Never Closer, yet Never More Elusive”, RAND’s Timothy Heath notes that, “China's ascent as a manufacturing powerhouse upended and reconfigured the global economy. But the next 30 years may see its impact on the world reach new heights. In this third act of China's revitalization, Beijing faces the daunting challenge of improving its dominant position as a global leader, or risk sinking into stagnation…endurance may not be good enough in coming decades… To achieve its goals of national rejuvenation, China needs to become a true world power. But with its economy softening and its politics gridlocked, an increasingly besieged China seems less and less likely to realize all of its goals.” Writing in Foreign Affairs, Jiewi Ci argues that, “Without Democracy, China Will Rise No Farther.” He urges us to focus, “not on China’s recent political trajectory but on the dynamic of its society. There one clearly discerns the shape of what Alexis de Tocqueville called a democratic social state—an entity distinct from a democratic political regime, but arguably as important. “A democratic social state is one in which a historically fixed hierarchy has given way to formal equality of status and opportunity. Four decades of reform since the late 1970s have achieved something close to this in China…The importance of the profound democratization of Chinese society cannot be overstated…Chinese authorities are already paying a gargantuan material and psychological price just to keep the country stable and governable. That the present leadership encounters little resistance to its increased repression and blunt propaganda may indicate that it occupies a position of strength... “Equally, its willingness to use repression, even at the risk of encountering resistance, is a clear sign of its heightened anxiety. For an undemocratic political regime to manage a democratic society without compromise is an unnervingly tall order… “Some scholars argue that there is little reason to fear for the legitimacy of a ruling regime under such circumstances. They claim that with economic prowess and national rejuvenation, an atrophying communist system can sustain its legitimacy even when it governs an ever more bourgeois, democratic society. They are mistaken. Performance by itself does not confer legitimacy on a regime, so much as it helps to make its relative absence matter less. Such is increasingly the case in China today… “How much longer can the CCP hold on without democratizing? The short answer is: only as long as the current leadership is in charge, at best. Xi Jinping is an extraordinary leader in that he effectively keeps in check contradictions that would otherwise produce irresistible momentum toward fundamental change or collapse. Xi is able to do this not merely because he possesses special personal attributes but because he belongs to the last generation of leaders who can draw legitimacy from the communist revolutionary legacy. That legacy is one both of doctrine and of exceptional determination to keep the CCP in power at all costs, including the kind of cost incurred in June 1989. “When Xi’s generation departs the political scene, the CCP will mark a watershed in its political evolution. Those who come after will be a different breed of leaders. They will not be able to maintain Xi’s level of control of the party, the military, the media, and the private sector. And what they will lack is exactly what will be necessary—what is now necessary—to keep the party united, the country stable, and democratizing forces at bay.” |
| The crisis in Hong Kong continued to intensify and deteriorate as protests entered their fourth month | Surprise The latest developments include a student being shot by police, attempts to ban demonstrators from wearing masks, and calls for the Hong Kong government to enact the colonial emergency law. Writing in the FT, Jamil Anderlini ominously concludes that, “Beijing will have its revenge on Hong Kong.” He notes that, “The Chinese phrase qiu hou suan zhang is literally translated as “to balance the books after the autumn harvest”. But in common parlance it means “to take revenge when the time is ripe”. “China’s leaders use the aphorism to discuss the problem of Hong Kong. With peaceful and violent protests still escalating, and the police and government struggling to control the situation, Chinese officials have mostly struck a conciliatory tone until now. But even if the demonstrations fizzle out immediately and the former British colony returns to normality, Beijing will settle its scores and “Asia’s world city” will never be the same again… The conclusion Beijing has drawn from the past four months of rage is the only one possible in an authoritarian — increasingly totalitarian — system: they were far too soft last time around. When the moment is right, they must act ruthlessly to punish Hong Kong… “The protesters, steeped in Chinese history, are well aware of this impending retribution. It has given their movement a hard, nihilistic edge…” |
| China’s 70th anniversary military parade confirmed its focus weapons systems intended to create asymmetric advantage versus the United States | Specifically, the systems on display will help China to achieve two strategic goals. The first is deterring a nuclear conflict with the United States. The new DF-41 ICBM can carry 10 warheads plus decoys, and reach targets across the United States. Also displayed was a road mobile version of the older DF-31 ICBM, which would be hard for the US to target in a retaliatory strike. China’s second strategic goal is increasing its power and influence in the western Pacific, through a strategy called Anti-Access/Area-Denial (A2/AD) that is intended to make it far more difficult for US military assets to operate in the region. On display in Beijing were a new missile launched hypersonic (Mach 5 or faster) glide vehicle capable of carrying a conventional or nuclear warhead, and a new supersonic reconnaissance drone that will operate at very high altitudes. In essence, these two systems (along with existing DF-21 long-long range anti-ship missile and DF-26 intermediate range ICBM) will increase the speed and precision with which China can strike targets in Asia. Commenting on this display of new weaponry, the Economist noted that, “It is understandable, indeed inevitable, that a wealthier China would seek to become a great military power. What was not inevitable was that Mr Xi would embrace populist, nostalgic, red-flag waving nationalism, while glossing over the party’s terrible mistakes…By telling his people that Communist China has never taken a wrong turn, he is stoking an impatient, hair-trigger nationalism in which criticism from abroad equates to hostility…[Such] heavily armed, self-righteous nationalism can start wars.” |
| Recent polling by Pew Research has found a sharp increase in unfavorable views of China in many other countries | Surprise “Opinion of China across most of Western Europe is, on balance, negative. While 51% in Greece have a positive view of China, pluralities or majorities in Western European countries have an unfavorable view, ranging from 53% in Spain to 70% in Sweden. The share of people who evaluate China positively has also dropped since 2018 by double digits in nearly half of the Western European countries surveyed, including Sweden (down 17 percentage points), the Netherlands (-11 points) and the UK (-11). Only in Greece and Italy has opinion improved.” Between 2005 and 2019, the percent of people holding a negative view of China increased from 27% to 67% in Canada, and from 35% to 60% in the United States. “In both countries, this is the highest unfavorable opinion of China recorded in the Center’s polling history.” China also receives unfavorable marks from most of its neighbors in the Asia-Pacific region. In Japan, 85% say they have an unfavorable opinion of China – the most negative among all countries surveyed. More than half in South Korea (63%), Australia (57%) and the Philippines (54%) share this sentiment. Opinion of China has also fallen across the region over the course of Pew Research Center’s polling and is now hovering at or near historic lows in each of the countries surveyed. In Indonesia, the change over the past year has been particularly stark, falling 17 percentage points. |
| With its cruise missile and drone attack on critical Saudi oil facilities, Iran has significantly raised the stakes in its conflict with Saudi Arabia and the United States. | US Secretary of State Mike Pompeo characterized the attack as “an act of war.” On the other hand, the success of the attack highlighted the difficulty of defending against an attack by a swarm of relatively inexpensive drones (17) and cruise missiles (8). If human operator overload was at least partly to blame, this presents another argument for taking humans “out of the loop” and using AI to more fully automate integrated air defense systems. |
| | |
| | |
| | |
| | |
| | |
| | |
| | |
| | |
| New Health and Disease Information: Indicators and Surprises | Why Is This Information Valuable? |
| | |
| | |
| New Social Information: Indicators and Surprises | Why Is This Information Valuable? |
| “The American Working Man Still Isn’t Working”, by Jason Furman | Surprise This article makes a critical point. Many have wondered why the current low reported unemployment rate hasn’t led to higher wage gains and inflation. The answer is that the numerator only includes people still looking for work, not the historically very large number who have given up. This represents yet another hidden deflationary and politically explosive force that is at work in the economy. “The United States is in the midst of its longest-ever economic recovery…However, there is one important economic indicator that still hasn’t rebounded to pre-crisis levels: the employment rate among prime-age men—that is, men between the ages of 25 and 54. On the eve of the recession at the end of 2007, 12.8 percent of prime-age men didn’t have jobs. Now that figure stands at 13.7 percent. The headline unemployment rate for this group has fallen—from four percent to 3.1 percent—but only because many of these men have simply given up looking for work. When they stopped actively searching for jobs, they no longer qualified as “unemployed.” Instead, the government labeled them as “out of the labor force,” a designation that lowers the unemployment rate but is no less harmful to the economy.” |
| “STEM Careers and the Changing Skill Requirements of Work”, by Deming and Noray | Surprise “Science, Technology, Engineering, and Math (STEM) jobs are a key contributor to economic growth and national competitiveness. Yet STEM workers are perceived to be in short supply. This paper shows that the “STEM shortage” phenomenon is explained by technological change, which introduces new job skills and makes old ones obsolete.” The authors “find that the initially high economic return [wage premium] to applied STEM degrees declines by more than 50 percent in the first decade of working life…This pattern holds for “applied” STEM majors such as engineering and computer science, but not for “pure” STEM majors such as biology, chemistry, physics and mathematics.” |
| “America has two economies—and they’re diverging fast”, by Muro and Whiton from Brookings and “The Future of Work in America”, by McKinsey | Surprise “Not only are red and blue America experiencing two different economies, but those economies are diverging fast. In fact, radical change is transforming the two parties’ economies in real time…These shifts are massively altering the two parties’ economic identities…With their output surging as a result of the big-city tilt of the decade’s “winner-take most” economy, Democratic districts have seen their median household income soar in a decade—from $54,000 in 2008 to $61,000 in 2018. “By contrast, the income level in Republican districts began slightly higher in 2008, but then declined from $55,000 to $53,000…Today, therefore, neither party represents the same types of places it did just 10 years ago. As such, the Democratic Party is now anchored in the nation’s booming, but highly unequal, metro areas, while the GOP relies on aging and economically stagnant manufacturing-reliant rural and exurban communities… “Just since 2008, Democratic districts’ share of professional and digital services employment surged from 63.7% to 71.1%, GOP districts’ professional and digital employment fell from 36.3% to 28.9% of the total in just 10 years.. There are few signs of any coming reversal of the decade’s divergence… “For at least the foreseeable future, therefore, the nation seems destined to struggle with extreme economic, territorial, and political divides in which the two parties talk almost entirely past each other on the most important economic and social issues because they represent starkly separate and diverging worlds. Not only do the two parties adhere to very different views, but they inhabit increasingly different economies and environments.” McKinsey’s analysis reflects this same conclusion, but at a more micro (city) level. They find that net job growth through 2030 will likely be concentrated in urban areas, while much of the country may see little employment growth or even lose jobs. |
| “U.S. obesity as delayed effect of excess sugar”, by Bentley et al | Surprise This could portend a natural decline in rates of obesity and the cost pressure its associated medical problems put on healthcare systems. “In the last century, U.S. diets were transformed, including the addition of sugars to industrially-processed foods. While excess sugar has often been implicated in the dramatic increase in U.S. adult obesity over the past 30 years, an unexplained question is why the increase in obesity took place many years after the increases in U.S. sugar consumption. To address this, here we explain adult obesity increase as the cumulative effect of increased sugar calories consumed over time. In our model, which uses annual data on U.S. sugar consumption as the input variable, each age cohort inherits the obesity rate in the previous year plus a simple function of the mean excess sugar consumed in the current year… “This simple model replicates three aspects of the data: (a) the delayed timing and magnitude of the increase in average U.S. adult obesity (from about 15% in 1970 to almost 40% by 2015); (b) the increase of obesity rates by age group (reaching 47% obesity by age 50) for the year 2015 in a well-documented U.S. state; and (c) the pre-adult increase of obesity rates by several percent from 1988 to the mid-2000s, and subsequent modest decline in obesity rates among younger children since the mid-2000s. Under this model, the sharp rise in adult obesity after 1990 reflects the delayed effects of added sugar calories consumed among children of the 1970s and 1980s.” |
| In the United States, the outcome of the lawsuit alleging discrimination against Asians in the Harvard admissions process, and latest developments in the Operation Varsity Blues college admissions bribery scandal seem likely to further anger and already frustrated middle class | While a judge found that Harvard did not discriminate (a finding that will certainly be appealed) evidence presented in the trial presented a damning picture of the admissions process at an elite American university. As described in a new research paper (“Legacy and Athlete Preferences at Harvard”, by Arcidiacono et al), “Using publicly released reports, we examine the preferences Harvard gives for recruited athletes, legacies, those on the dean’s interest list, and children of faculty and staff (ALDCs). Among white admits, over 43% are ALDC. Among admits who are African American, Asian American, and Hispanic, the share is less than 16% each. Our model of admissions shows that roughly three quarters of white ALDC admits would have been rejected if they had been treated as white non-ALDCs.” “Removing preferences for athletes and legacies would significantly alter the racial distribution of admitted students, with the share of white admits falling and all other groups rising or remaining unchanged.” In the Varsity Blues case, defendants who have pleaded guilty have thus far received relatively light sentences. More interesting will be the trials of defendants who are contesting the charges. For example, one has obtained damning internal emails from the University of Southern California showing how affluent parents were targeted in something that looks a lot like a “pay to play” admissions scheme. This defendant plans to claim he is not guilty, because he was only playing the established admissions game at USC. |
| “The Kids Aren’t All Right”, by Christine Rosen (in Commentary) and “Elite Failure Has Brought Americans to the Edge of an Existential Crisis”, by Derek Thompson (in The Atlantic). | Both of these articles (in journals from either side of the political spectrum) expressed surprise at three findings in the most recent Wall Street Journal/NBC News poll. In 1998, 70% said patriotism was an important value to them; in August 2019, this had dropped to 61%. In 1998, 62% said religion was an important value; by 2019 this had dropped to 48%. And in 1998, 59% said having children was an important value; by 2019 only 43% did. In contrast, in 1998, 31% said money was an important value; in 2019 that had risen to 41%. And in 1998, 47% said community involvement was important; by 2019 that had risen to 62%. Rosen noted that, “The generational differences with regard to these values are especially stark. According to the survey, while 80 percent of Americans age 55 and older say patriotism is important, only 42 percent of Americans ages 18– 38 say the same. “Two-thirds of the older group cited religion as very important,” the pollsters report, “compared with fewer than one-third of the younger group.” The greatest generational divide on values exists among Democrats: “Democrats over age 50 were more in line with those of younger Republicans than with younger members of their own party,” the survey found… |
| | |
| | |
| | |
| | |
| | |
| | |
| | |
| New Political Information: Indicators and Surprises | Why Is This Information Valuable? |
| “Why rigged capitalism is damaging liberal democracy”, by Martin Wolf, FT 17Sep19 See also, “Yes, capitalism is broken. To recover, liberals must eat humble pie”, by Richard Reeves, from Brookings | The Financial Times economics columnist offers a concise analysis of the root causes of declining productivity, rising inequality, and increasingly frequent financial shocks, and the threat they pose to the legitimacy of liberal democracy, institutions, and elites. He concludes that the rise of rentier capitalism and financialization are critical root causes of the challenges we face today. Unfortunately, neither will be easy to reverse. |
| “Why rightwing populism has radicalized”, by Simon Kuper, Financial Times 11Sep19 and “Is Populism Here to Stay?” by Gillian Tett FT 12Sep19 | Surprise Kuper begins by defining his terms: “Conservatives are the traditional centre-right. Populists (whether left or right) claim to represent, in Mudde’s definition, “the pure people” against “the corrupt elite”… Meanwhile, the generally smaller “extreme right” is violent and anti-democratic — think of neo-Nazis and other street thugs.” Kuper goes on to claim that, “often, the far right takes power as a conservative-populist coalition, cheered on by the extreme right. The centre-right lends the coalition voters, respectability and the electoral magic word “conservative”. But over time, the conservatives usually get sidelined as the government radicalises. Why?” “Populism is majoritarian: once the people have spoken in an election or referendum, their will must be done, fast…Populist topics such as immigration, Islamophobia and anti-elitism come to dominate political debate, and so seem urgently in need of solving…Rightwing populist messages usually prove more popular than conservative ones…Populism in power emboldens the previously tiny, marginal extreme right…Taboos crumble as populist language becomes normalised…” Tett calls our attention to “a new Ipsos survey. It suggests that 64 per cent of people around the world aged 16-74 currently feel a need for “a strong leader to take their country back from the rich and powerful”, while 49 per cent feel that “to fix the country we need a strong leader willing to break the rules” and some 62 per cent “feel that experts don’t understand the lives of people like them”… “About two-thirds think the economy is rigged in favour of the rich and powerful, and that the system is broken. The good news is that these numbers have not dramatically worsened since 2016. The bad news is that they are still high.” |
| “American Renewal: The Real Conflict Is Not Racial Or Sexual, It's Between The Ascendant Rich Elites And The Rest Of Us”, by Joel Kotkin | Kotkin calls attention to the deeper drivers of rising frustration and conflict in many Western nations. “Despite the media’s obsession on gender, race and sexual orientation, the real and determining divide in America and other advanced countries lies in the growing conflict between the ascendant upper class and the vast, and increasingly embattled, middle and working classes…These dynamics are unsettling our politics to the core. Both the gentry left, funded largely by Wall Street and Silicon Valley, and the libertarian right, have been slow to recognize that they are, in de Tocqueville’s term, “sitting on a volcano ready to explode.” The middle class everywhere in the world, notes a recent OECD report , is under assault, and shrinking in most places while prospects for upward mobility for the working class also declines.” |
| The implications of impeachment: the next US President may be a woman – but one named Nikki, not Elizabeth. | Surprise The “Ukrainian Call Scandal” was the final straw that finally convinced US House Democrats to move forward with the impeachment of Donald Trump. That a bill of impeachment will be approved is almost certain. Whether the US Senate will can muster the 67 votes needed to convict (which would force Trump from office) is closer to a toss-up, though one that the subsequent abandonment of the Kurds will likely make it much easier. That leads to another critical question: If Mike Pence becomes president, will someone (say, Nikki Haley or Mitt Romney) challenge him in a Republican primary? Haley might well be a much more centrist and formidable candidate than the current crop of Democratic candidates are expecting to face. This raises an interesting question for Congressional Democrats – how long will they try to drag out the articles of impeachment hearings in the House, and the subsequent trial by the Senate? Our bet is that they will likely go for longer, in order to limit the ability of Republican challengers to organize and thus make it more likely their candidate will face Mike Pence in 2020. However, that will also give Trump more time to counterattack, which will almost certainly increase political uncertainty. |
| “To Regain Policy Competence: The Software of Public Problem Solving”, by Philip Zelikow | Surprise This is an extremely insightful essay on one of the least understood root causes of the current crisis of political legitimacy, not just in the US, but in other countries as well. Zelikow notes, that, “American policymaking has declined over the past several decades, but it is something that can be regained. It is not ephemeral or lost to the mists of time. The skills needed to tackle public problem-solving are specific and cultural — and they are teachable…” “Policymaking is a discipline, a craft, and a profession. Policymakers apply specialized knowledge — about other countries, politics, diplomacy, conflict, economics, public health, and more — to the practical solution of public problems. Effective policymaking is difficult. The “hardware” of policymaking — the tools and structures of government that frame the possibilities for useful work — are obviously important.” “Less obvious is that policy performance in practice often rests more on the “software” of public problem-solving: the way people size up problems, design actions, and implement policy. In other words, the quality of the policymaking.” |
| | |
| | |
| | |
| | |
| | |
| New Financial Markets and Investor Behavior: Indicators and Surprises | Why Is This Information Valuable? |
| “A simulation of the insurance industry: The problem of risk model homogeneity” by Heinrich et al | The authors “develop an agent-based simulation of the catastrophe insurance and reinsurance industry and use it to study the problem of risk model homogeneity.” Their “model simulates the balance sheets of insurance firms, who collect premiums from clients in return for ensuring them against intermittent, heavy-tailed risks. Firms manage their capital and pay dividends to their investors, and use either reinsurance contracts or cat bonds to hedge their tail risk…” “Under Solvency II, insurance companies are required to use only certified risk models. This has led to a situation in which only a few firms provide risk models, creating a systemic fragility to the errors in these models… using too few models increases the risk of nonpayment and default while lowering profits for the industry as a whole. The presence of the reinsurance industry ameliorates the problem but does not remove it. These results suggest that it would be valuable for regulators to incentivize model diversity.” |
| “Private Equity Secondary Deals Soar”, FT 15Sep19 | Highly leveraged private equity deals are often said to be “priced for perfection.” This is exponentially more so in the case of secondary sales, where one PE fund sells a portfolio company to another PE fund. As such, I have always regarded rising secondary PE sales as a leading indicator of an approaching market top. As the FT notes, “the game of pass the parcel in the private equity industry is booming with secondary market activity — the buying and selling of assets before the end of a PE fund’s agreed term — running at record levels. “Deals worth $42.1bn were completed in the first half of 2019 in the private equity secondary market, up by a third on the same period last year...This is a conservative estimate because the activities of sovereign wealth funds are excluded and it is difficult to capture all the deals done by the many opportunistic buyers that dip into the market…Competition is expected to intensify because there are about 43 secondary vehicles focused on private equity fundraising with a combined target of $72bn, according to Prequin, the data provider.” |
| “Leveraged Bank Loan versus High Yield Bond Mutual Funds”, by Ayelen Banegas and Jessica Goldenring from the Board of Governors of the Federal Reserve | Surprise The authors describe a liquidity train wreck waiting to happen, with 60 percent of illiquid high yield bonds and loans held by retail funds that promise daily liquidity to their investors. “Since the financial crisis, the markets for Bank Loan (BL) and High Yield Bond (HYB) mutual funds (MFs) have grown significantly, with assets under management increasing from $19 billion and $75 billion to close to $117 billion and $225 billion, respectively, as of December 2018…in terms of portfolio allocations, HYB and BL MFs hold around 60 percent of B, BB and BBB-rated assets…Net flows as a share of assets were larger and more volatile for BL MFs than for their HYB counterparts…” Finally, "HYB MFs significantly outperformed BL MFs since early 2000.” |
| “Family Offices Prepare for Market Downturn”, FT 23Sep19 | Historically, family offices, particularly in Europe, have been conservative investors whose portfolio shifts are often early indicators of future market turning points. “UBS, the Swiss bank, and Campden Wealth, a data provider, surveyed 360 family offices and found that 55 per cent expected the global economy to sink into a recession before the end of 2020…” “The 360 family offices generated an average return of 5.4 per cent over the 12 months ended May, weighed down by disappointing performances from their holdings of publicly traded equities in developed and emerging markets…Alternative investments, such as private equity, hedge funds and real estate, already account for about 40 per cent of the average family office portfolio, a significantly higher share than among public pension funds.” “Allocations to alternatives are set to increase further. A net 39 per cent of respondents said they anticipated a rise in direct private equity investments in 2020 and a net 28 per cent expected to increase their exposure via private equity funds. Real estate also remains an attractive proposition for family offices with a net 16 per cent aiming to raise direct property holdings in 2020… “The appeal of gold has also risen with a net 12 per cent expecting to increase their allocation to the precious metal next year.” “Hedge funds, however, have continued to struggle to win new admirers among family offices. Allocations to hedge funds have been reduced for the past five years, [as some see them as] “relatively high [cost] when compared to their performance.” |
| “Thomas Cook’s collapse shows perils of debt derivatives”, FT 26Sep19 | Surprise The recent Thomas Cook bankruptcy, where credit derivative holders forced the company into bankruptcy instead of a restructuring, are the most recent example of why Warren Buffet memorably called credit them financial weapons of mass destruction. The more important lesson to be learned from the Cook saga, however, is that they are very likely to make debt problems and workouts triggered by the next economic downturn even more difficult and painful – and in the process, reinforce hostile popular and political animus towards financial elites. |
| “Equity Premium Puzzle or Faulty Economic Modelling?” by Shirvania et al | Surprise This excellent paper is for everyone who at some point in the past 40 years has thought that their cost of equity estimate didn’t seem quite right. The authors “revisit the equity premium puzzle reported in 1985 by Mehra and Prescott.” They “ show that the large equity premium that they report can be explained by choosing a more appropriate distribution for the return data, [and] demonstrate that the high-risk aversion value observed by Mehra and Prescott may be attributable to the problem of fitting a proper distribution to the historical returns and partly caused by poorly fitting the tail of the return distribution.” They “describe a new distribution that better fits the return distribution and when used to describe historical returns can explain the large equity risk premium and thereby explains the puzzle.” |
| “The Performance of Exchange-Traded Funds” by Blitz and Vidojevic | At The Index Investor, we have long distinguished between funds that track narrowly defined indices, and ones that track broad asset class indices. The former are something akin to wolves in sheeps’ clothing, as they give one the illusion of being a passive investor while the product itself is actually a less expensive version of an active strategy. This new paper provides further evidence this is indeed the case. The authors observe that, “exchange-traded funds (ETFs) are commonly regarded as an efficient, low-cost alternative to actively managed mutual funds, yet their perceived superiority is largely anecdotal. [They] evaluate the performance of a comprehensive, survivorship bias-free sample of US equity ETFs following the same approach that has been commonly used to evaluate the performance of actively managed mutual funds.” They ”find that ETFs have collectively lagged the market by an amount that appears similar to the widely documented underperformance of active mutual funds” and conclude that “from a pure performance perspective, the allure of ETFs finds little support in the data.” |
| | |
Feature Article: Macro and Asset Allocation Implications of Environmental Trends and Uncertainties
Context
We first wrote about the potential relationships between the evolution of environmental uncertainties and future asset class valuations in 2006 (“Climate Change and Asset Allocation”), shortly after the Stern Review (“The Economics of Climate Change”) was published by the UK Treasury. Thirteen years later, this column will review key macro trends and uncertainties related to the environment, alternative scenarios their interactions could produce, and the implications for asset class valuation and portfolio allocation.
Before delving in, it is critical that we place environmental issues in their proper, and much broader context.
In “The Natural Science Underlying Big History”, the astrophysicist Eric Chaisson concludes that, “A wealth of observational data supports the hypothesis that increasingly complex systems evolve unceasingly, uncaringly, and unpredictably from big bang to humankind. These are global history greatly extended, big history with a scientific basis, and natural history broadly portrayed across ∼14 billion years of time…”
“Quantitative models and experimental tests imply that a remarkable simplicity underlies the emergence and growth of complexity for a wide spectrum of known and diverse systems. Energy is a principal facilitator of the rising complexity of ordered systems within the expanding Universe; energy flows are as central to life and society as they are to stars and galaxies…Rising energy expenditure per capita has been a hallmark in the origin, development, and evolution of humankind…In particular, energy rate density [energy flow per unit of time per unit of mass or area] is an objective metric suitable to gauge relative degrees of complexity among a hierarchy of widely assorted physical, biological, and cultural systems observed throughout the material Universe. Operationally, those systems capable of utilizing optimum amounts of energy tend to survive, and those that cannot are non-randomly eliminated…”
In sum, environmental issues are inextricably bound up in the larger context of energy issues, which are deeply embedded in fundamental technological, economic, national security, social, and political dynamics.
Starting Points
According to NASA, crude global temperature records have only been available since around 1880. And since even today temperature sensors are not evenly distributed around the globe, even today’s global average temperature data remain somewhat noisy estimates. Yet even taking that into account, the evidence indicates that average global temperature has been increasing, at an accelerating rate.
NASA estimates that between 1880 and 2018, average global temperature increased by 0.8 degrees Celsius, or 1.4 degrees Fahrenheit. Moreover, two thirds of this increase has occurred since 1975.
Two hypothesis have been suggested to explain this increase. The first is solar cycles, the most recent of which is coming to its end. It is speculated that the next cycle may be a multicycle minimum (e.g., with low sunspot activity), which, all else being equal, could reduce average global temperatures by 0.3 degrees Celsius.
While solar cycles clearly had an impact, their impact is not sufficient to fully account for the observed rise in average temperature. For example, examination of extremely old ice cores, and other paleohistory techniques, have demonstrated an association throughout the earth’s history of increases in atmospheric and ocean CO2 levels (e.g., due to volcanic activity) with increases in temperatures. However, the operation of the earth’s climate system is extremely complex, with multiple feedback loops and non-linearities at work. Put differently, modeling the world climate system is extremely challenging, and all conclusions contain a degree of uncertainty (which the International Panel on Climate Change – the IPCC – is now expressing systematically).
The inability of solar cycles to fully explain the observed temperature change, and the findings from studies of the earth’s history led to the second hypothesis, that human actions have also had a substantial impact. In particular, this hypothesis has strongly focused on the burning of fossil fuels as a major contributor to the significant increase in carbon dioxide (CO2) and other so-called “greenhouse gases” in the earth’s atmosphere. Specifically, from a pre-industrial age estimated level of 280 parts per million, atmospheric CO2 had reached 407 ppm by 2018. Again, this has been increasing at an accelerating rate, from about 1.0 ppm per year in 1969, to 2.0ppm by 2005, and 2.5ppm most recently. This has been caused not only by accelerating production of CO2 and other GHG emissions, but also a slowdown in the rate at which oceans absorb CO2 from the atmosphere (and in the process become more acidic).
This “anthropogenic” hypothesis has led to calls for restricting CO2 and other GHG emissions, largely by reducing the burning of fossil fuels to generate energy. Most recently, the IPCC has urged policymakers to limit the observed rise in temperature to 1.5 degrees Celsius above the pre-industrial level.
Critical Uncertainties
First, what are the most important potential macro impacts if GHG emissions and average global temperature levels continue to increase?
Published in 2018, “Global Warming of 1.5°C. An IPCC Special Report”, urges policymakers to take more aggressive actions to limit GHG emissions in order to keep the future rise in average global temperature to 1.5 degrees Celsius above the pre-industrial global baseline temperature of about 14c or 57f. The report notes a substantial increase in various risks when the temperature increase is 2 degrees Celsius instead of 1.5. These include:
Extreme heat days are 4.0c hotter rather than 3.0c hotter, and associated reductions in human morbidity and mortality from extreme heat;
Higher frequency and severity of drought in some regions and extreme precipitation events in others;
Potentially lower climate-driven global migration flows;
A reduction of .1 meter (4 inches) in average sea level rise versus the .26 - .77 meter rise (10” to 30”) predicted if average temperatures increase by 2.0 degrees Celsius;
Reduced intensity of wildfires;
Less permafrost thawing;
Reduced spread of invasive species and vector born diseases from hot climates (e.g., malaria and dengue fever);
Reduced increase in ocean acidity and an estimated reduction of 2% rather than 4% in the aggregate annual fisheries catch; and
A lower reduction in global crop yield declines (forecast at 2% - 6% per decade at a 2 degree increase).
After weighing the findings presented in multiple analyses of climate change’s potential effects in many areas, from a macro perspective three loom above the others: food security and water security, and their potential impact on migration flows (with their attendant economic, national security, social, and political impacts)
The effect of climate change on global food production is further compounded by existing concerns regarding soil erosion and the decline in global soil quality (e.g., see, “Soil and Human Security in the 21st Century”, by Amundson et al), and the fact that 70% global phosphate reserves (from which comes phosphorous fertilizer, which is critical for drought resistance) are located in Morocco.
A further concern is the extreme complexity of the global climate system (with all its feedback loops), the inadequacy of current models of it, and therefore the high uncertainty surrounding our understanding of its operations and potential critical or tipping points (e.g., the dramatic slowdown or cessation of the North Atlantic Thermohaline Circulation, which would cause a sharp cooling in eastern North America and Northern Europe, as well as changes in precipitation elsewhere in the world).
Second,to what extent are we theoretically able to reduce GHG emissions and limit the increase in average global temperature?
Over the past fifteen years, there have been a number of analyses that have created supply curves for different means that could be used to reduce greenhouse gas emissions (e.g., see McKinsey’s “Pathways to a Low Carbon Economy: The Global Greenhouse Gas Abatement Cost Curve”). It is also the case that new technologies (e.g., geoengineering of cloud cover, or direct removal of CO2 from air) are constantly appearing, and the cost effectiveness of existing technologies continues to improve.
However, since electric power generation accounts for 25% or more (depending on the source) of global greenhouse gas emissions, and a far greater share of media stories on GHG reduction, it is worth taking a closer look at the current state of possibilities in this area.
To listen to some parties, all that is needed to sharply reduce GHG emissions is much more rapid deployment of renewable generation technologies, particularly wind and solar. Would that it was that easy…
First, consider the following table, which shows global electricity generation in 2018 by fuel source (source: International Energy Agency):
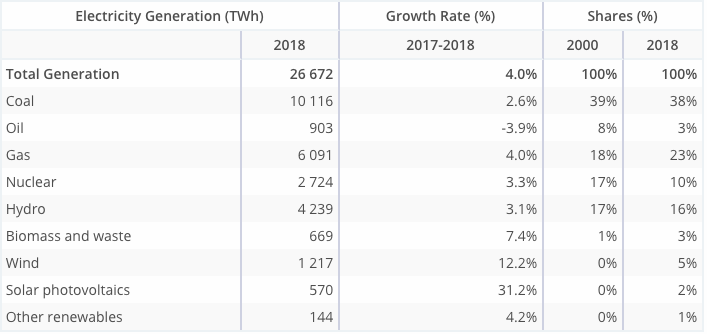
In sum, the major opportunity for GHG reduction from electricity production comes down to replacing coal with some combination of natural gas, nuclear, wind, and solar.
As we know, many people are opposed to increased use of nuclear power, despite the fact that it produces zero GHG emissions and its fuel supply is unconstrained. That leaves increased use of natural gas, wind, and solar. A number of advocacy groups claim that natural gas generation should be reduced (and coal and nuclear closed down) in favor of rapid deployment of wind and solar. However they ignore the technical challenges their plan entails. These include:
- Relatively low power density for wind and solar. In “The Spatial Extent of Renewable and Non-Renewable Power Generation”, van Zalk and Behrens show that given current renewable technologies’ power density (watts generated per square meter of space utilized), implementing the National Renewable Energy Laboratory (NREL) 80% renewable energy scenario by 2050 would require an additional 15 million hectares of land to be used for renewable power generation (an area roughly the size of the state of Illinois). In another study, “Observation-Based Solar and Wind Power Capacity Factors and Power Densities”, Miller and Keith found an average on-shore wind power density of .50 watts/square meter, which has been decreasing as wind generation is installed in more marginal locations. The average power density of solar plants was 5.4 watts/square meter, which has been increasing with time as the technology has improved (by comparison, the average power density of a natural gas generating station is 482 watts/square meter).
- The need for additional transmission lines to serve wind farms. Optimal locations for wind generation are mostly located far from the highest demand for electricity, which necessitates building more high voltage transmission lines. However, approval of these almost always runs into opposition.
- Increased use of variable renewable generation triggers escalating grid control challenges. Current electrical distribution systems were designed on the basis of central (e.g., coal fired) generating stations that would run continuously. When variable renewable generating sources (like wind and solar) are added to the grid at multiple locations, power quality and grid control challenges exponentially increase. While technical solutions are under development, these challenges remain serious obstacles to rapid deployment of wind and solar generation.
- Electricity storage technologies that could smooth power supply from wind and solar generation are still immature. Today, fluctuations in the supply of electricity from wind and solar generators is most often met by a combination of fast-start gas fired “peaker” generation stations, and increased output from coal, gas, and other “baseload” plants. Moreover, when the cost of battery storage to compensate for their intermittent generation is added to the cost of wind and solar generation, their cost per delivered kilowatt hour increases, shrinking their advantage over gas fired generation (and when additional grid control costs are added in, the cost of variable renewable energy increases even more).
Few would disagree that in the future, substantially more electricity will be produced by solar installations with much improved energy densities, backed by much improved battery and other storage technologies, and delivered by a much smarter grid. But we are still a long way off from that scenario becoming reality.
- Third, to what extent will different parties (including governments and companies) actually undertake initiatives to reduce GHG emissions on a meaningful scale?
This uncertainty encompasses three underlying issues:
The first is how different governments will tradeoff allocating scarce resources between mitigating the imperfectly understood causes of global warming (especially GHG emissions) and mitigating the expected consequences of a 1.5c, 2.0c, or even greater increase in average global temperature. The obvious problem is that thus poses a prisoners dilemma. Any individual country will minimize its risk if it invests in consequence mitigation while every other country invests in reducing GHG emissions. Collectively, however, this leads to most countries investing in consequence mitigation and few investing in GHG reduction. For example, consider the following table:
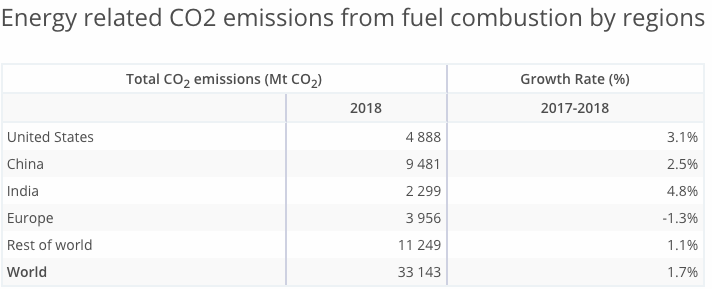
The critical point is that each of those prices comes with an opportunity cost. For example, if the United States imposed a carbon tax of $250/metric tonne on emitted GHGs, it would likely force a shift from coal to more expensive sources of power (assuming their technical feasibility, as noted above). In turn, those higher costs would be born by consumers and businesses, and could (depending on the use of the carbon tax proceeds) lead to a change in GDP growth, and the creation of political costs and benefits for different parties. Even when the US economic growth was relatively strong, a majority of political leaders were unwilling to impose a high price on GHG emissions. If the economy is in a prolonged downturn, their willingness might well be even lower.
The final issue brings us back to Chaisson’s point that energy is the lifeblood of all systems, and how increasing energy rate density enables higher levels of system complexity and performance.
For example, energy density increased when the world moved from using wood as its primary energy source (which has an energy density of 18 megajoules/kilogram) to using coal (10 – 35 mj/kg, depending on its grade), and then to using oil (42 mj/kg before refining), and later natural gas (54 mj/kg) and uranium for nuclear power (3,900,000 mj/kg). However, as non-renewable resources (or slowly renewable in the case of wood) are depleted, the marginal cost for producing the next unit increases (e.g., more expensive wells must be drilled, or more marginal coal deposits mined).
Given rising marginal costs of production, in order to maintain sufficient supply the price that producers receive for an additional unit of a depleting resource must keep increasing. In recent years, however, we have seen that energy prices don’t have to increase very much before the economy begins to slow (especially in increasingly unequal and highly leveraged countries where aggregate demand is already weak). Put differently, the gap between the energy price that incentivizes adequate growth in energy supply and the price that is too high to sustain demand growth has been narrowing. Imposing a GHG emissions tax on energy might make it completely disappear.
Scenarios and Asset Class Impacts
Our conclusion is that future macro environmental scenarios will be driven by the interaction of two key uncertainties:
- The rate at which the adverse effects of rising global temperatures appear, including their frequency, severity, and global distribution;
- The rate at which key technologies develop, especially those related to power generation, direct removal of CO2 from the atmosphere at scale (“Direct Air Capture”), and mitigation of food supply related consequences of increasing global temperatures.
Here are brief summaries of four possible scenarios and their likely impacts:
(1) Adverse temperature and other, possibly severe, climate effects appear relatively quickly, and the rate of technology development is slow, leading to less investment in emissions reduction, higher temperatures, and more spending on consequence mitigation.
- Economy: Slower growth, especially if food prices substantially increase, partially offset by higher government spending on consequence mitigation.
- National Security: More disorder and higher conflict driven by battles to control food resources and control rising migration flows. May reduce current China-West conflict.
- Society: Increased perception of common threat leads to reduced polarization and higher capacity for collective action.
- Politics: Higher levels of international conflict and strengthening of blocs. Increased defense and infrastructure spending.
- Asset Returns: Increased demand for gold, government bonds, infrastructure (including HVAC), and food supply chain equities. Commodity profits will be limited because of price controls to deter speculation. Property could do well as a defensive domestic investment.
(2) Adverse effects appear relatively slowly (e.g., because of a change in the solar cycle which slows the increase in average temperature, and technology advances quickly, leading to relatively more investment in emissions reduction.
- Economy: Potentially faster growth, due to both investment stimulus and reduced perceived uncertainty/increased optimism. But emissions reduction investments likely to be lower than scenario with high consequence mitigation.
- National Security: Lower levels of climate related disorder and conflict. However, current conflicts (e.g. China vs West) will continue.
- Society: Current levels of polarization will remain and possibly intensify as a result of splits over environmental spending.
- Politics: Current domestic and international conflicts continue.
- Asset Returns: Continued struggles with inadequate demand, high leverage, and deflationary pressures. Equities should benefit from new wave of tech opportunities and rising optimism.
(3) Adverse effects appear quickly, but the rate of technology improvement is fast. In this case, consequence mitigation will likely still receive the bulk of national investment, especially if the climate effects are severe.
- Economy: Slower growth, especially if food prices substantially increase, partially offset by higher government spending on consequence mitigation.
- National Security: More disorder and higher conflict driven by battles to control food resources and control rising migration flows. May reduce current China-West conflict.
- Society: Increased perception of common threat leads to reduced polarization and higher capacity for collective action.
- Politics: Higher levels of international conflict and strengthening of blocs. Increased defense and infrastructure spending.
- Asset Returns: Increased demand for gold, government bonds, infrastructure (including HVAC), and food supply chain equities. Commodity profits will be limited because of price controls to deter speculation. Property could do well as a defensive domestic investment.
(4) Adverse effects appear slowly, and technology develops slowly. As a result, investment in both emissions reduction and consequence mitigation is low relative to the other scenarios.
- Economy: Continued struggles to escape secular stagnation.
- National Security: Current conflicts (e.g. China vs West) will continue.
- Society: Current levels of polarization will remain, but environmental concerns could become less muted as secular stagnation drags on and focus on redistribution gains traction.
- Politics: Current international conflicts continue, with increasing domestic conflicts driven by continuing secular stagnation.
- Asset Returns: Continued struggles with inadequate demand, high leverage, and deflationary pressures. Gold as an alternative to negative yielding governments and rising concern over potential inflation as more debt is monetized by central banks. Property will benefit. Equities will depend on nature of fiscal stimulus to attack secular stagnation.
Going Forward
Having established this set of prior views, we will continue to update them each month as valuable information (i.e., indicators and surprises) become available. In particular, we will be focused on the dynamic “margin of safety” between the rate at which adverse environmental effects are developing and the rate at which potential emissions reduction and consequence mitigation options are maturing.
If you have any questions about anything we have written in this issue, please don’t hesitate to get in touch, at contact@indexinvestor.com
Appendix: Anticipatory Thinking and Forecasting Methodologies
Our process is based on methods and tools developed over the past seven years at our affiliate, Britten Coyne Partners, which provides consulting services and education courses to executive teams and boards on strategic risk governance and management.
At The Index Investor, we engage in both anticipatory thinking to identify what could happen (e.g., different macro regimes and related events), and forecasting, to estimate the probability that events and regimes will happen, and the impact they will have if they do (e.g., on macro variables and broad asset class returns).
With respect to what could happen, we are acutely conscious of the conclusion reached by a 1983 CIA study of failed forecasts: "each involved historical discontinuity, and, in the early stages…unlikely outcomes. The basic problem was…situations in which trend continuity and precedent were of marginal, if not counterproductive value."
When it comes to forecasting, we know that in complex socio-technical systems that are constantly evolving, the accuracy of statistical or machine learning based forecasting methods declines exponentially as the time horizon lengthens, since the historical data set on which they were trained will (depending on the speed and effectiveness of any retraining cycle) bear less and less resemblance to the distribution of outcomes the system is likely to produce in the future.
Under these circumstances, forecast accuracy over longer time horizons depends on causal and counterfactual reasoning about the possible future effects of multiple interacting trends and uncertainties that are hard to quantify.
And we are acutely aware of the economist Rudi Dornbusch's famous warning: "Crises take a much longer time coming than you think, then happen much faster than you would have thought."
Our forecasting process also draws on lessons Tom Coyne learned from spending four years as a member of the Good Judgment Project team, which won the Intelligence Advanced Research Projects Activity’s forecasting tournament with forecast accuracy that was more than 50% better than the tournament's control groups (the team's experience is described in Professor Philip Tetlock's book, “Superforecasting").
Our analysis focuses on the probability of the global macro system being in four possible macro regimes 12 and 36 months from the date of our forecast: (1) Normal Times, where equity asset classes perform well; (2) a High Uncertainty regime that is usually short and transitory, where asset classes like short-term government bonds perform best and equities suffer significant declines; (3) High Inflation (which we deem 5% or more, year-on-year), where commercial property, real return bonds and other traditional hedges are favored; and (4) Persistent Deflation (a year-on-year decline in the US CPI), which up to now has only been seen in Japan, and in which the relative performance of different asset classes remains uncertain, but will likely favor high quality bonds and the consumer staples equity sector.
In response to subscriber requests, we have added a 36-month regime forecast to our existing 12 month forecast. The logic is that, in a complex evolving system like global macro, a longer forecast horizon gets beyond the “detection range” of algorithmic forecasting approaches, and therefore raises probability that a manager/investor can gain an edge in identifying emerging threats and opportunities.
That said, because evolving (i.e., “non-stationary”) complex systems populated by highly connected human agents are also capable of sudden non-linear changes (with which are hard for algorithmic approaches to predict), we are also keeping our 12 month forecast.
Our forecasting methodology starts with base rate/reference case data about the historical probability of large changes in equity and bond valuations. We then analyze the current situation from both a quantitative and qualitative perspective. In the latter, we focus on the key endogenous drivers of macro regime change, including technological, economic, national security, social, and political trends and uncertainties. We also focus on three potential sources of exogenous shocks that could also produce a macro regime change, caused by environmental, disease, and cyber related events.
While most of our attention typically focuses on various flows (e.g., economic growth, change in the price level, sales, earnings, job creation, etc.), endogenously caused regime changes result when those flows push key stocks beyond a critical threshold or tipping point, often setting off non-linear reactions across multiple areas. As noted by Hyman Minsky and others, a classic example is the steady accumulation of outstanding debt until it reaches the point where it can no longer be serviced and triggers a crisis.
Base Rate Data
Since the end of World War Two, there have been fifteen months where a downturn in the US equity market began that eventually reduced asset class value by 20% of more. That is a hazard rate of about 1.75% per month. Put differently, in any given month there is a 98.25% probability that a 20%+ downturn won’t occur, or, in a given year, an 81% probability.
However, as the time without a 20%+ downturn extends, the compound probability that one will not occur shrinks. At the end of August 2018, it is more than nine years since the last equity market decline of 20% or more. The probability of that happening is only 15%.
To estimate the base rate for a 20% fall in bond prices (which historically has been caused by a sharp increase in inflation, as we saw in the late 1970s and early 1980s), we analyzed monthly historical AAA bond yields since 1919. For consistency, we used them to calculate the price of a ten-year zero coupon bond. We then calculated the probability of a price decline of 20% or more over three different holding periods: 12, 18, and 24 months. In any month, the annualized probability of a decline of 20% or more over the subsequent 12 months is 12%; over 18 months, 20%, and over 24 months, 25%.
Market Stress Indicators Methodology
We view financial markets as a complex adaptive system. The size of changes generated by such a system follows a power law rather than a normal (Gaussian) distribution. The critical point is that large changes are much more common in complex adaptive systems than most people’s intuition leads them to believe.
While predicting the behavior of complex adaptive systems remains far more art than a science, various researchers have found that large changes in such systems are often preceded by subtle warning signs, as stress accumulates within them. While this research is not definitive, we believe that five warning signs are worth monitoring as potential indicators of growing stress within financial markets that could suddenly give rise to large changes in asset class valuations.
Our first indicator is the month-to-month autocorrelation of broad asset class returns (i.e., the relationship of this month’s returns to last month’s). A system under increasing stress loses resiliency, causing it to take longer to recover from perturbations; hence, autocorrelation increases as it approaches a critical transition (see, “Early Warning Signals for Critical Transitions” by Scheffer, et al).
The second market stress indicator we monitor is the Economic Policy Uncertainty Index published by the Federal Reserve Bank of St. Louis (via its FRED economic database), which is based on research by Baker, Bloom, and Davis (see their paper, “Measuring Economic Policy Uncertainty”). The index is based on automated text analysis of leading newspapers and magazine publications, to identify the frequency with which words and phrases are used that indicate uncertainty.
In humans’ evolutionary past, when uncertainty increased the probability of survival was enhanced by staying close to a group. All of us still have that instinct. Research has found that as uncertainty increases, we have an unconscious bias towards higher conformity of our own views with those of a larger group (i.e., reduction in cognitive diversity). Behaviorally, heightened uncertainty induces more “social copying” of others, likely due to both conformity bias and the rational belief that others may be acting on the basis of superior information. This increase in conformity and copying makes a social system more ordered as uncertainty increases, and also reduces its responsiveness to perturbations (i.e., increases autocorrelation) because of delays in the social copying process.
The key point is that increasing uncertainty induces more, not less order in social systems, and in so doing primes them for sudden non-linear change.
Our third market stress indicator is the spread between the yield on AAA rated bonds and the 10-year US Treasury. This is a proxy for the level of investor concern about financial system funding liquidity.
Our fourth market stress indicator is the yield spread between speculative BB rated bonds and the ten-year US Treasury. Throughout history, excessive credit growth has been a root cause of many financial crises. An indicator of such growth is falling credit spreads, particularly in the case of riskier borrowers. In contrast, rising BB spreads indicate growing investor concern about the consequences of such growth, and the financial distress lower rated companies could experience in an economic downturn.
Our fifth market stress indicator is what we term the “political risk premium” that is implicit in the price of gold. Our starting point for estimating this premium is the three different roles that gold plays. First, gold is a store of value in a world of fiat currencies. When the rate of money supply growth exceeds the growth of nominal GDP, gold’s price should increase to maintain its purchasing power. Between 2007 and 2017, the US money supply (M2) grew by about 86%, while nominal US GDP grew by 35%. The stock of gold grew by 18%, based on mine production over this period. We therefore infer that 33% of the increase in the price of gold represented the maximum potential gold price change that could be attributed to a desire to hedge inflation risk (86% less 35% less 18%).
Second, gold is a unit of account. We take this to mean that the annual change in GDP expressed in terms of physical gold (i.e., nominal GDP divided by the price of gold) should equal the change in real GDP calculated using the GDP price deflator to account for actual inflation over the period. A key challenge is the point at which to start this calculation.
We chose the price of gold in 1995/1996. In that period, the change in real global GDP measured using the IMF’s price deflator just about equaled the change in GDP measured in terms of physical gold. We interpret that coincidence as indicating that at that point in time, concerns about future inflation and political risk were minimal, and the change in the price of gold was mostly driven by its role as a unit of account. We calculated a subsequent series of gold prices that would produce the same change in “gold GDP” as the actual real GDP as calculated by the IMF. Between 2007 and 2017, “gold as a unit of account” warranted a 21% increase in its price.
Gold’s third role is as a hedge against inflation and what we term “political disaster” risk. We subtract the 21% estimated compensation for actual inflation from the 33% “gross” inflation risk hedge to derive an apparent 12% increase in the gold price that reflected the true risk premium to hedge against possible future inflation. However, between 2007 and 2017 the price of gold actually increased by 81%. This implies that 48% of this (81% less 21% less 12%) represented a premium for some other type of uncertainty at the end of 2017. The interesting question is the nature of the uncertainty for which gold is believed by some investors to be a superior hedge than traditional ports in a storm like short-term US government securities, or similar securities issued by other developed countries.
The logical inference is that the uncertainty in question must reflect a situation in which short term US Treasuries would be a less effective hedge than gold. This could be a world of widespread hyperinflation, capital controls, and/or radical changes in nations’ governments (of course, this would also imply a preference for investing in gold coins rather than bullion, as while the latter may be a store of value, it is far less convenient as a means of paying for transactions).
To put this in further perspective, this gold price “disaster risk” premium sharply increased from 2008 to 2012, then declined before sharply increasing again after 2016. Arguably, a significant part of the former increase reflects concerns about the potential inflationary consequences of dramatic quantitative easing by central banks. But this is not likely to be the case after 2016.