The Index Investor
October 2018
Key Takeaways
- Most broad asset classes are overvalued. Market Stress Indicators are lower than at the end of August. However, very low BB credit spreads over the 10 Year US Treasury indicates that deep level stress continues to increase.
- We estimate that there is a 95% chance the macro system will shift from the current Normal Regime to the High Uncertainty Regime with in the next 12 months. Our pre-mortem analysis of this forecast (which assumes it turns out to be wrong) is based on two scenarios we currently see as unlikely: (1) Replacement of President Trump with Vice President Pence; or (2) Settlement of the escalating trade war (and the broader conflict that underlies it) between China and the US.
- We believe there is a 75% chance that the High Uncertainty Regime will give way to the Persistent Deflation Regime (this month’s feature article provides more detail on this forecast)
Asset Class Valuation and Momentum Indicators (@28Sep18)
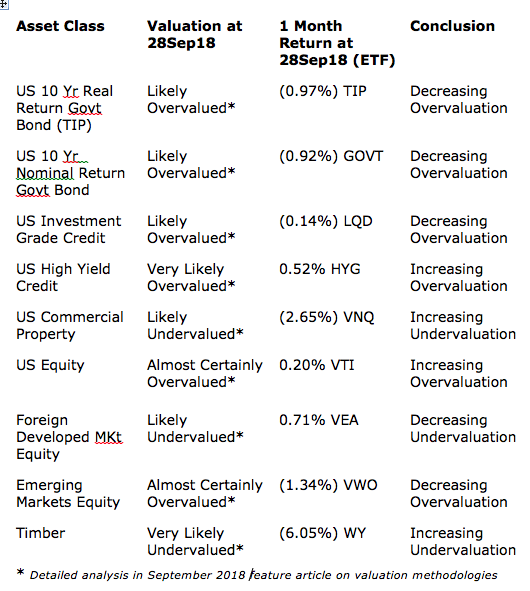
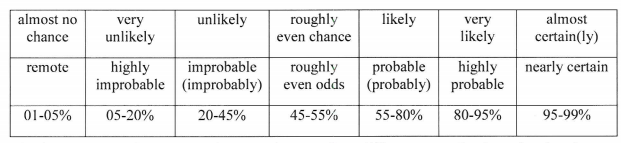
Note: The language we use to describe our estimated likelihood of asset class over or undervaluation is based on US Intelligence Community Directive 203 on Analytic Standards, which includes the following table:
Market Stress Indicators (@28Sep18)
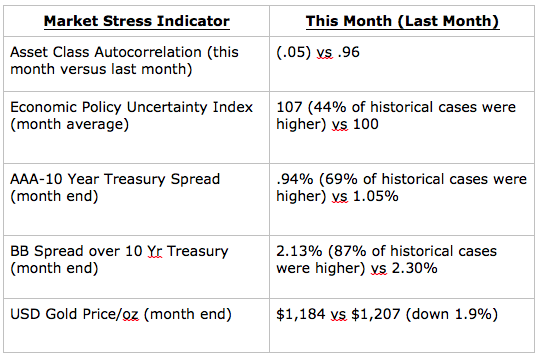
Compared to August, four of our indicators have fallen, which implies a reduced level of underlying stress in financial markets at the end of September 2018, and thus a lower risk of substantial changes in asset class valuations. However, BB rated bonds’ spread over the 10 Year US Treasury fell to just 2.13%, which put it in just the 13th percentile since the series started in 1996. Such low credit spreads on speculative grade bonds are often a sign of excessive credit growth, which underlies many sources of market stress.
Forecast Discussion
We view financial markets as a complex adaptive system. The size of changes generated by such a system follows a power law rather than a normal (Gaussian) distribution. The critical point is that large changes are much more common in complex adaptive systems than most people’s intuition leads them to believe.
While predicting the behavior of complex adaptive systems remains far more art than a science, various researchers have found that large changes are often preceded by subtle warning signs, as stress accumulates within them. While this research is not definitive, we believe that four warning signs are worth monitoring as potential indicators of growing stress within financial markets that could suddenly give rise to large changes in asset class valuations.
Our first indicator is the month-to-month autocorrelation of broad asset class returns (i.e., the relationship of this month’s returns to last month’s). A system under increasing stress loses resiliency, causing it to take longer to recover from perturbations; hence, autocorrelation increases as it approaches a critical transition (see, “Early Warning Signals for Critical Transitions” by Scheffer, et al).
The one-month autocorrelation of returns for the broad asset classes we monitor increased from .96 in August to (.05) in September. This indicates that financial markets are becoming less ordered and are further away from a critical transition point than they were last month.
The second market stress indicator we monitor is the Equity Market Related Economic Policy Uncertainty Index published by the Federal Reserve Bank of St. Louis (via its FRED economic database), which is based on research by Baker, Bloom, and Davis (see their paper, “Measuring Economic Policy Uncertainty”). The index is based on automated text analysis of leading newspapers and magazine publications, to identify the frequency with which words and phrases are used that indicate uncertainty.
In our evolutionary past, when uncertainty increased our probability of survival was enhanced by staying close to our group. We still have that instinct. Research has found that as uncertainty increases, we have an unconscious bias towards higher conformity of our own views with those of a larger group (i.e., reduction in cognitive diversity). Behaviorally, heightened uncertainty induces more “social copying” of others, likely due to both conformity bias and the rational belief that others may be acting on the basis of superior information. This increase in conformity and copying makes a social system more ordered as uncertainty increases, and also reduces its responsiveness to perturbations (i.e., increases autocorrelation) because of delays in the social copying process.
The key point is that increasing uncertainty induces more, not less order in social systems, and in so doing primes them for sudden non-linear change.
For September 2018, the average Economic Policy Uncertainty Index stood at the 56th percentile of its values since the data series began in 1985 – to be clear, 44% of values were higher over that 33.5 year period. Also, our measure of intra-month uncertainty (the number of daily changes in the top and bottom 20% of the historical distribution) was in the 45th percentile -- in 55% of rolling 30-day periods since 1985, it has been higher. This was unchanged since the end of August.
Our third market stress indicator is the spread between the yield on AAA rated bonds and the 10-year US Treasury. We interpret this as a proxy for the level of investor concern about financial system liquidity. At the end of September 2018, this spread stood at 0.94%, which was the 31th percentile of all observations since the index series began in 1983 – 69% of observations have been higher.
Our fourth market stress indicator is the yield spread between speculative BB rated bonds and the ten-year US Treasury. Throughout history, excessive credit growth has been a root cause of many financial crises. An indicator of such growth is falling credit spreads, particularly in the case of riskier borrowers. At the end of September, this spread was only 2.13%, which put it in the 13th percentile of spreads recorded since this data series began in 1996 – 87% the previous observations were higher.
Our final market stress indicator is what we term the implicit “political risk premium” that is embodied in the price of gold. Our starting point for deriving this premium is the three roles that gold plays. First, gold is a store of value in a world of fiat currencies. When the rate of money supply growth exceeds the growth of nominal GDP, gold’s price should increase to maintain its purchasing power.
Between 2007 and 2017, the US money supply (M2) grew by about 86%, while nominal US GDP grew by 35%. The stock of gold grew by 18%, based on mine production over this period. This warranted a 33% increase in the price of gold to hedge potential inflation risk (86% less 35% less 18%).
Second, gold is a unit of account. We take this to mean that the annual change in GDP expressed in terms of physical gold (i.e., nominal GDP divided by the price of gold) should equal the change in real GDP calculated using the GDP price deflator to account for actual inflation over the period. A key challenge is the point at which to start this calculation.
We chose the price of gold in 1995/1996. In that period, the change in real global GDP measured using the IMF’s price deflator just about equaled the change in GDP measured in terms of physical gold. We interpret that coincidence as indicating that at that point in time, concerns about future inflation and political risk were minimal, and the change in the price of gold was mostly driven by its role as a unit of account. We calculated a subsequent series of gold prices that would produce the same change in “gold GDP” as the actual real GDP as calculated by the IMF. Between 2007 and 2017, “gold as a unit of account” warranted a 21% increase in its price.
We subtract this 21% increase (reflecting actual inflation over the period) from the 33% increase for gold as an inflation risk hedge to derive an apparent 12% increase in the gold price that reflected an inflation risk premium, rather than compensation for actual inflation.
However, between 2007 and 2017 the price of gold actually increased by 81%. This implies that 48% of this (81% less 21% less 12%) represented a premium for some other type of uncertainty at the end of 2017.
The interesting question is the nature of the uncertainty for which gold is believed by some investors to be a superior hedge than traditional ports in a storm like short term US government securities, or similar securities issued by other developed countries.
The logical inference is that the uncertainty in question must reflect a situation in which short term US Treasuries would be a less effective hedge than gold. This could be a world of widespread hyperinflation, capital controls, and/or radical changes in nations’ governments.
To put this in further perspective, the actual gold price premium above our calculated “unit of account” price sharply increased from 2008 to 2012, then declined before sharply increasing again after 2016. Arguably, a significant part of the former increase reflects concerns about the potential inflationary consequences of dramatic quantitative easing by central banks. But this is not likely to be the case after 2016.
Over the last month, the price of gold fell by about 2%. Through September 2018, the price of gold has fallen by about 9% since the end of 2017, so, on a rough approximation, the political uncertainty premium now stands at about 39%, compared to 40% at the end of August.
Macro Regime Forecast and Implications for Asset Class Values
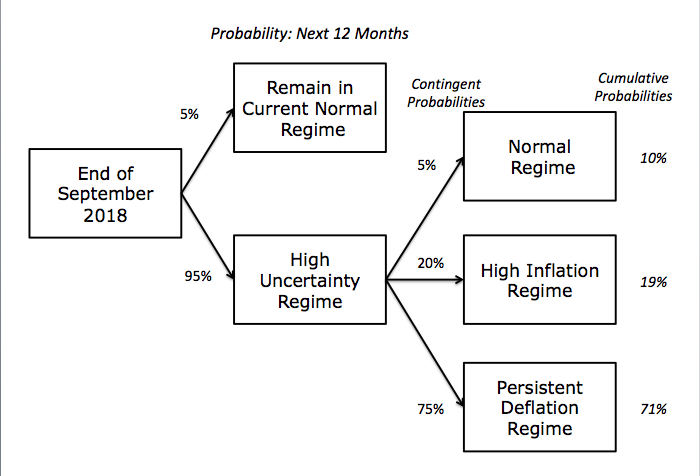
Based on new information collected and analyzed this month, we have raised the probability that within 12 months we will enter the High Uncertainty Regime from 90% to 95%. Contingent on that happening, we have also raised the probability that we will then enter the Persistent Inflation Regime from 70% to 75%, and reduced the probability of a return to the Normal Regime from 10% to 5%. The probability of entering the High Inflation Regime remains unchanged at 20%.
Methodology
The focus of our monthly macro forecast is twofold. First, the probability of a change in financial market regime that causes changes of 20% or more in asset class valuations over the next year. Second, contingent on such a change taking place, the probability of a subsequent transition to other regimes.
Our analysis focuses on four possible macro regimes: (1) Normal Times, where equity asset classes perform well; (2) a High Uncertainty regime that is usually short and transitory, where asset classes like short-term government bonds perform best; (3) High Inflation, where commercial property, real return bonds and other traditional hedges are favored; and (4) Persistent Deflation, which up to now has only been seen in Japan, and in which the relative performance of different asset classes remains most uncertain.
Our forecasting methodology is derived from our experience on the Good Judgment Project, as described in the book, “Superforecasting” by Gardner and Tetlock.
We start with base rate/reference case data about the historical probability of large changes in equity and bond valuations. We then analyze the current situation from both a quantitative and qualitative perspective. In the latter, we focus on the key endogenous drivers of macro regime change, including technological, economic, national security, social, and political trends and uncertainties. We also focus on three potential sources of exogenous shocks that could also produce a macro regime change, caused by environmental, disease, and cyber related events.
While most of our attention typically focuses on various flows (e.g., economic growth, change in the price level, sales, earnings, job creation, etc.), endogenously caused regime changes result when those flows push key stocks beyond a critical threshold or tipping point, often setting off non-linear reactions across multiple areas. As noted by Hyman Minsky and others, a classic example is the steady accumulation of outstanding debt until it reaches the point where it can no longer be serviced and triggers a crisis.
Base Rate Data
Since the end of World War Two, there have been fifteen months where a downturn in the US equity market began that eventually reduced asset class value by 20% of more. That is a hazard rate of about 1.75% per month. Put differently, in any given month there is a 98.25% probability that a 20%+ downturn won’t occur, or, in a given year, an 81% probability.
However, as the time without a 20%+ downturn extends, the compound probability that one will not occur shrinks. At the end of August 2018, it is more than nine years since the last equity market decline of 20% or more. The probability of that happening is only 15%.
To estimate the base rate for a 20% fall in bond prices (which historically has been caused by a sharp increase in inflation, as we saw in the late 1970s and early 1980s), we analyzed monthly historical AAA bond yields since 1919. For consistency, we used them to calculate the price of a ten-year zero coupon bond. We then calculated the probability of a price decline of 20% or more over three different holding periods: 12, 18, and 24 months. In any month, the annualized probability of a decline of 20% or more over the subsequent 12 months is 12%; over 18 months, 20%, and over 24 months, 25%.
The Current State of Quantitative Regime Predictors
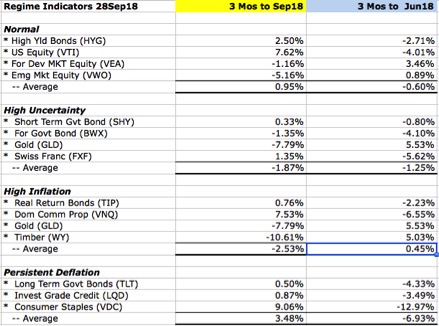
Our quantitative methodology focuses on the level and change in three-month returns, over the most recent and previous three-month periods, for those asset classes which should perform best under different regimes.
As you can see in the following table, at the end of September 2018, this analysis indicates that, over the next 12 months, the balance of expectations appears to favor the continuation of the Normal Regime. Contingent on a shift to the High Uncertainty Regime, market returns indicate expectations for a subsequent change to the Persistent Deflation Regime. This a significant shift from three months ago, when the balance of expectations favored a subsequent change to the High Inflation Regime.
Like Professors Andrew Lo, Doyne Farmer and others, we regard financial markets as a complex adaptive system (CAS), that exist as part of a larger macro system comprised of other CAS between which there are multiple feedback loops. These other systems include those that produce technology innovations, and economic, environmental, national security (including cyber), social, demographic, and political outcomes.
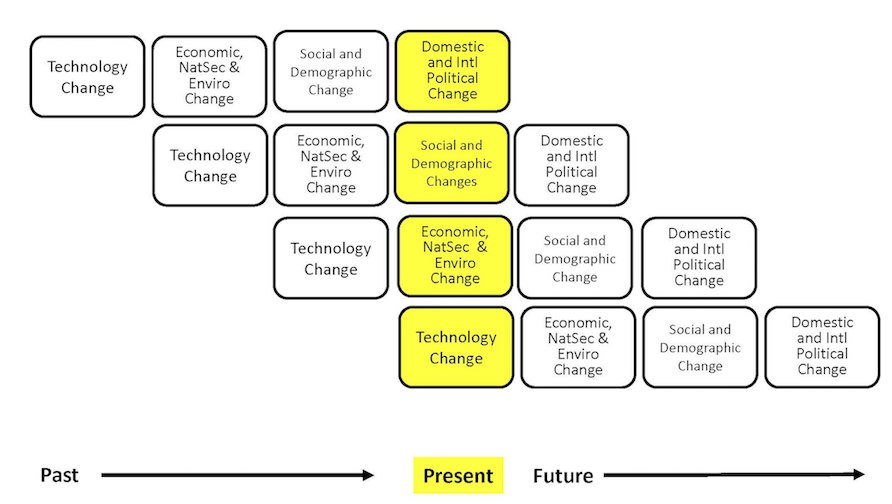
We also find that these systems tend to operate and generate effects in a rough chronological sequence, albeit with many feedback loops between them. The following chart highlights that the changes we observe in different areas at any point in time are actually part of a much more complex evolutionary process.
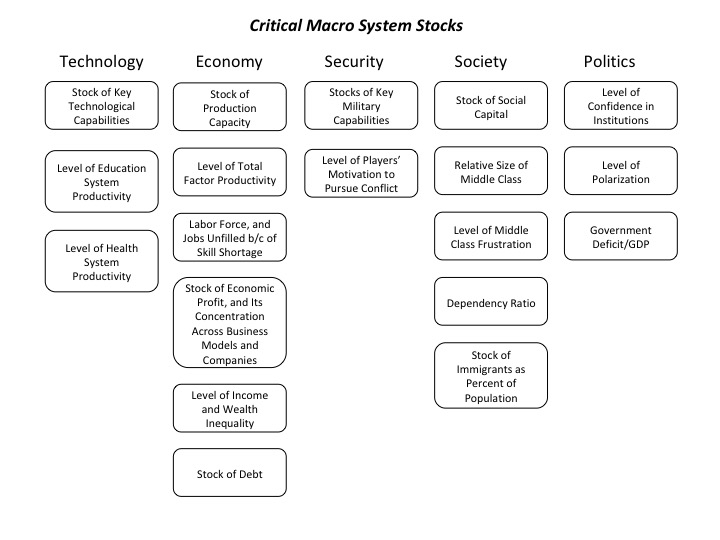
While most media coverage of these systems focused on flows (e.g., the size of the government deficit), rapid non-linear change in complex adaptive systems is often caused by a key stock (e.g., the amount of outstanding government debt) exceeding a critical threshold.
The next table highlights the key macro system stocks that we monitor.
In the next section, we will discuss information received over the past month that is related to these stocks, and which we believe is significant to our assessment of the probabilities that a critical threshold will be reached and a regime change will occur. We will conclude with our estimate, at the end of September 2018, of how close the macro system is to these critical thresholds, and the implications for financial market regime change probabilities.
In our methodology, new information is valuable insofar as it provides an updated indicator of how close we are to a critical threshold, or it is surprising and causes us to question an element of our overall system model (e.g., the existence of another critical threshold we should monitor, or the range of possible outcomes for a key uncertainty).
| New Technology Information: Indicators and Surprises | Why Is This Information Valuable? |
| In a new book, “AI Superpowers”, Chinese venture capitalist Kai-Fu Lee makes an important point: There is a critical difference between AI innovation and AI implementation. Success in the latter depends on the ability to collect and analyze large amounts of data – and this is an area where China is outpacing the rest of the world, because of its size, its state capitalism model, low level of concern with privacy, and its data intensive approach to domestic security. | Provides a logical argument for how and why China could gain a significant advantage in key artificial intelligence technologies. |
| US House of Representatives Subcommittee on Information Technology published a new report titled “Rise of the Machines.” Highlights: “First, AI is an immature technology; its abilities in many areas are still relatively new. Second, the workforce is affected by AI; whether that effect is positive, negative, or neutral remains to be seen. Third, AI requires massive amounts of data, which may invade privacy or perpetuate bias, even when using data for good purposes. Finally, AI has the potential to disrupt every sector of society in both anticipated and unanticipated ways.” | Report’s conclusions are an interesting contrast to Kai-Fu Lee’s. Similar to critiques by Gary Marcus and Judea Pearl, it highlights the limitations of current AI technologies, which suggests we are further away from a critical threshold than many media reports would suggest. That said, it also agrees that once a critical threshold of AI capability is reached, it will have strong disruptive effects. However, the report agrees with Lee that privacy concerns are a potentially important constraint on AI progress. |
| “China is Overtaking the US in Scientific Research” by Peter Orzag in Bloomberg Opinion. Not just the quantity, but also “the quality of Chinese research is improving, though it currently remains below that of U.S. academics. A recent analysis suggests that, measured not just by numbers of papers but also by citations from other academics, Chinese scholars could become the global leaders in the near future.” | Suggests that the pace of technological improvement in China will accelerate. |
| “Quantum Hegemony: China’s Ambitions and the Challenge to US Innovation Leadership”. Center for a New American Security. “China’s advances in quantum science could impact the future military and strategic balance, perhaps even leapfrogging traditional U.S. military-technological advantages. Although it is difficult to predict the trajectories and timeframes for their realization, these dual-use quantum technologies could “offset” key pillars of U.S. military power, potentially undermining critical technological advantages associated with today’s information-centric ways of war, epitomized by the U.S. model.” | Highlights a key area in which faster Chinese technological progress and breakthroughs could confer substantial military advantage. |
| “A Storm in an IoT Cup: The Emergence of Cyber-Physical Social Machines” by Madaan et al. “The concept of ‘social machines’ is increasingly being used to characterize various socio-cognitive spaces on the Web. Social machines are human collectives using networked digital technology, which initiate real-world processes and activities including human communication, interactions and knowledge creation. As such, they continuously emerge and fade on the Web. The relationship between humans and machines is made more complex by the adoption of Internet of Things (IoT) sensors and devices. The scale, automation, continuous sensing, and actuation capabilities of these devices add an extra dimension to the relationship between humans and machines making it difficult to understand their evolution at either the systemic or the conceptual level. This article describes these new socio-technical systems, which we term Cyber-Physical Social Machines.” | Increasing complexity creates exponentially more hidden critical thresholds, and ways for a system to generate non-linear effects. |
| “Notes From the Frontier: Modeling the Impact of AI on the World Economy”, McKinsey Global Institute. Adoption of AI could increase annual global GDP growth by 1.2%. Adoption of AI technologies and emergence of their impact is following typical “S-Curve” pattern. At this point, “the absence of evidence is not evidence of absence” of its potential impact. | Excellent analysis of the current state of AI development, rate of adoption, and range of observed effects. Critical Point: “Because economic gains combine and compound over time…a key challenge is that adoption of AI could widen gaps between countries, companies, and workers.” |
| “Blueprint: How DNA Makes Us Who We Are” by Robert Plomin. Argues that genetic differences cause most variation in human psychological traits. Accumulating evidence for the dominance of nature over nurture has many potentially disruptive implications. See also, "Top 10 Replicated Findings from Behavioral Genetics" by Plomin et al | Surprise. The implications of the body of research this book compiles and synthesizes has enormous disruptive potential, at the economic, social, and ultimately political level. |
| New Economic Information: Indicators and Surprises | Why Is This Information Valuable? |
| “A Template for Understanding Big Debt Crises” by Ray Dalio. Following Bridgewater’s deep dive into “Populism: The Phenomenon”, it’s Chair has published this equally exhaustive guide to debt crises. As a veteran of many of the ones described (e.g., the LDC crisis in the 1980s), I found it a very impressive work. | Dalio is clearly trying to prepare policymakers and investors for when the stock of outstanding debt reaches a critical “Minsky” threshold. |
| Claudio Borio is the head of the Monetary and Economic Department at the Bank for International Settlements. For years, he worked there with Bill White, who presciently anticipated the crisis of 2008. In a 23Sep18 speech, Borio said that, “On the financial side, things look rather fragile. Markets in advanced economies are still overstretched and financial conditions still too easy. Above all, there is too much debt around: in relation to GDP, globally, overall (private and public) debt is now considerably higher than pre-crisis. Ironically, too much debt was at the heart of the crisis, and now we have more of it - although, fortunately, banks have reduced their leverage thanks to financial reform. With interest rates still unusually low and central banks' balance sheets still bloated as never before, there is little left in the medicine chest to nurse the patient back to health or care for him in case of a relapse. Moreover, the political and social backlash against globalisation and multilateralism adds to the fever. Policymakers and market participants should brace themselves…” | Indicator that, like Dalio, Borio and the BIS believe that the global macro system is approaching a critical debt accumulation threshold. |
| Federal Reserve Bank of Boston Conference on “The Consequences of Long Spells of Low Interest Rates”. Presentations highlighted the continuing reach for higher yields; increased defined benefit pension plan underfunding due to low liability discount rates and investment earnings; and changing institutional structure in financial markets (e.g., growth of credit hedge funds) have created new sources of system risk. Do we have sufficient policy tools to buffer impact of next crisis? Greater likelihood that zero lower interest rate bound will be reached in future, and limit effectiveness of monetary policy (like Abe’s experience in Japan). Also highlighted limited state/local fiscal policy buffers. Final observatioin was impact of low rates on the ability of retirees to obtain sufficient income (e.g., via annuities). | Clearly, the US Federal Reserve system is concerned about the accumulation of negative consequences of the extreme monetary stimulation that avoided a severe downturn after 2008. Perhaps more important is their worries about the lack of sufficient monetary and fiscal policy “firepower” when the next downturn (which could be accompanied by a severe debt crisis) occurs. As in Japan, that places more emphasis than ever on structural policy reforms, which are too often blocked by political gridlock. |
| “A Failure of Responsibility” by Levin and Capretta (AEI) “As Debt Rises, the Government Will Soon Spend More on Interest Than on the Military”, by Nelson Schwartz, NYT “Avoiding [Sovereign] Debt Traps”, by Padoan et all, OECD Journal “Paying Off Government Debt” by Bryan Taylor (the options are austerity, growth, inflation, and/or default) | All of these highlight growing concern with ballooning US federal deficits and the underlying growth of entitlement spending (e.g., Medicare, Medicaid, Social Security) which is being financed via debt issuance, which, even with a relatively strong economy, is still causing a rise in the ratio of government debt to GDP. |
| New Federal Reserve Board research paper: “Measuring Aggregate Housing Wealth: New Insights From an Automated Valuation Model” by Gallin et al. Housing recovery hasn’t been as strong as repeat sales indexes suggest; also, metrics based on owner valuation estimates understate extent of housing value destruction. | Combine this with IMF research finding common monetary policies by leading central banks have led to a sharp increase in global synchronization of housing prices, which has exacerbated the potential negative impact of a global fall in housing prices. |
| “Crashed: How a Decade of Financial Crises Changed the World” by Adam Tooze, and his Foreign Affairs arcticle, “The Forgotten History of the Financial Crisis” , “Ten years later, there is little consensus about the meaning of 2008 and its aftermath”… “How will a multipolar world that has moved beyond the transatlantic cooperation structures of the last century cope with the next crisis?” | Will wholesale funding markets hold up in the next crisis? The US Dollar has become an even more dominant currency since 2008, while foreign borrowing in USD has sharply risen. Fed swap lines could again be critical to prevent implosion of banking system in the next crisis – but with frayed political relations, will they work? E.g., At peak of Eurozone crisis, the Fed reopened swap lines. While European banks have disengaged from global financial system, emerging markets have increased theirs – including China’s shadow banking system. |
| The China - US trade war intensified in September. So far this only involves tariffs, but the potential for China retaliating by disrupting US companies’ supply chains remains. | Such a move could quickly trigger a financial panic in anticipation of a global recession of unknown severity. The US reaction to this is also another area of critical uncertainty. |
| In France, President Macron’s proposed structural reforms are running into growing political opposition. But they are key to increased growth in France and, through the power of example, across the Eurozone. In turn, higher growth creates the possibility for reducing class conflict and the attraction of extreme political views, as well as relaxing the currently difficult tradeoff between social and defence spending. | As noted above, given the limited monetary and fiscal “firepower” that will be available to policymakers in the next economic downturn (and financial crisis), structural reform will be a far more important policy lever than in the past for restoring economic growth. Yet there is great uncertainty about the willingness and ability of political systems in many countries to enact it |
| New Pew analysis shows US public pension fund’s shift to alternatives (hedge funds and private equity) is not paying off in higher net returns and improving funding ratios (pension assets as a percent of the present value of liabilities). Also, “Lehman’s Legacy is a Global Pensions Mess” by John Authers in the Financial Times | The building public pension fund crisis, not just in the US but in other countries as well, is a classic “grey swan” – a future crisis that everyone can see, but nobody does anything about until it explodes. The essential problem is that due to a combination of higher promised benefits and longer lifetimes, public pension fund liabilities have continued to grow. To some extent, their true size has been disguised by the use of higher discount rates than private sector companies are allowed to use. Plan sponsors had hoped that shifting assets into risker investments would offset a significant percentage of this liability growth. As Pew found, this generally hasn’t worked. This leaves public sector plan sponsors and governments with an unpalatable choice between cutting government spending in other areas, raising taxes, or cutting retiree benefits. This choice will become exponentially harder in the context of a protracted economic downturn and extended low investment returns. |
| New National Security Information: Indicators and Surprises | Why Is This Information Valuable? |
| In addition to headlines about the growing China-US trade war, (and to a lesser extent high Chinese debt/GDP and the fragility of its shadow banking system), other stories appeared in September, including growing frustrations as increasing automation produces rising layoffs, repression of Marxist student movements that have attempted to unionize workers, protests by People’s Liberation Army veterans over their treatment, and parental anger over school crowding. | As summarized by George Magnus in his new book, “Red Flags: Why Xi’s China is in Jeopardy”, increasing use of repression in China – from growing use of surveillance technology to Uyghur concentration camps to forced acquisitions of private companies by state owned companies – comes in response to evidence of growing dissatisfaction within the nation. In the context of Chinese history, this is a pattern that repeats. These indicators provide a reminder that as China-US conflict increases, its domestic problems are also serious. |
| “China Doesn’t Want to Play by the World’s Rules: Beijing's plans are much bigger than the trade war.” By Abigail Grace “Securing economic growth is a question of existential importance for Xi and his comrades. The Chinese Communist Party knows that it must deliver a higher quality of life to Chinese citizens in order to retain popular support—or else increase repression of internal dissent. Xi has personally staked out hypernationalist positions and silenced any opposition to his authority, thereby increasing his own personal culpability for losses in a trade war. In fact, rumors that Xi could be facing domestic political trouble have abounded in recent weeks, raising questions about the costs of his shift away from the collective leadership model. China’s leadership knows that addressing the U.S.-China trade imbalance is a personal priority for Trump and is priming its own population for a long and ugly fight. Despite U.S. pressure, China remains committed to its own economic agenda because it believes that achieving technological supremacy today will enable it to write tomorrow’s rules…As long as Chinese leaders think that the key to winning tomorrow is dominating today’s technology through all means short of war, they will remain unwilling to address the structural issues driving economic tensions between the United States and China.” | An insightful compliment to Magnus’ book, that helps to develop a better mental model of the various forces driving Chinese behavior, that could push us closer to, or away from, potential critical national security thresholds. |
| “The Perfect Weapon: War, Sabotage, and Fear in the Cyber Age” by David Sanger “Bluntly, there are no effective laws which govern cyberhacking originating in St Petersburg or Shanghai— or, for that matter, in Tehran or Pyongyang” | Further evidence of the profound change that is occurring in the nature of international conflict, which has substantially heightened uncertainty and the potential for non-linear events with substantial negative impact. |
| “Assessment of the Role of Cyber Power in Interstate Conflict” by Eric Altamura. “To understand how actors attack computer systems and networks to accomplish limited objectives during war, one must first identify what states actually seek to accomplish in cyberspace… Achieving such an advantage requires targeting the key functions and assets in cyberspace that enable states to accomplish political objectives…To deny an opponent the ability to utilize cyberspace for its own purposes, states can either attack information directly or target the means by which the enemy communicates its information. Once an actor achieves uncontested use of cyberspace, it can subsequently control or manipulate information for its own limited purposes, particularly by preventing the escalation of war toward its total form…access to information through networked communications systems provides a decisive advantage to military forces by allowing for “analyses and synthesis across a variety of domains” that enables rapid and informed decision-making at all echelons. The greater a decision advantage one military force has over another, the less costly military action becomes. Secondly, the ubiquity of networked information technologies creates an alternative way for actors to affect targets that would otherwise be politically, geographically, or normatively infeasible to target with physical munitions. Finally, actors can mask their activities in cyberspace, which makes attribution difficult. This added layer of ambiguity enables face-saving measures by opponents, who can opt to not respond to attacks overtly without necessarily appearing weak. In essence, cyber power has become particularly useful for states as a tool for preventing conflict escalation, as an opponent’s ability to respond to attacks becomes constrained when denied access to communication networks. Societies’ dependence on information technology and resulting vulnerability to computer network attacks continues to increase, indicating that interstate violence may become much more prevalent in the near term if aggressors can use cyberattacks to decrease the likelihood of escalation by an adversary.” | Surprise. This article caused me to expand my mental model based on a more detailed understanding of the logic that could guide nations’ use of cyberweapons in future conflicts, and how a cyber advantage could actually lead to an increased probability of kinetic conflict. |
| “How China’s Middle Class Views the Trade War”, by Cheng Li in Foreign Affairs. | Up to now the middle class has quietly criticized Xi; but harsher trade sanctions may shift them to blaming Trump. |
| “National Will to Fight” by McNerney et al from RAND Corporation | Surprise. The authors “define national will to fight as the determination of a national government to conduct sustained military and other operations for some objective even when the expectation of success decreases or the need for significant political, economic, and military sacrifices increases.” They also note that it is “poorly analyzed and the least understood aspect of war.” This initial study is the beginning of an attempt to change that, and improve our mental models for thinking about this critical issue. |
| “Clash of Civilizations – Or Clash Within Civilizations?” by Cropsey and Halem in The American Interest | Surprise. On the 25th anniversary of the publication of Samuel Huntington’s classic essay on “The Clash of Civilizations”, the authors analyze how well this concept has stood the test of time, and how it needs to be modified to better understand interstate conflict drivers in today’s world, including conflicts within and not just between civilizations. It should provide a significant improvement to many people’s mental models of international competition and conflict. It also integrates well with RAND’s “National Will to Fight.” |
| New Social Information: Indicators and Surprises | Why Is This Information Valuable? |
| “Experimental Evidence for Tipping Points in Social Convention” by Centola et al. The authors study “an artificial system of social conventions in which human subjects interact to establish a new coordination equilibrium. The findings provide direct empirical demonstration of the existence of a tipping point in the dynamics of changing social conventions. When minority groups reached the critical mass—that is, the critical group size for initiating social change—they were consistently able to overturn the established behavior…Our theoretical predictions for the size of the critical mass were determined by two parameters: individual memory length (M) and population size (N)…When participants have shorter memories, the size of the critical mass is smaller. Even under the assumption that people have very long memories, the predicted critical mass size remains well below 50% of the population, indicating that critical mass dynamics may be possible even in systems with long histories. Variations in population size were explored computationally were not found to significantly affect the predicted critical mass size. Over all trials, populations with a critical mass equal to or greater than 25% of the population were significantly more likely to overturn the dominant convention than populations with a committed minority below 25%.” | This paper helps to refine our mental model the drivers of sharp changes in sentiment, expectations, and other forms of conventional wisdom in a range of areas, from economics to social values to politics. An interesting question to ponder is whether the current environment of information overload, constant stimulation, and incessant demands for our limited attention has effectively shortened our memories, and thus reduced the percentage of people in a population who can trigger substantial change. |
| “How Persistent are the Effects of Sentiment Shocks?” by Benhabib et al from the Federal Reserve Bank of San Francisco. | The economic effects of negative sentiment shocks can persist for up to five years. |
| “What to Do About Africa’s Dangerous Baby Boom” in the Economist. | “THE 21st century, in one way at least, will be African. In 1990 sub-Saharan Africa accounted for 16% of the world’s births. Because African birth rates are so much higher than elsewhere, the proportion has risen to 27% and is expected to hit 37% in 2050. About a decade later, more babies will be born in sub-Saharan Africa than in the whole of Asia, including India and China. These projections by the UN, if correct, are astounding (see article). There is good reason for the world to worry about Africa’s baby boom…The real problem is that too many babies sap economic development and make it harder to lift Africans out of poverty. In the world as a whole, the dependency ratio —the share of people under the age of 20 or older than 64, who are provided for by working-age people—stands at 74:100. In sub-Saharan Africa it is a staggering 129:100. In stark contrast with most of the world, notably Asia, the number of extremely poor Africans is rising, in part because the highest birth rates are in the poorest parts of the continent. This has clear implications for future economic migrant flows, and potentially for the emergence of more failed states in Africa, and thus refugee flows. |
| “Workers with Low levels of Education Still Haven’t Recovered for the Great Recession”, by the Brookings Institution “Why Lots of Americans are Sour on the Economy” by Noah Smith, on Bloomberg | Clear implications for the potential social and political implications of another severe economic downturn, such as increased polarization and susceptibility to more extreme political solutions. Applies to more countries than just the US – e.g., Jeremy Corbyn in the UK, and the rise of more extreme parties on the continent, which is matched by the lack of strong policy prescriptions and attractive political leaders in the center. Smith notes that many members of the middle and upper middle class are increasingly frustrated, which magnifies the potential for social, political, and economic change. |
| “The Collapse of Civilizations” by Malcolm Wiener, published by the Belfer Center at Harvard’s Kennedy School | The author reviews the historical record and finds five recurring (and often interrelated) causes of civilizational collapse: (1) major episodes of climate change; (2) crisis-induced mass migrations; (3) pandemics; (4) dramatic advances in methods of warfare and transport; and (5) lack of societal resilience and the madness, incompetence, and ignorance of rulers. |
| New Political Information: Indicators and Surprises | Why Is This Information Valuable? |
| Nostalgic reminders of a different and more unified United States – or at least a different political landscape – at Senator John McCain’s funeral at the beginning of September provided a stark contrast to the shocking polarization and extremism on display during the Kavanaugh confirmation hearings at the end of the month. | I experienced firsthand the euphoria in Europe that was triggered by the fall of the Berlin Wall and the collapse of the Soviet Union, which contributed to the enormous psychological shock produced only a few years later by the savage civil wars that accompanied the breakup of Yugoslavia. I often think that the European psyche has never recovered from this whipsaw. While not as powerful, September’s bookend events in US politics cannot help but have produced a similar shock to the US psyche. How it plays out is uncertain at this point; suffice to say that I believe it has widened the scope of what some will see as acceptable political ends and means to pursue. |
| “Are We on the Verge of Civil War? Some Words of Reassurance” by Morris Fiorina | Fiorina’s quantitative analyses of the American electorate are always first rate. In this article, he uses a range of data to argue that we are further away from major political change than many media storylines would have us believe. It is a good antidote to what seems to be the conventional wisdom, at least for the surprisingly small minority of highly politically active citizens. That said, he also notes the importance of the ideological sorting of America’s two main parties (i.e., the disappearance of conservative Democrats and liberal Republicans), and the increased uncertainty this creates about political dynamics in the United States. |
| “America is Moving Towards Oligarchical Socialism” by Joel Kotkin | Surprise. While most political speculation has been focused on the potential implications of rising populist/nationalist movements in the United States, Kotkin provides a provocative alternative view that expands our mental models of the current political situation, and the range of outcomes that could result from progressive dynamics. “Before they can seize power from the president and his now subservient party, the Democrats need to agree on what will replace Trumpism. Conventional wisdom implies an endless battle between pragmatic, corporate Clintonites on one side, and Democratic socialists of the Bernie brand. Yet this conflict could resolve itself in a new, innovative approach that could be best described as oligarchical socialism. Oligarchal socialism allows for the current, ever-growing concentration of wealth and power in a few hands — notably tech and financial moguls — while seeking ways to ameliorate the reality of growing poverty, slowing social mobility and indebtedness. This will be achieved not by breaking up or targeting the oligarchs, which they would fight to the bitter end, but through a massive increase in state taxpayer support.” |
| “The Science Behind the Brexit Vote” by Michele Gelfand in The Guardian | “When people feel threatened, they want tighter social norms.” This fits with other research that finds people to have a stronger preference for conformity when uncertainty is high. This is the appeal of populist authoritarian leaders explained at the level of individual cognitive neuroscience. |
| “The Problem with Populism” by JP Morgan Research. | Like Bridgewater’s report on the increasing attractiveness of populism, and Francis Fukuyama’s recent essays on the same subject (as well as others by Andrew Sullivan, Michael Lind, and Yascha Mounk), this report analyzes the root causes of various forms of populism’s rising appeal, and speculates on the possible consequences if these views grow in political popularity. |
| New Financial Market Information: Indicators and Surprises | Why Is This Information Valuable? |
| Stories on 10th anniversary of the Lehman Bankruptcy | A recurring theme is how little has changed. While very aggressive monetary, and in some cases fiscal policy, staved off a severe and prolonged downturn, little was done to address the underlying causes of the 2008 crisis, which in some ways have arguably become worse over the past decade (e.g., debt levels, inequality, low productivity, corporate concentration, and declining labor share of national income). |
| “The Next Financial Crisis Won’t Come from a Known Unknown” by Robin Wigglesworth in the Financial Times “No Deal Brexit has Big Implications for Europe’s Derivatives Market” by John Dizard in the Financial Times “How Hedge Funds Keep Markets Trading in a Crunch” by Gillian Tett in the Financial Times | Surprise. Wigglesworth highlights that in a complex adaptive system like the global financial markets, crises are most likely to emerge from unanticipated combinations of apparently benign factors. He also notes that since “high frequency trading, quants, passive funds, and options now account for about 90 percent of US equity trading volumes”, this structural change in the market is likely to rapidly accelerate, and potentially exponentially increase the damage caused by whatever combination of causes trigger the next global financial crisis. Dizard suggests one potential cause that is easily overlooked – the post 2008 concentration of derivative trading in a small number of clearinghouses that lack sufficient capital to make good on a rapidly increasing number of failed trades, as might occur if the next crisis produced, as the last one did, an exponential increase in funding/liquidity problems – e.g., for leveraged hedge funds that, as Tett reports, have, since Dodd-Frank imposed higher limits on bank capital, become much more important sources of market liquidity than they were in 2008. |
| The FTSE All World ex US index results compared to US equity market returns. Through September, the rest of world is down (5.26%), while the US is up 8.96%. But gains in the US are narrowly concentrated: FTSE Health, up 16.1%; Consumer Services, 18.5%, and Technology, 19.1% | Narrow markets imply a high degree of social learning and imitation, which is a hallmark of situations characterized by high uncertainty and elevated potential for sudden and substantial changes and regime shifts. |
How Close is the Macro System to One or More Critical Thresholds?
As we have noted, the macro drivers of financial market regime changes typically follow a rough chronological sequence, from technology to economic, security, social, and political causes and effects. Yet there are many feedbacks loops between them, creating complex root causes for many of the critical thresholds we have identified.
Understanding the time dynamics in this complex system is critical to avoiding substantial downside investment risk.
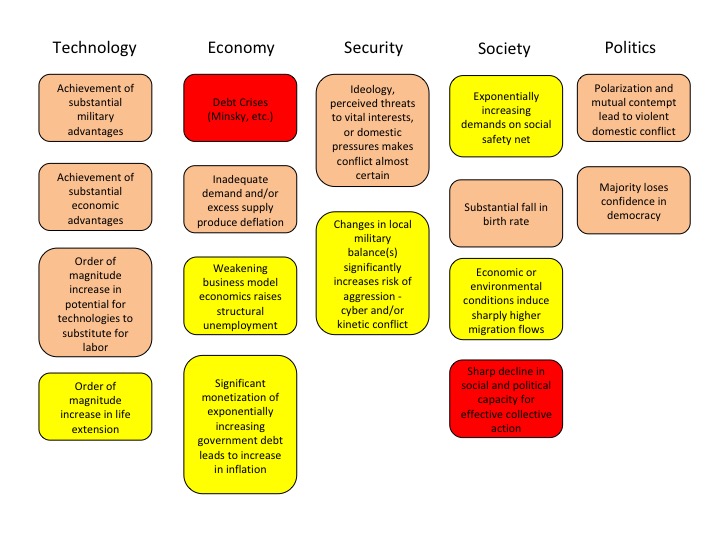
We use the UK Met Office Warning Model to communicate our assessment of these time dynamics. We estimate the time remaining before a critical macro system threshold is reached that could trigger a regime change, which is usually accompanied by substantial changes in asset class valuations.
The model uses three increasingly serious levels of warning, from “Be Aware” (condition yellow), to “Be Prepared” (condition orange), to “Take Action” (condition red).
For our purposes, we denote as “Be Aware” (yellow) critical thresholds that we assess to be three or more years away. We estimate that “Be Prepared” (orange) thresholds could be reached within 1 to 3 years. “Take Action” thresholds are very likely to be reached within one year.
Given their nature, we also note that in our three “wildcard” areas (Environment and Energy related; Disease and Human Caused Bioevents; and Cyber and Electromagnetic Events), our forecasts have higher levels of uncertainty.
The following charts summarize our estimate, at 28 September 2018, of the time remaining before different critical thresholds will be reached.
As described in our August 2018 issue, at the highest level, we believe the global macro system can be in one of four states, based on its degree of order versus disorder, and degree of social cooperation versus conflict. From that perspective, we judge the macro system to currently be in its most uncertain state, with a high degree of disorder and conflict in many areas. For that reason, at the end of September 2018, we believe that there is now a 95% probability that financial markets will shift from the normal regime to the high uncertainty regime within the next 12 months, which will trigger a fall of 20% or more in the value of all equity asset classes.
It is unlikely that any other asset class will experience a gain of 20% or more. There is a roughly even chance that gold could be the exception, and see a 20% or higher price increase. While the apparent inflation and political uncertainty premia in the gold price today are high relative to the last 25 years, they are still below the peak reached in 2012, and it is possible that herding in the face of higher uncertainty could produce 20% price gains.
Of greater importance to investors is the financial markets regime that will emerge after the period of high uncertainty. We currently believe that there is a 75% probability that it will be the persistent deflation regime. As we have noted, there are many deflationary forces at work in the macro system today, including growing excess production capacity, weakening aggregate demand, economic profits that are under growing pressure and increasingly concentrated, worsening income inequality, and dangerously rising debt levels.
Pre-Mortem Analysis
One of the most important forecasting disciplines is to ask yourself why your forecast could be wrong. Dr. Gary Klein’s research has shown that a very powerful and insightful way to do this is via a “pre-mortem analysis.” This method asks you to assume that it is a point in the future, and your forecast has been proven wrong (or your strategy or company has failed). You are then asked to look backward from this imagined point in the future, to explain why you failed, what you missed, and what you could have done differently to avoid your fate.
The pre-mortem method takes advantage of the fact that humans reason much more concretely and in more detail when explaining the past than they do when trying to forecast the future.
So let us assume that it is one year from now, and the high uncertainty regime has not materialized; instead, we are still in the normal regime and equity markets have continued to deliver positive returns.
How did this happen? What didn’t we anticipate happening?
Perhaps because of an intensifying domestic debt crisis (and its own fear of Japanese-style deflation), or a belief that it had not yet achieved sufficient advantages to pursue more intense conflict with the United States, China reached a new trade agreement with the US and EU to support continued economic growth. This reverses (at least in the short-term) the growing tension in the US/China relationship, providing a strong confidence boost to the world economy and financial markets.
Donald Trump’s replacement by Mike Pence, as well as divided party control of the US Congress after the 2018 mid-term elections led to new bipartisan initiatives to improve the productivity of the US healthcare system, address stagnant middle class incomes, and reduce high levels of concentration in many industries. These and other structural changes contributed to higher expected growth rates, which, along with a more predictable and internationally focused United States, increased global confidence and delayed a shift into the high uncertainty regime.
Note: Combining this Forecast with Others and Extremizing the Result Should Increase Predictive Accuracy
Research has found that three steps can improve forecast accuracy. The first is seeking forecasts based on different forecasting methodologies, or prepared by forecasters with significantly different backgrounds (as a proxy for different mental models and information). The second is combining those forecasts (using a simple average if few are included, or the median if many are). The final step, which significantly improved the performance of the Good Judgment Project team in the IARPA forecasting tournament, is to “extremize” the average (mean) or median forecast by moving it closer to 0% or 100%.
Forecasts for binary events (e.g., the probability an event will or will not happen within a given time frame) are most useful to decision makers when they are closer to 0% or 100% than the uninformative “coin toss” 50%. As described by Baron et al in “Two Reasons to Make Aggregated Probability Forecasts More Extreme”, forecasters will often shrink their probability estimates towards 50% to take into account their subjective belief about the extent of potentially useful information that they are missing.
When you average multiple forecasters’ estimates, you are including more information, which should increase forecast confidence and push the mean estimate closer to 0% or 100%. However, this doesn’t happen when you use simple averaging. For this reason, forecast accuracy is increased when you employ a structured “extremizing” technique to move the mean estimate closer to 0% or 100%.
You can download an extremizing model from our website to use when combining the forecasts you use in your decision process. The extremizing factors in our model are those that the Good Judgment Project found maximized the accuracy of combined forecasts. Note that the extremizing factor is lower when average forecaster expertise is higher. This is based on the assumption that a group of expert forecasters will incorporate more of the full amount of potentially useful information than will novice forecasters.
Feature Article: Why After a Period of High Uncertainty Persistent Deflation is More Likely than High Inflation
As far back as our May 2001 issue (“What is a Liquidity Trap and Why Should I Worry About It?”) and November 2002 issue (“Are We Headed Toward Global Deflation?”) we have been concerned about the macro system shifting into a persistent deflation regime, like the one Japan has been in since multiple bubbles collapsed there more than 25 years ago. And central banks have worked enormously hard – and creatively – to prevent this from happening. But they could not forever forestall the arrival of the deflationary regime on their own – and the fiscal and structural reforms that should have accompanied their monetary efforts have largely been blocked by polarized and gridlocked political systems. As a result, debt/GDP has continued to increase, and real deflationary forces have grown stronger by the year.
In this article, we will present the logic behind our conclusion that it is far more likely that the High Uncertainty Regime will be followed by the Persistent Deflation Regime than the High Inflation Regime. We also acknowledge that there is a slight probability that rather than either of these regimes, the high uncertainty may be followed by a return to the Normal Regime. The Pre-Mortem analysis is the preceding section describes two causal logics for this outcome.
Commentators often cite two different types of deflation, which they call “good” and “bad”. In this analysis, we will add one more: “terrible.”
In the case of “Good Deflation”, a sustained decline in the average price level is caused by so-called “supply shocks” – that is, a sudden increase in the supply of goods and services that is not offset by an increase in demand for them. An excellent example is the declines in prices that characterized the substantial expansion of output in the United States as the industrial revolution accelerated during the latter half of the 19th century.
In the case of “Good Deflation”, declining prices raise the effective purchasing power of consumers’ income, which can lead to a “virtuous cycle” rise in living standards and an increase in aggregate demand.
In contrast, “Bad Deflation” is caused by a sudden and sustained fall in aggregate demand relative to the capacity of the economy to supply goods and services. In this case, the beneficial impact of falling prices is offset by declining incomes and delayed spending as precautionary savings increase. In the absence of prompt monetary and fiscal policy action, this can trigger a “vicious cycle” of further falls in both aggregate consumption and investment spending which drive continuing price cuts. The Great Depression of the 1930s is often cited as an example of “Bad Deflation”.
As famously described in 1933 by the economist Irving Fisher, what we call “Terrible Deflation” results when “Bad Deflation” occurs in an economy that already has a high level of debt relative to either GDP (a stock), or to income (i.e., debt service/income, a flow).
Deflation raises the real value of debt and debt servicing expense; hence, in the presence of high debt levels, Bad Deflation results in both sharper reductions in spending than would otherwise occur, as well as more debt defaults, both of which drive greater falls in aggregate demand and a worsening of the vicious cycle.
A key issue is the extent to which good, bad, and terrible deflation drivers are present in today’s economy.
Clearly, there have been positive supply shocks in the global economy over the past 20 years that have put downward pressure on the prices of many goods and services (and in many cases improvements in their quality as well). These include the entry of China into the world trade system and the globalization of supply chains, the introduction of more efficient business models (e.g., Walmart and Amazon) enabled by improving technology, and productivity improvements in agriculture, energy, and manufacturing.
In recent years, however, one can argue that we have seen even more negative shocks to aggregate demand. These include population aging (older people tend to spend less), reduced labor share of national income, stagnant real wages, worsening inequality (consumption spending generally increases more slowly than income and wealth), and substantial increases in healthcare costs that have left less money to spend elsewhere. And in some places, state and local taxes have increased to cover the rising costs of social safety net benefits and public sector pension plans.
What is most worrisome, however, is that despite the 2008 financial crisis and its aftermath, debt levels (and debt/GDP) have continued to increase – and only extraordinary monetary policy actions have kept interest rates at very low levels, and thus prevented this increase in debt from also causing a destabilizing increase in debt service payments as a percent of household or business income (which would lead to less consumption and investment spending and/or higher defaults).
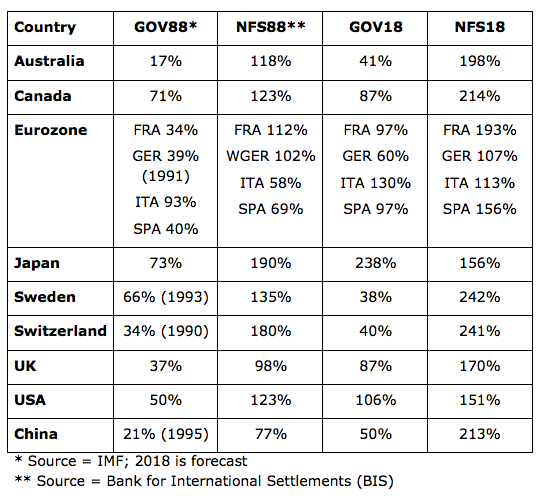
The following table shows the increase in general government debt and private non-financial sector debt (households and non-financial corporations) as a percent of GDP between 1988 and 2018:
The next table (from the BIS), shows debt service payments (interest and principal) as a percentage of income for households (HH) and non-financial corporate borrowers (NFC), as of the first quarter of 2000 and the first quarter of 2018.
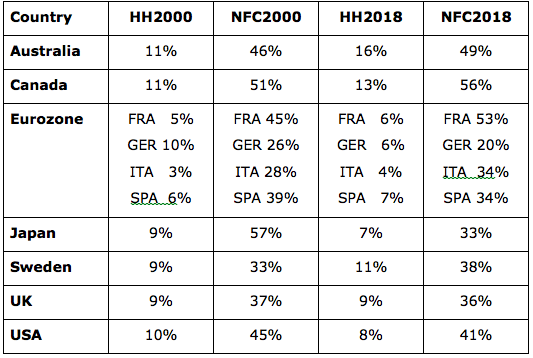
As you can see from these two tables, while non-financial sector Debt/GDP has substantially increased, debt service ratios rose by far less (and in some cases fell), reflecting the sharp drop in interest rates over the period covered by the BIS data (3Q2000 to 3Q2018). For example, the yield on the 10-year US Treasury fell from 6.13% to 2.79%.
Of course, the other implication of these data is that any significant increase in current low nominal rates of interest, or a further decline in aggregate demand and household and non-financial corporate sector income could quickly produce a sharp increase in financial distress and debt defaults.
Another critical point is that when the next economic downturn inevitably occurs, most major country governments will have little in the way of monetary and fiscal “firepower” available to counteract it.
Repeated rounds of quantitative easing since 2008 have sharply expanded the money supply, and cut nominal interest rates to very low levels. As a general rule of thumb, central bankers prefer to have policy room for up to a 500 basis point (5%) cut in interest rates to provide monetary stimulus to fight a downturn. They clearly don’t have that room today, as we are too close to the “zero lower bound” on nominal interest rates. Rather than a concern about inflation, we believe that it is the desire to rebuild future “policy space” that has been driving the US Federal Reserve’s moves to increase interest rates.
In many countries, fiscal policy space is similarly constrained, in this case by already high government debt levels (and note that reported debt levels to not include large and unfunded government liabilities for future social security and public sector pension benefits). This does, however, assume a degree of reluctance on the part of governments and their central banks to aggressively monetize expanding fiscal deficits. As Japan has shown, the longer deflation persists, the weaker this resistance becomes.
That leaves structural reform – e.g., to regulations, etc. – as the main policy tool that governments will have available to fight the next downturn. However, given the increased political polarization and gridlock that exists in many countries today (as well as the effective lobbying efforts of entrenched interest groups), the probability that structural policy will be effectively used seems low.
Finally, add to this grim outlook the ongoing adoption of automation and artificial intelligence technologies which, in the absence of an unlikely substantial improvement in education system performance, will at best put further downward pressure on the profitability of many business models and on employee wages, and at worst on total employment (forcing governments to devote more of their budgets to social safety net spending).
We will be very lucky indeed if this does not lead to an increase in financial distress and debt defaults, and development of a terrible deflation, which, as Japan has shown, can persist for years.
Let us now turn to the alternative hypothesis – that the High Uncertainty Regime will give way to High Inflation. There are two ways this could happen. The first would be a substantial negative supply shock, such as a sharp decrease in the supply of oil (e.g., due to Iran its threat to mine the strait of Hormuz), or massive crop failures (e.g., due to larger than expected changes in global temperatures).
In the second scenario, governments would increase spending to fight a potentially deep downturn, finance this spending with debt, and then monetize that debt by having it purchased by their central banks. This is not dissimilar to what was done in the wake of the 2008 crisis – yet in the face of powerful deflationary forces, that clearly did not cause a sharp increase in inflation rates.
This is not to say that at some point in the future this will not happen, as history repeatedly demonstrates. But at this point our conclusion is that the probability of the High Uncertainty Regime transitioning to the High Inflation Regime is substantially lower than the probability that it will give way to the Persistent Deflation Regime, in spite of policymakers’ strong desire to avoid this outcome.
If you have any questions about anything we have written in this issue, please don’t hesitate to get in touch, at contact@indexinvestor.com.