The Index Investor
November 2018
Key Takeaways
- Based on global developments in October and through the US midterm elections in November, we conclude that we have transitioned from the Normal Regime to the High Uncertainty Regime. This should lead to falls of 20% or more in all equity asset classes.
- How long the High Uncertainty Regime will last, and which regime will follow it are now our key forecasting questions. At this point, we believe that over the next 12 months there is a low probability of either a return to the Normal Regime or transition to the High Inflation Regime (issues surrounding the latter are the subject of this month’s feature article).
- The probabilities are much more closely divided between staying in the High Uncertainty Regime for at least the next 12 months, and slipping into the Persistent Deflation Regime.
Asset Class Valuation and Momentum Indicators (@31Oct18)
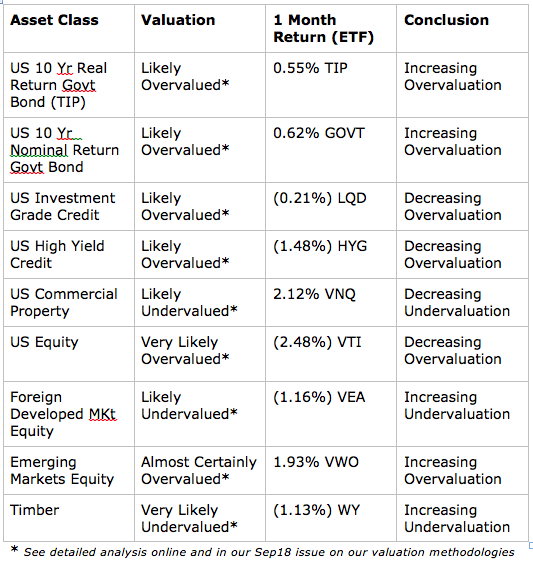
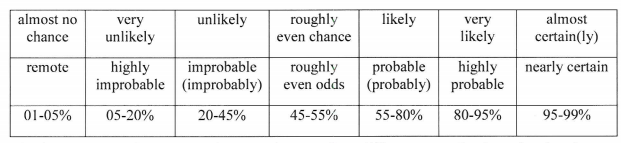
Note: The language we use to describe our estimated likelihood of asset class over or undervaluation is based on US Intelligence Community Directive 203 on Analytic Standards, which includes the following table:
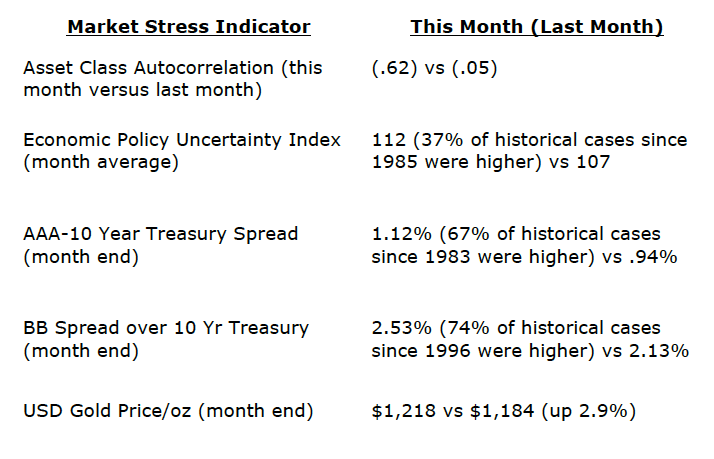
Market Stress Indicators (@31Oct18)
Compared to September, all five of our indicators have risen, which implies an increased by not yet critical level of underlying stress in financial markets at the end of October 2018, and thus a higher risk of substantial changes in asset class valuations. BB rated bonds’ spread over the 10 Year US Treasury is still just 2.53%, which put it in just the 26th percentile since the series started in 1996. Such low credit spreads on speculative grade bonds are usually a sign of excessive credit growth, which underlies many sources of market stress.
Forecast Discussion
We view financial markets as a complex adaptive system. The size of changes generated by such a system follows a power law rather than a normal (Gaussian) distribution. The critical point is that large changes are much more common in complex adaptive systems than most people’s intuition leads them to believe.
While predicting the behavior of complex adaptive systems remains far more art than a science, various researchers have found that large changes in these systems are often preceded by subtle warning signs, as stress accumulates within them. While this research is not definitive, we believe that five warning signs are worth monitoring as potential indicators of growing stress within financial markets that could suddenly give rise to large changes in asset class valuations.
Our first indicator is the month-to-month autocorrelation of broad asset class returns (i.e., the relationship of this month’s returns to last month’s). A system under increasing stress loses resiliency, causing it to take longer to recover from perturbations; hence, autocorrelation increases as it approaches a critical transition (see, “Early Warning Signals for Critical Transitions” by Scheffer, et al).
The one-month autocorrelation of returns for the broad asset classes we monitor increased to (.62) in October (.05) in September. This indicates that financial markets are becoming more ordered and are closer from a critical transition point than they were last month.
The second market stress indicator we monitor is the Equity Market Related Economic Policy Uncertainty Index published by the Federal Reserve Bank of St. Louis (via its FRED economic database), which is based on research by Baker, Bloom, and Davis (see their paper, “Measuring Economic Policy Uncertainty”). The index is based on automated text analysis of leading newspapers and magazine publications, to identify the frequency with which words and phrases are used that indicate uncertainty.
In our evolutionary past, when uncertainty increased our probability of survival was enhanced by staying close to our group. We still have that instinct. Research has found that as uncertainty increases, we have an unconscious bias towards higher conformity of our own views with those of a larger group (i.e., reduction in cognitive diversity). Behaviorally, heightened uncertainty induces more “social copying” of others, likely due to both conformity bias and the rational belief that others may be acting on the basis of superior information. This increase in conformity and copying makes a social system more ordered as uncertainty increases, and also reduces its responsiveness to perturbations (i.e., increases autocorrelation) because of delays in the social copying process.
The key point is that increasing uncertainty induces more, not less order in social systems, and in so doing primes them for sudden non-linear change.
For the month of October, the average Economic Policy Uncertainty Index stood at the 63rd percentile of its values since the data series began in 1985 – to be clear, 37% of values were higher over that period. However, our measure of intra-month uncertainty (the number of daily changes in the top and bottom 20% of the historical distribution) was in the 82nd percentile at the end of the month-- in just 18% of rolling 30-day periods since 1985, has it been higher. This is a very significant increase since the end of September. To reiterate the point made above, high levels of uncertainty tend to cause people’s opinions to become more ordered, due to a higher tendency toward conformity and social copying. This primes a system for sudden, non-linear change.
Our third market stress indicator is the spread between the yield on AAA rated bonds and the 10-year US Treasury. We interpret this as a proxy for the level of investor concern about financial system liquidity. At the end of October 2018, this spread stood at 1.12%, which was the 33rd percentile of all observations since the index series began in 1983 – 67% of observations have been higher.
Our fourth market stress indicator is the yield spread between speculative BB rated bonds and the ten-year US Treasury. Throughout history, excessive credit growth has been a root cause of many financial crises. An indicator of such growth is falling credit spreads, particularly in the case of riskier borrowers. At the end of October, this spread was only 2.53%, which put it in the 26th percentile of spreads recorded since this data series began in 1996 – 74% the previous observations were higher.
Our fifth market stress indicator is what we term the implicit “political risk premium” that is implicit in the price of gold. Our starting point for estimating this premium is the three different roles that gold plays. First, gold is a store of value in a world of fiat currencies. When the rate of money supply growth exceeds the growth of nominal GDP, gold’s price should increase to maintain its purchasing power.
Between 2007 and 2017, the US money supply (M2) grew by about 86%, while nominal US GDP grew by 35%. The stock of gold grew by 18%, based on mine production over this period. We therefore infer that 33% of the increase in the price of gold represented the maximum potential gold price change that could be attributed to a desire to hedge inflation risk (86% less 35% less 18%).
Second, gold is a unit of account. We take this to mean that the annual change in GDP expressed in terms of physical gold (i.e., nominal GDP divided by the price of gold) should equal the change in real GDP calculated using the GDP price deflator to account for actual inflation over the period. A key challenge is the point at which to start this calculation.
We chose the price of gold in 1995/1996. In that period, the change in real global GDP measured using the IMF’s price deflator just about equaled the change in GDP measured in terms of physical gold. We interpret that coincidence as indicating that at that point in time, concerns about future inflation and political risk were minimal, and the change in the price of gold was mostly driven by its role as a unit of account. We calculated a subsequent series of gold prices that would produce the same change in “gold GDP” as the actual real GDP as calculated by the IMF. Between 2007 and 2017, “gold as a unit of account” warranted a 21% increase in its price.
Gold’s third role is as a hedge against inflation and what we term “political disaster” risk. We subtract the 21% estimated compensation for actual inflation from the 33% “gross” inflation risk hedge to derive an apparent 12% increase in the gold price that reflected the true risk premium to hedge against possible future inflation.
However, between 2007 and 2017 the price of gold actually increased by 81%. This implies that 48% of this (81% less 21% less 12%) represented a premium for some other type of uncertainty at the end of 2017.
The interesting question is the nature of the uncertainty for which gold is believed by some investors to be a superior hedge than traditional ports in a storm like short-term US government securities, or similar securities issued by other developed countries.
The logical inference is that the uncertainty in question must reflect a situation in which short term US Treasuries would be a less effective hedge than gold. This could be a world of widespread hyperinflation, capital controls, and/or radical changes in nations’ governments (of course, this would also imply a preference for investing in gold coins rather than bullion, as while the latter may be a store of value, it is far less convenient as a means of paying for transactions).
To put this in further perspective, this gold price “disaster risk” premium sharply increased from 2008 to 2012, then declined before sharply increasing again after 2016. Arguably, a significant part of the former increase reflects concerns about the potential inflationary consequences of dramatic quantitative easing by central banks. But this is not likely to be the case after 2016.
Over the last month, the price of gold rose by almost 3%. Through October 2018, the price of gold has fallen by about 6% since the end of 2017, so, on a rough approximation, the political uncertainty premium now stands at about 42%, compared to 39% at the end of August.
Macro Regime Forecast and Implications for Asset Class Values
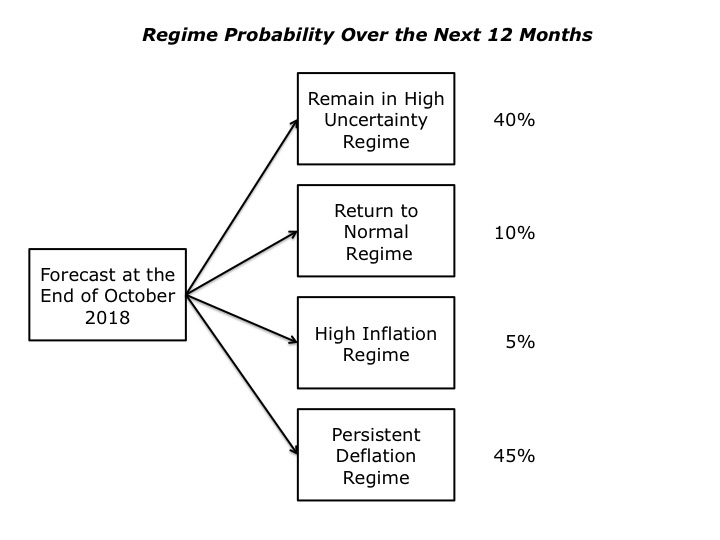
Based on new information collected and analyzed this month, and the result of the November mid-term elections in the United States (for which we delayed publication this month), we have concluded that we are entering the High Uncertainty Regime, which will eventually produce a fall of 20% or more in the value of all equity asset classes. Our forecasting question has thus become, what is the probability we will either remain in this regime or enter a different one over the next twelve months?
At this point, we estimate there is a 40% chance of remaining in the High Uncertainty regime over the next 12 months, which will see the commencement of what promises to be a tumultuous US presidential campaign, as well as resolution of the Brexit saga (or at least the “end of the beginning”, and possibly the “beginning of the end”). Elsewhere in Europe French president Macron’s reforms are running into stiffening resistance, Germany continues to search for a successor to Angela Merkel, and there is much uncertainty about whether Italy will trigger another Eurozone crisis (which, because of its size, will be much more dangerous than the ones we have seen thus far). And in Asia, China will continue to struggle with an intensifying trade conflict with the United States and rising domestic stress as the economy slows, and the consequences of its unprecedented debt growth become more painfully apparent.
We conclude that over the next 12 months, the probability of returning to the Normal Regime is slight, at 10%. For reasons we cover in more depth in this month’s feature article, we also believe that the probability of entering the High Inflation regime over the next 12 months is also slight, at only 5%.
We estimate that the probability of entering the Persistent Deflation Regime over the next 12 months is 45%. With the waning in the US of the stimulative effect of the Trump tax cuts, the negative impact of prolonged uncertainty will have an increasingly negative effect on aggregate demand. This will be magnified by the substantial amount of debt that has been taken on by many companies, which more of them will likely struggle to service, which in turn will put more pressure on their cost structures, and potentially lead to increased unemployment, which will accelerate the downward spiral.
Forecast Methodology
The focus of our monthly macro forecast is twofold. First, the probability of a change in financial market regime that causes changes of 20% or more in asset class valuations over the next year. Second, contingent on such a change taking place, the probability of a subsequent transition to other regimes.
Our analysis focuses on four possible macro regimes: (1) Normal Times, where equity asset classes perform well; (2) a High Uncertainty regime that is usually short and transitory, where asset classes like short-term government bonds perform best; (3) High Inflation, where commercial property, real return bonds and other traditional hedges are favored; and (4) Persistent Deflation, which up to now has only been seen in Japan, and in which the relative performance of different asset classes remains most uncertain.
Our forecasting methodology is derived from our experience on the Good Judgment Project, as described in the book, “Superforecasting” by Gardner and Tetlock, as well as a range of other sources, from the intelligence community to systems dynamics and complex adaptive systems to statistics and political economy.
We start with base rate/reference case data about the historical probability of large changes in equity and bond valuations. We then analyze the current situation from both a quantitative and qualitative perspective. In the latter, we focus on the key endogenous drivers of macro regime change, including technological, economic, national security, social, and political trends and uncertainties. We also focus on three potential sources of exogenous shocks that could also produce a macro regime change, caused by environmental, disease, and cyber related events.
While most of our attention typically focuses on various flows (e.g., economic growth, change in the price level, sales, earnings, job creation, etc.), endogenously caused regime changes result when those flows push key stocks beyond a critical threshold or tipping point, often setting off non-linear reactions across multiple areas. As noted by Hyman Minsky and others, a classic example is the steady accumulation of outstanding debt until it reaches the point where it can no longer be serviced and triggers a crisis.
Base Rate Data
Since the end of World War Two, there have been fifteen months where a downturn in the US equity market began that eventually reduced asset class value by 20% of more. That is a hazard rate of about 1.75% per month. Put differently, in any given month there is a 98.25% probability that a 20%+ downturn won’t occur, or, in a given year, an 81% probability.
However, as the time without a 20%+ downturn extends, the compound probability that one will not occur shrinks. At the end of August 2018, it is more than nine years since the last equity market decline of 20% or more. The probability of that happening is only 15%.
To estimate the base rate for a 20% fall in bond prices (which historically has been caused by a sharp increase in inflation, as we saw in the late 1970s and early 1980s), we analyzed monthly historical AAA bond yields since 1919. For consistency, we used them to calculate the price of a ten-year zero coupon bond. We then calculated the probability of a price decline of 20% or more over three different holding periods: 12, 18, and 24 months. In any month, the annualized probability of a decline of 20% or more over the subsequent 12 months is 12%; over 18 months, 20%, and over 24 months, 25%.
The Current State of Quantitative Regime Predictors
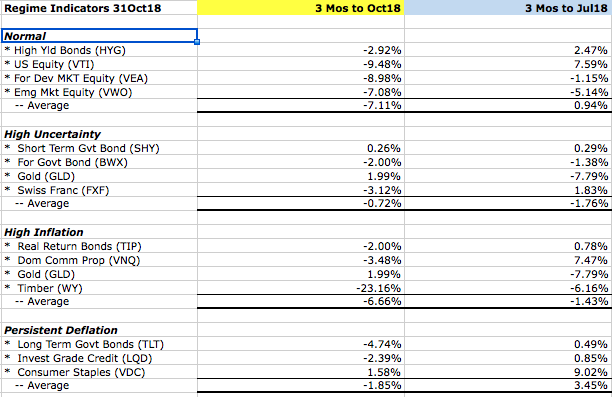
Our quantitative methodology focuses on the level and change in three-month returns, over the most recent and previous three-month periods, for those asset classes which should perform best under different regimes.
As you can see in the following table, at the end of October 2018, this analysis indicates that, over the next 12 months, the balance of expectations appears to favor a shift to the High Uncertainty Regime, with a subsequent change to the Persistent Deflation Regime.
Like Professors Andrew Lo, Doyne Farmer and others, we regard financial markets as a complex adaptive system (CAS), that exist as part of a larger macro system comprised of other CAS between which there are multiple feedback loops. These other systems include those that produce technology innovations, and economic, environmental, national security (including cyber), social, demographic, and political outcomes.
We also find that these systems tend to operate and generate effects in a rough chronological sequence, albeit with many feedback loops between them. The following chart highlights that the changes we observe in different areas at any point in time are actually part of a much more complex evolutionary process.
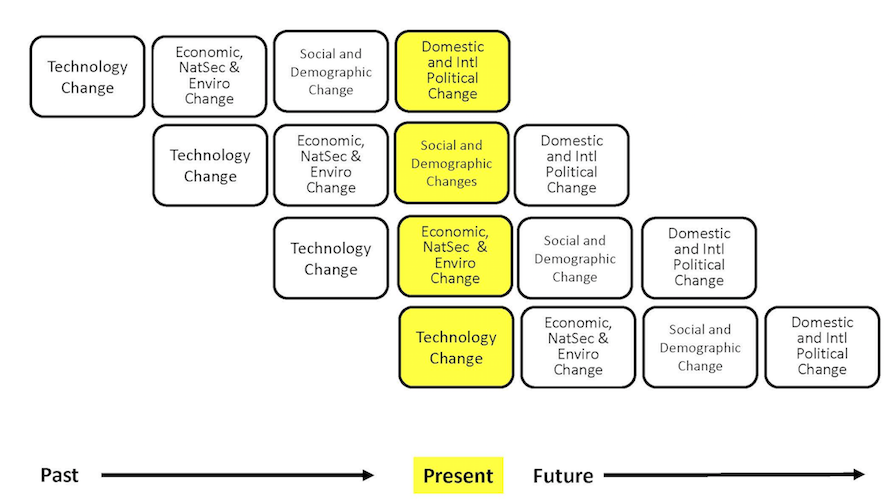
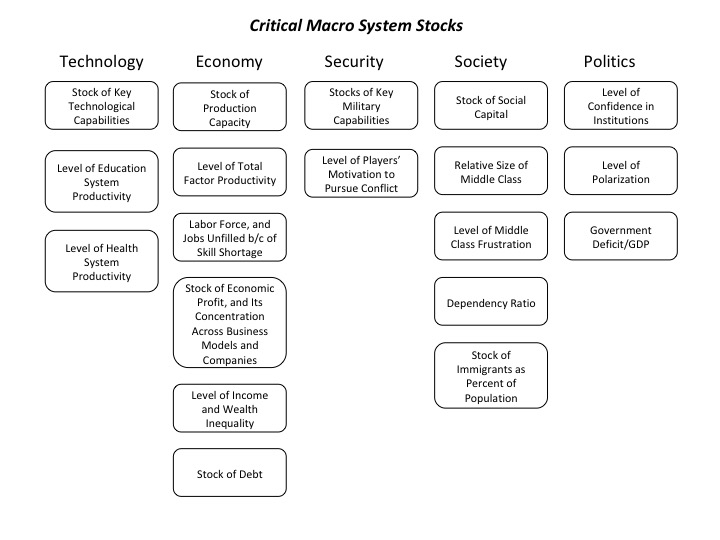
While most media coverage of these systems focused on flows (e.g., the size of the government deficit), rapid non-linear change in complex adaptive systems is often caused by a key stock (e.g., the amount of outstanding government debt) exceeding a critical threshold.
The next table highlights the key macro system stocks that we monitor.
In the next section, we will discuss information received over the past month that is related to these stocks, and which we believe is significant to our assessment of the probabilities that a critical threshold will be reached and a regime change will occur. We will conclude with our estimate, at the end of this month, of how close the macro system is to these critical thresholds, and the implications for financial market regime change probabilities.
In our methodology, new information is valuable insofar as it provides an updated indicator of how close we are to a critical threshold, or it is surprising and causes us to question the structure of our overall system model (e.g., the existence of another critical threshold we should monitor, or the range of possible outcomes for a key uncertainty).
| New Technology Information: Indicators and Surprises | Why Is This Information Valuable? |
| “Using Machine Learning to Replicate Chaotic Attractors”, by Pathak et al | SURPRISE. Advances in a machine learning area known as “reservoir computing” have led to the creation of a model that reproduced the dynamics of a complex dynamical system. If this initial work can be extended it represents a significant advance. That said, this is not the same thing as AI learning and being able to reproduce and predict the dynamic behavior of a complex adaptive system, such as financial markets, and economies. |
| “The Impact of Bots on Opinions in Social Networks” by Hjouji et al | Using both a model and data from the 2016 US presidential election, the authors conclude that “a small number of highly active bots in a social network can have a disproportionate impact on opinion…due to the fact that bots post one hundred times more frequently than humans.” In theory, this should make it easier for platforms like Twitter and Facebook to identify and close down these bots. The authors also surprisingly found that in 2016 pro-Clinton bots produced opinion shifts that were almost twice as large as the pro-Trump bots, despite the latter being larger in number. |
| “Learning-Adjusted Years of Schooling” by Filmer et al from the World Bank | This valuable new indicator metric combines both the time spent in school and how much is learned during that time. The authors find that LAYS is strongly correlated with GDP growth. They also find wide gaps between countries, with some education systems being much more productive (in terms of learning per unit of time) than others. The good news is that this points to a substantial source of future gains for these economies in total factor productivity, provided their education systems can be improved. |
| “The Condition of College and Career Readiness, 2018” by ACT Inc. | More disappointing results based on a well-known indicator of US K-12 education system performance. About three-fourths (76%) of 2018 ACT-tested graduates said they aspire to postsecondary education. Most of those students said they aspire to a four-year degree or higher. Only 27% met all four C&C ready benchmarks; 35% met none. Readiness levels in math have steadily declined since 2014. Sample size = 1.9m. “Just 26% of ACT-tested 2018 graduates likely have the foundational work readiness skills needed for more than nine out of 10 jobs recently profiled in the ACT JobPro® database. This has significant (and negative) implications for future productivity and wage growth. |
| New Economic Information: Indicators and Surprises | Why Is This Information Valuable? |
| “Fragile New Economy: The Rise of Intangible Capital and Financial Instability” by Ye Li | The rising amount of intangible assets on corporate balance sheets that can’t be pledged as loan collateral has led to higher corporate prudential savings. However, this has also caused banks to bid up the prices of (and lower the yields on) risky assets in which they invest these funds (e.g., BB rated bonds). This is creating a hidden source of rising risk in the global financial system. |
| “The Secular Decline in US Employment Over the Past Two Decades” by Abraham and Kearney | “Labor demand factors – notably import competition from China and the rise of industrial robots – emerge as the key drivers of employment decline. Some labor supply and institutional factors (increased disability benefits, higher state minimum wages, and increased incarceration rates) also have contributed to the decline, but to a lesser extent.” The first conclusion echoes one reached by David Autor and his colleagues in their 2016 paper, “The China Shock: Learning from Labor Market Adjustment to Large Changes in Trade.” These are significant findings that will further reinforce both rising conflict between China and western nations, as well as debates over appropriate domestic policies to address employment declines. |
| “Superstars: The Dynamics of Firms, Sectors, and Cities Leading the Global Economy” by Manyika et al, McKinsey Global Institute | SUPRRISE. “We define superstar to mean a firm, sector, or city that has a substantially greater share of income than peers and is pulling away from those peers over time… Superstars exist not only among firms but among sectors and cities as well, although we find the trend most evident among cities and firms… “Relative to their peers, superstars share several common characteristics. In addition to capturing a greater share of income and pulling away from their peers, superstars exhibit relatively higher levels of digitization… For firms, we analyze nearly 6,000 of the world’s largest public and private firms, each with annual revenues greater than $1 billion, that together make up 65 percent of global corporate pretax earnings. In this group, economic profit is distributed along a power curve, with the top 10 percent of firms capturing 80 percent of economic profit among companies with annual revenues greater than $1 billion. “We label companies in this top 10 percent as superstar firms. The middle 80 percent of firms record near-zero economic profit in aggregate, while the bottom 10 percent destroys as much value as the top 10 percent creates. The top 1 percent by economic profit, the highest economic-value creating firms in our sample, account for 36 percent of all economic profit for companies with annual revenues greater than $1 billion… “Over the past 20 years, the gap has widened between superstar firms and median firms, and also between the bottom 10 percent and median firms. Today’s superstar firms have 1.6 times more economic profit on average than superstar firms 20 years ago…Today’s bottom-decile firms have 1.5 times more economic loss on average than their counterparts 20 years ago, with one-fifth of them (a growing share) unable to generate enough pretax earnings to sustain interest payments on their debt.” This analysis shows the extreme economic pressures on many business models today, which has implications for both future income inequality (which is exacerbated by the gap between superstar and other firms) and future growth in the real median wage. Both of these have additional implications for potentially intensifying social and political conflict. |
| In its latest extended Z.1 Release – Financial Accounts of the United States – the US Federal Reserve has substantially revised upward its estimate of the size of US public sector pension deficits, based on the use of an estimate of pension funds’ future retirement benefit obligations and the use of an appropriate discount rate, which is much lower than that used by most public sector (but not private sector) defined benefit pension funds. | SURPRISE. Unfunded public sector pension liabilities are a major source of “hidden” public sector debt. Ultimately, they can only be reduced through either much higher investment earnings (which are unlikely in a highly indebted global economy characterized by declining birthrates and stagnant productivity growth), or increased employer pension contributions (which means either cuts in other program spending and/or higher taxes to support retirement benefits for public sector employees which are often much better than those realized by their private sector peers). This is a highly significant move, as it signals that the Fed will no longer silently conspire with state and local politicians to, in effect, hide the true size of public pension debt, that will likely one day force either significant benefit cuts for public employees, and/or significant spending cuts and/or tax increases. This will have further implications for the future ability of state and local borrowers in the United States to access credit markets to fund infrastructure investments. |
| IMF World Economic Outlook, October 2018 edition | The latest WEO’s conclusions are in line with our forecast conclusions. “Growing debt is creating increased financial vulnerabilities in world economy…the possibility of unpleasant surprises outweighs the likelihood of unforeseen good news… With shrinking excess capacity and mounting downside risks, many countries need to rebuild fiscal buffers and strengthen their resilience to an environment in which financial conditions could tighten suddenly and sharply.” “Beyond the next couple of years, as output gaps close and monetary policy settings continue to normalize, growth in most advanced economies is expected to decline to potential rates—well below the averages reached before the global financial crisis of a decade ago. Slower expansion in working-age populations and projected lackluster productivity gains are the prime drivers of lower medium-term growth rates.” |
| “Special Report on World Economy” in The Economist | The Economist’s conclusions are consistent with our own and those in the WEO. The world is “woefully unprepared” for the next recession…” Handling a bout of economic weakness used to be simple: the central bank would cut short-term interest rates until conditions improved. But in the aftermath of the global financial crisis rates around the world fell to zero, and the weak recovery that followed kept them pinned there.” “Even the Fed, which has chalked up the most post-crisis rate increases, will almost certainly enter the next recession with a historically small amount of room to cut rates. In a downturn, central banks are likely to turn almost immediately to other tools used after the 2007-08 crisis, such as [quantitative easing]. But such tools are politically harder to deploy, and their stimulative effects are less certain…” “Fiscal stimulus could pick up the slack, but mobilising government budgets to aid the economy will also prove a tall order. Across advanced economies the average government debt load has risen above 100% of GDP, up more than 30 percentage points from 2007. Debt in emerging markets has risen as well, from an average of roughly 35% of GDP to over 50%. Plans for large-scale fiscal stimulus were politically difficult to enact during the financial crisis, and will be harder still the next time around.” “In Europe, any debate about government borrowing threatens to revive the disastrous political showdowns of the euro-area debt crisis. In the end politics may prove the greatest stumbling block to managing a new global downturn…Most advanced economies now have viable populist or nationalist parties, waiting to capitalise on the first sign of renewed economic distress. Many emerging markets have regressed as well. Nationalism and strongman tactics are in the ascendant.” “Power in China is worryingly concentrated in the hands of one man, Xi Jinping. Thanks to Mr. Trump’s trade war, relations between America and China have become openly hostile.” “In 2007 financial markets were primed for a massive crisis, but governments were able to draw heavily on their monetary, fiscal and diplomatic resources to prevent that crisis from destroying the global economy. Today the financial dominoes are not set up quite so precariously, but in many ways the broader economic and political environment is far more forbidding.” |
| Italy’s new leaders and budget could be setting up a renewed Eurozone crisis. | Because of its size, Italy potentially represents a much bigger problem for the Eurozone than previous crises in Greece, Ireland, and Portugal. Politically, Germany is also less willing to support Eurozone today than it was in previous crises. A crisis in Italy could thus could lead to a significant restructuring of the Eurozone – for example, the departure from the Euro of northern European nations with stronger currencies, which would allow the Euro to significantly depreciate, and thus restore the competitiveness of southern tier economies without forcing even more painful austerity and domestic restructuring of labor and produce markets. |
| “Global Trends in Interest Rates” by Del Negro et al from the Federal Reserve Bank of NY | SURPRISE. “Four main results emerge from our empirical analysis. First, the estimated trend in the world real interest rate is stable around values a bit below 2 percent through the 1940s. It rises gradually after World War II, to a peak close to 2.5 percent around 1980, but it has been declining ever since, dipping to about 0.5 percent in 2016, the last available year of data” … “The exact level of this trend is surrounded by substantial uncertainty, but the drop over the last few decades is precisely estimated. A decline of this magnitude is unprecedented in our sample. It did not even occur during the Great Depression in the 1930s. “Second, the trend in the world interest rate since the late 1970s essentially coincides with that of the U.S. In other words, the U.S. trend is the global trend over the past four decades. In fact, this has been increasingly the case for almost all other countries in our sample: idiosyncratic trends have been vanishing since the late 1970s. This convergence in cross-country interest rates is arguably the result of growing integration in international asset markets.” “Third, the trend decline in the world real interest rate over the last few decades is driven to a significant extent by a growing imbalance between the global demand for safety and liquidity and its supply. This contribution is especially concentrated in the period since the mid-1990s, supporting the view that the Asian financial crisis of 1997 and the Russian default in 1998, with the ensuing collapse of LTCM, were key turning points in the emergence of global imbalances.” “Fourth, a global decline in the growth rate of per-capita consumption, possibly linked to demographic shifts, is a further notable factor pushing global real rates lower.” “An important implication of these findings is that the persistent macroeconomic headwinds emanating from the financial crisis, including the effects of the extraordinary policies that were put in place to combat it, are far from being the only cause of the low-interest-rate environment. “Longer-standing secular forces connected with a decline in economic growth since the early 1980s also appear to be crucial culprits, even though these trends might have been exacerbated by the crisis. “The global nature of the drivers of low interest rates limits the extent to which national policies can address the problem.” |
| The Rise of Corporate Debt Must Be Managed” FT Editorial 31Oct18 | A substantial amount of BB and BBB rated debt is now held in short-term vehicles (mutual and exchange traded funds) with high redemptions likely in the next economic downturn, which in turn would force fire sales and a sharp increase in rates. This would cause financial distress for many borrowers. As the FT’s Robin Wigglesworth wrote back in December 2017, “The Corporate Debt Boom Will Come to a Nasty End” |
| “The Student Loan Debt Crisis is About to Get Worse” by Griffin et al, Bloomberg 17Oct18 | “Student loans have seen almost 157 percent in cumulative growth over the last 11 years. By comparison, auto loan debt has grown 52 percent while mortgage and credit-card debt actually fell by about 1 percent…there’s a whopping $1.5 trillion in student loans out there (through the second quarter of 2018), marking the second-largest consumer debt segment in the country after mortgages…More than 1 in 10 borrowers is at least 90 days delinquent, while mortgages and auto loans have a 1.1 percent and 4 percent delinquency rate, respectively… Student debt has delayed household formation and led to a decline in homeownership. Sixteen percent of young workers aged 25 to 35 lived with their parents in 2017, up 4 percent from 10 years prior.” The growing and as yet unresolved student loan problem in the US reminds us of Herbert Stein’s famous quote: “If something cannot go on forever, it will stop.” |
| New National Security Information: Indicators and Surprises | Why Is This Information Valuable? |
| “Beijing’s Nuclear Option: Why a U.S. – Chinese War Could Spiral Out of Control” by Caitlin Talmadge, in Foreign Affairs (Also, “Would China Go Nuclear?” by Caitlin Talmadge in International Security) | SURPRISE. “The odds of a U.S. – Chinese confrontation going nuclear are higher than most policymakers think.” Chinese nuclear forces are embedded with conventional forces, and thus vulnerable to loss in US deep strike against the latter, which could create a “use them or lose them” situation. |
| “America’s New Attitude Towards China is Changing the Countries’ Relationship” in The Economist 18Oct18 | “A broadly-based interdependence ties Beijing’s pigs to Iowa’s fields, interweaves supply chains and distribution networks across the Pacific and has seen copious Chinese investment in America. That had, until recently, led observers in both China and America to think attitudes like Mr. Trump’s could be nothing but bluster.” “Though relations might be testy from time to time, the economic logic which favoured getting along was simply too strong to ignore. But American unease about China’s growing technological heft, increasing authoritarianism and military strength is now overriding that logic.” “America is undergoing a deep shift in its thinking about China on right and left alike. There is a new consensus that China has a deliberate strategy to push America back and impose its will abroad, and that there needs to be a strong American response”. Meanwhile in China, “Well-connected scholars and retired officials have shared their concerns with Western contacts about a febrile mood within China’s national security establishment. They detect genuine excitement over the prospect of a great-power contest in which China is one of the protagonists. This coincides worryingly with the squeezing of public space for discussion. Scholars are not now supposed to debate foreign policy in the open, and strident nationalists dominate what debate there is.” “Even the idea of an expensive arms race with America strikes some Chinese experts as a fine plan, given their confidence in the long-run potential of their economy. In this dangerous moment, blending grievance and cockiness, it seems astonishing to remember that less than a generation ago Chinese leaders assured the world that they sought only a ‘peaceful rise’.” |
| Many stories about China’s mass detention of several hundred thousand to more than one million Muslim Uighurs in the western province of Xinjiang | China has stopped denying, and is now defending its actions in Xinjiang, calling the camps “vocational and educational training centers”. This further worsens China’s relationship with Western nations, and especially the US. |
| “China Faces a Debt Iceberg Threat, Warns Rating Agency”, Financial Times, 16Oct18 | “China could be facing a “debt iceberg with titanic credit risks” following a boom in infrastructure projects at local governments around the country, rating agency S&P Global has warned.” “Local governments could have accrued a debt pile hidden off their balance sheet as high as Rmb30tn to Rmb40tn ($4.5tn to $6tn) following “rampant” growth in borrowings, said S&P Global.” “The mounting debt in so-called local government financing vehicles, or LGFVs, hit an “alarming” 60 per cent of China’s gross domestic product at the end of last year and was expected to lead to increasing defaults at companies connected to small governments across the country.” |
| This month saw more indicator stories about protests by Chinese homeowners angry at falling prices; by parents angry at the education system; and by veterans angry at their treatment. (The Economist has a story about the broader context of these protests (“Why Protests are So Common in China”) and concludes that they are all indicators of rising social stress. | Protests add to pressure on the Chinese government to stimulate the economy, despite already high debt levels and the declining marginal productivity of debt (the amount of GDP growth produced by additional amounts of debt). While Xi Jinping appears to be firmly in control, protests indicate an underlying level of dissatisfaction, which, at some point, could support rapid change in China. |
| “Danger: Falling Powers” by Hal Brands | SURPRISE. “We often lose sight of a different pathway to great-power war, for peril may emerge when a country that has been rising, eagerly anticipating its moment in the sun, peaks and begins to decline before its ambitions have been fulfilled. The sense that a revisionist power’s geopolitical window of opportunity is closing, that its leaders cannot readily deliver the glories they have promised the population, can trigger rashness and risk-taking that a country more confident in its long-term trajectory would avoid.” |
| “China’s Coming Financial Crisis and the National Security Connection” by Stephen Joske | This article offers a scenario that is an example of Brand’s thesis. |
| “Improving C2 and Situational Awareness for Operations in and Through the Information Environment” by Paul et al from the RAND Corporation | Noting that “defeat is a cognitive outcome” RAND analyzes the extent to which information operations (IO) in the information environment (IE) have been integrated with situation awareness and operations in the land, sea, air, and space environments. The authors conclude that the integration of IE situation awareness and operations with the other environments has, up to now, been weak. This echoes findings from Defense Science Board 2018 Summer Study on “Cyber as a Strategic Capability”, which concluded that, “Current cyber strategy is stalled, self-limiting, and focused on tactical outcomes. The DoD must build and adopt a comprehensive cyber strategy.” |
| US Vice President Mike Pence’s 4Oct18 speech at the Hudson Institute | SURPRISE. Pence effectively declared a new Cold War with China. His speech complemented the new US National Security Strategy that describes “a new era of great power competition.” “America had hoped that economic liberalization would bring China into a greater partnership with us and with the world. Instead, China has chosen economic aggression, which has in turn emboldened its growing military.” “Nor, as we had hoped, has Beijing moved toward greater freedom for its own people. For a time, Beijing inched toward greater liberty and respect for human rights. But in recent years, China has taken a sharp U-turn toward control and oppression of its own people” “By 2020, China’s rulers aim to implement an Orwellian system premised on controlling virtually every facet of human life — the so-called “Social Credit Score.” In the words of that program’s official blueprint, it will “allow the trustworthy to roam everywhere under heaven, while making it hard for the discredited to take a single step.” While there have been many indicators that a return to the previous relationship between China and the United States is increasingly unlikely, this speech was a surprisingly blunt statement that the US administration’s view that the relationship will be characterized by higher levels of conflict in the years ahead. |
| Interagency Task Force Report: “Assessing and Strengthening the Manufacturing and Defense Industrial Base and Supply Chain Resiliency of the United States” Also: GAO Report: “Weapons Systems Cybersecurity” | This new report found significant vulnerabilities, particularly dependence on foreign made components (including components manufactured in China), as well as weakening worker capabilities in the United States. The GAO concluded that, "The Department of Defense (DOD) faces mounting challenges in protecting its weapon systems from increasingly sophisticated cyber threats. This state is due to the computerized nature of weapon systems; DOD’s late start in prioritizing weapon systems cybersecurity; and DOD’s nascent understanding of how to develop more secure weapon systems. DOD weapon systems are more software dependent and more networked than ever before.” “Automation and connectivity are fundamental enablers of DOD’s modern military capabilities. However, they make weapon systems more vulnerable to cyber attacks. Although GAO and others have warned of cyber risks for decades, until recently, DOD did not prioritize weapon systems cybersecurity. Finally, DOD is still determining how best to address weapon systems cybersecurity.” |
| New Social Information: Indicators and Surprises | Why Is This Information Valuable? |
| “Be Afraid? Yes, But Don’t Overdo It” by Adam Garfinkle in The American Interest 29Oct18 | Garfinkle provides a succinct summary of seven important sources of rising individual and group uncertainty and fear that are driving other social and political phenomena: “A technology tsunami that is arguably unprecedented in nature and scope” that is “producing an accelerating cascade of eruptive discontinuities in social life affecting work and the economy more broadly, family structures, and political life.” “Our politics have grown polarized and shrill, our military wins battles but not wars, and our political elites – of both major parties – have consistently made promises that fell short.” “Terrorism has rattled us, starting with 9/11 but continuing through lesser forms of murder and mayhem ever since.” “Broken families produce insecure children; kids who feel emotionally betrayed by those who are supposed to love and protect them often grow into insecure adults, replicating insecurity by often failing to form secure loving bonds.” “Mean World Syndrome – research has demonstrated that people who watch a lot of commercial television and Hollywood shock flicks come to believe that violence, perversion, and plain evil are as plentiful in real life as they are in mass entertainment fiction.” “There has been, arguably, too much immigration too fast into the United States to assimilate in a culture whose swoon in collective self-confidence has made local elites feel guilty about demanding assimilation.” “Finally, since fear is ubiquitous, every civilization has devised ways to manage it. That has typically been accomplished in the context of religious culture. Dangers are easier to cope with when they are seen as something other than completely random and meaningless, when they are integrated into a shared narrative that makes a certain kind of emotional sense. When traditional religious templates erode, as they have in most Western societies in recent times, the frameworks that control the psycho-social impact of fear erode with them. They have been replaced, in a manner of speaking, with the pseudo-religion of the therapeutic, whose obsession with absolute security has only served to make nearly everyone more anxious, not less.” |
| “Well-Being in Metrics and Policy” by Graham, et al | The paper reviews cumulative research findings on the correlates of self-reported well-being. Findings about China were particularly interesting: “China is perhaps the most successful example of rapid growth and poverty reduction in modern history. GDP per capita increased fourfold between 1990 and 2005, and life expectancy increased from 67 to 73.5 years. Yet life satisfaction fell dramatically, and suicide increased, reaching one of the highest rates in the world. The unhappiest cohorts were educated workers in the private sector, who benefited from the growing economy but suffered from long working hours and lack of sleep and leisure time.” This is yet another indicator of underlying domestic fragility in China. |
| “Associations between screen time and lower psychological well-being among children and adolescents: Evidence from a population-based study”, by Twenge and Campbell | This indicator confirms other research that has reached similar conclusions. However, this research is based on a larger sample set than previous studies. “After 1 hour/day of use, more hours of daily screen time were associated with lower psychological wellbeing, including less curiosity, lower self-control, more distractibility, more difficulty making friends, less emotional stability, being more difficult to care for, and inability to finish tasks. Among 14- to 17-year-olds, high users of screens (7+ h/day vs. low users of 1 h/day) were more than twice as likely to ever have been diagnosed with depression, ever diagnosed with anxiety, treated by a mental health professional (RR 2.22, CI 1.62, 3.03) or have taken medication for a psychological or behavioral issue in the last 12 months. “Moderate use of screens (4 h/day) was also associated with lower psychological well-being.” “Non-users and low users of screens generally did not differ in well-being. Associations between screen time and lower psychological well-being were larger among adolescents than younger children.” Going forward, the individual and social consequences of intensive personal technology use seem poised to become a much more contentious issue. |
| “California Feudalism: The Squeeze on the Middle Class” by Kotkin and Toplansky from the Center for Demographics and Policy at Chapman University | Kotkin and Toplansky have provided a very thought provoking analysis of the consequences of a particular mix of progressive policies in California. “California has now taken on an increasingly feudal cast, with a small but growing group of the ultra-rich, a diminishing middle class, and a large, rising segment of the population that is in or near poverty. Indeed, amidst some of the greatest accumulations of wealth in history, California has emerged as a leader in poverty, particularly among its minority and immigrant populations and throughout its interior… “Yet our state leaders, and too many of our business and civic leaders, are convinced that California, far from being something of a cautionary tale, offers a great “role model” for the rest of the country. The state’s drift towards an ever more unequal, feudalized society, characterized by concentrated property ownership, persistent poverty levels, and demographic stagnation does not seem to concern our Sacramento leadership.” The authors describe how this situation has developed in California, and what could alter its present course. |
| “The Genetics of University Success” by Smith-Woolley et al, in Scientific Reports, 18Oct18 See also, “What Does Genetic Research Tell Us About Equal Opportunity and Meritocracy?” by Robert Plomin in Quillette on 15Oct18 | SURPRISE. These studies are further indicators of the rapidly accumulating evidence that the impact of genetics on a wide range of life outcomes is significantly larger than previously thought. In the short term, these findings are very much at odds with both conservative and progressive ideologies, and are thus almost certain to be a source of rising conflict. Over the medium term, these genetic findings will also have substantial policy implications in many areas, not the least of which are education, health, and risk management. “The difference in earnings between high school and university graduates is estimated at $1 million over the course of the lifetime. However, the difference in earnings varies by the type of university attended, as well as achievement at university.” “Furthermore, the benefits associated with obtaining a university education extend beyond earnings, to include better health and wellbeing, higher rates of employment and even increased life expectancy.” “Despite this, little is known about the causes and correlates of differences in university-level outcomes, including entrance into university, achievement at university and the quality of university attended. University success, which includes enrolment in and achievement at university, as well as quality of the university, have all been linked to later earnings, health and wellbeing. However, little is known about the causes and correlates of differences in university-level outcomes. Capitalizing on both quantitative and molecular genetic data, we perform the first genetically sensitive investigation of university success with a UK-representative sample of 3,000 genotyped individuals and 3,000 twin pairs.” “Twin analyses indicate substantial additive genetic influence on university entrance exam achievement (57%), university enrolment (51%), university quality (57%) and university achievement (46%). We find that environmental effects tend to be non-shared, although the shared environment is substantial for university enrolment. Furthermore, using multivariate twin analysis, we show moderate to high genetic correlations between university success variables (0.27–0.76). Analyses using DNA alone also support genetic influence on university success. Indeed, a genome-wide polygenic score, derived from a 2016 genome-wide association study of years of education, predicts up to 5% of the variance in each university success variable”. “These findings suggest young adults select and modify their educational experiences in part based on their genetic propensities and highlight the potential for DNA-based predictions of real-world outcomes, which will continue to increase in predictive power.” |
| “Beyond Four Walls: A New Era of Life at Home” by Ikea | This report is another indicator of the extent of the social transformation underway in many societies, and in particular suggests further erosion of the family and home as fundamental social units. “When we talk about what makes a home, we talk about four dimensions that are shared by everyone: space, place, relationships, and things. Five core emotional needs are connected with the home: privacy, security, comfort, ownership, and belonging. Belonging is the need least satisfied by our residential homes. Today, one in three people around the world say there are places they feel more at home than where they live.” |
| New Political Information: Indicators and Surprises | Why Is This Information Valuable? |
| “Hidden Tribes: A Study of America’s Polarized Landscape” by Hawkins et al for More in Common | SURPRISE. “This report lays out the findings of a large-scale national survey of Americans about the current state of civic life in the United States. It provides substantial evidence of deep polarization and growing tribalism. It shows that this polarization is rooted in something deeper than political opinions and disagreements over policy. But it also provides some evidence for optimism, showing that 77 percent of Americans believe our differences are not so great that we cannot come together.” “At the root of America’s polarization are divergent sets of values and worldviews, or “core beliefs.” These core beliefs shape the ways that individuals interpret the world around them at the most fundamental level. Our study shows how political opinions stem from these deeply held core beliefs. This study examines five dimensions of individuals’ core beliefs…[and[ finds that this hidden architecture of beliefs, worldview and group attachments can predict an individual’s views on social and political issues with greater accuracy than demographic factors like race, gender, or income.” “The [population] segments have distinctive sets of characteristics; here listed in order from left to right on the ideological spectrum: Progressive Activists (8%): younger, highly engaged, secular, cosmopolitan, angry. Passive Liberals (15%): unhappy, insecure, distrustful, disillusioned. Politically Disengaged (26%): young, low income, distrustful, detached, patriotic, conspiratorial. Moderates (15%): engaged, civic-minded, middle-of-the-road, pessimistic, Protestant. Traditional Liberals, Passive Liberals, Politically Disengaged, and Moderates constitute the “Exhausted Majority” that together comprise 67% of the electorate. Their members “share a sense of fatigue with our polarized national conversation, a willingness to be flexible in their political viewpoints, and a lack of voice in the national conversation.” |
| “Yes, It Can Happen Here” by Andrew Michta, in The American Interest, 30Oct18 | This article is another indicator of the how close we may be to a critical threshold related to societies’ capacity for taking collective action to successfully address the most dangerous threats they face. “After decades of multicultural deconstruction of its nation-states, the Western democracies are internally fracturing, and their societal and national bonds are dissolving. Today, thinking about national security in the West means taking stock of the effects not only of the dwindling sense of mutuality of obligation among the citizenry but also of levels of ethnic, racial, and political polarization not seen since the late 1960s. The current fashion for identity politics has advanced to the point that the progressive decomposition of Western nation-states is now a near-term possibility.” “While civilizational collapse may still be a long way off, Western democracies face an erosion of the consensus of what constitutes the larger national community, and hence why its members should rally to defend it in an emergency…since the coming of age of the ’60s generation, the overarching concept of Western cultural affinity as the foundation of national identity in a democracy—one in which an overarching shared heritage can be filled by multiple ethnic narratives but ultimately remains the key trope defining the values at the center of idea of citizenship—has been progressively displaced.” “In a world where national solidarity is increasingly deconstructed by the narratives that have begun to leak into broader society from their wellsprings in the academy and media, tribalism will ultimately render the nation unable to function not just in the area of public policy, but most critically when it comes to national security and defense. If Western culture is nothing but a mechanism of oppression, what is the meaning of Transatlantic solidarity in a crisis? If our nations are little more than shared legacies of shame and systemic injustice, why risk blood and treasure to defend them?” |
| “America’s Resilient Center and the Road to 2020” by the Progressive Policy Institute (Note that PPI, whose motto is “radically pragmatic”, dates from the 1980s; when it was created as a policy development think tank affiliated with the Democratic Leadership Council, which was created to move the Democratic Party back towards the middle of the political spectrum after George McGovern’s presidential defeat.) | SURPRISE. This analysis provides a very thought provoking look at the size of key segments and policy views of US voters at the time of the 2018 midterm election. Democrats (39%) and Democratic leaners among Independents (9%) comprise 48% of the electorate. Republicans and leaners (31 + 8) account for 39%, and true Independents for 13%. On a different, but important dimension, 32% identify as conservative in their views; 44% as moderate; and 24% as liberal (note that 62% of Independents plus Democratic and Republic leaners identify as moderates). “Despite a strong economy, Americans are anxious: 66% worry about keeping healthcare coverage; 64% about paying healthcare bills, 63% about saving for retirement; 77% believe today’s children will be worse off than parents.” PPI also found “unexpectedly strong support for nationalized health care”, which 75% of Independents favor. Another surprise was that 85% of voters are worried about the size of the national debt – “a possible sleeper issue” in 2020. PPI’s Conclusion: “Two requirements for a Democratic win in the 2020 presidential election are a big tent and a pragmatic, solutions-oriented agenda.” |
| November 2018 US Election Results | Two interesting indicators. (1) The swing towards the Democrats among suburban women. In some cases, (e.g., Connecticut), the emotional vote against Donald Trump appeared more powerful than economic self-interest. (2) Yet while the Democrats now control the House of Representatives, the Republicans will pick up one and possibly two seats in the Senate to further strengthen their existing majority. This will make any attempt to impeach President Trump much more difficult, as while the Democrat controlled House may pass a bill of impeachment, the Senate must vote to convict. While that is not impossible, it appears unlikely given the currently evidence that would be used to support the impeachment bill. That this election provided a conclusive victory for neither side guarantees that political conflict and overall uncertainty will continue unabated, and will likely worsen, between now and the 2020 presidential election. |
| Following her party’s poor election performance, Angela Merkel resigns as head of CDU and announces she won’t serve as Chancellor beyond 2021. Macron’s popularity continues to fall as his reforms bite. | Another indicator of the extent of the collapse the political center across multiple democracies, due to its inability to adequately respond to increasing economic uncertainty, and popular concerns about immigration and terrorism. As it other nations, it is the parties on either extreme that are gaining at the center parties’ expense. In Germany, it is AfD and Greens who are gaining while CDU/CSU and Social Democrats are losing support. As the Financial Times Martin Wolf wrote this month, “Populist forces are on the rise across the transatlantic world…The common thread of all these movements is rejection of the contemporary western elite and the synthesis of liberal democracy, technocratic governance and global capitalism that it promoted. It is a revolution against the establishment.” (“The Price of Populism”, 24Oct18) See also, “How Social Democracy Lost Its Way: A Report from Germany” by Tobias Buck in the Financial Times, 17Oct18 |
| Energy and the Environment: Indicators and Surprises | Why Is This Information Valuable? |
| New Intergovernmental Panel on Climate Change (IPCC) Report Issued, 8 October 2018 | SURPRISE. Key research finding: global warming will trigger highly harmful societal impacts at significantly lower temperature increases than was previously assumed. Significant impacts are expected even from a 1.5°C increase in average temperature The report also highlights the challenge of limiting global warming to just 1.5°. Annual emissions of CO2 would need to be halved by 2030 relative to 2016 levels and renewable energy would need to supply 70–85% of global electricity demand by 2050. |
| “Potentially large equilibrium climate sensitivity tail uncertainty” by Gernot Wagner and Martin L. Weitzman | This paper highlights the extent of uncertainty in current climate models. “Equilibrium climate sensitivity (ECS), the link between concentrations of greenhouse gases in the atmosphere and eventual global average temperatures, has been persistently and perhaps deeply uncertain. Its ‘likely’ range has been approximately between 1.5 and 4.5 degrees Centigrade for almost 40 years. Moreover, Roe and Baker (2007), Weitzman (2009), and others have argued that its right-hand tail may be long, ‘fat’ even.“ “Enter Cox et al. (2018), who use an ’emergent constraint’ approach to characterize the probability distribution of ECS as having a central or best estimate of 2.8℃ with a 66% confidence interval of 2.2-3.4℃. This implies, by their calculations, that the probability of ECS exceeding 4.5℃ is less than 1%. They characterize such kind of result as “renewing hope that we may yet be able to avoid global warming exceeding 2[℃]”. “ “We share the desire for less uncertainty around ECS (Weitzman, 2011; Wagner and Weitzman, 2015). However, we are afraid that the upper-tail emergent constraint on ECS is largely a function of the assumed normal error terms in the regression analysis. We do not attempt to evaluate Cox et al. (2018)’s physical modeling (aside from the normality assumption), leaving that task to physical scientists.” “We take Cox et al. (2018)’s 66% confidence interval as given and explore the implications of applying alternative probability distributions. We find, for example, that moving from a normal to a log-normal distribution, while giving identical probabilities for being in the 2.2-3.4℃ range, increases the probability of exceeding 4.5℃ by over five times. Using instead a fat-tailed Pareto distribution, an admittedly extreme case, increases the probability by over forty times.” |
| “Evaluating the Economic Cost of Coastal Flooding” by Desmet et al | This paper also highlights the uncertainty inherent in today’s models of the highly complex global climate system. Too many models fail to take dynamic adaptation into account, and thus significantly overestimate the GDP loss that could result from increased coastal flooding driven by climate change |
| “Climatic Impacts of Windpower” by Miller and Keith | SURPRISE. This new research paper provides a sobering perspective on the IPCC report’s recommendations regarding faster deployment of wind and solar to replace other sources of power generation.” “We find that generating today’s US electricity demand (0.5 TWe) with wind power would warm Continental US surface temperatures by 0.24C. Warming arises, in part, from turbines redistributing heat by mixing the boundary layer. Modeled diurnal and seasonal temperature differences are roughly consistent with recent observations of warming at wind farms, reflecting a coherent mechanistic understanding for how wind turbines alter climate.” “For the same generation rate, the climatic impacts from solar photovoltaic systems are about ten times smaller than wind systems. Wind’s overall environmental impacts are surely less than fossil energy. Yet, as the energy system is decarbonized, decisions between wind and solar should be informed by estimates of their climate impacts.” And here is the kicker: “Power densities clearly carry implications for land use. Meeting present-day US electricity consumption, for example, would require 12% of the Continental US land area for wind at 0.5We m−2 , or 1% for solar at 5.4We m−2.” |
| “New Asian coal plants knock climate goals off course”, in the Financial Times, 31Oct18 | Read in conjunction with the above report on the potential for replacing fossil fuel based power generation with wind and solar, this column on a key indicator gets to the heart of the climate change issue, and leads to the conclusion that it is unlikely that the world will avoid a significant increase in average temperature, and the consequences it will produce. “Asia’s existing coal plants are just 11-years-old on average and most still have decades left to operate. A fleet of new coal plants in Asia threatening to derail global emissions targets has exposed the growing “disconnect” between energy markets and climate goals.” |
| “The Importance of Climate Risk for Institutional Investors” by Kruger et al | In light of the evidence presented so far in this section, the conclusion of this survey – that investors do not believe that current valuations significantly underestimate climate related risks – seems very much open to question. “According to our survey regarding climate-risk perceptions, institutional investors believe these risks have financial implications for their portfolio firms and that the risks have already begun to materialize, particularly regulatory risks.” “Many of the investors, especially the long-term, larger and ESG-oriented investors, consider risk management and engagement, rather than divestment, to be the better approach for addressing climate risks. Although the investors believe that some equity valuations do not fully reflect climate risks, their perceived overvaluations are not large. In addition, a widespread view exists that climate-risk disclosure needs improvement. |
| New Financial Market Information: Indicators and Surprises | Why Is This Information Valuable? |
| “Empirical Asset Pricing via Machine Learning” by Gu et al. | Excellent overview of the asset pricing accuracy of different ML techniques. Key insight: the best performing methods to a better job than traditional approaches of capturing non-linear interactions between key variables |
| “Index Proliferation Adds Choice But Fuels Confusion” by Pauline Skypla in the Financial Times | “A recent survey by the Index Industry Association revealed its 14 member companies publish 3.29m indices, of which 3.14m cover stock markets. Only 5.6 per cent of these 3.14m are factor or smart beta indices, which are based on factors other than companies’ market capitalisation. However, that modest percentage still works out at more than 175,000.” “These measures may not all be investable indices — benchmarking, where investors use an index to assess their own performance, is also a driver of proliferation. Even so, the choice facing investors can be confusing. “The proliferation of indices, and the way providers calculate indices that sound the same differently, makes the job of investors more difficult,” says Deborah Fuhr, managing partner at ETFGI, a London-based consultancy. Problematically, there is no standard set. “Smart beta is a space that isn’t well defined or owned by a couple of index providers,” says Ms Fuhr.” “A check of five well-known providers in the field (ERI Scientific Beta, Vanguard, State Street Global Advisors, FTSE Russell Global Factor Index Series, MSCI Factor Indexes) shows they all include the criteria of value, momentum and volatility that are among the top half dozen filters commonly applied to smart beta products.” |
| The above column highlighted the growing number of indexes that underlie so-called “smart beta” products. This brought to mind a number of previous papers on the smart-beta approach, which concluded that many investors were likely to be disappointed. These include Rob Arnott’s “How Can Smart Beta Go Horribly Wrong”, by Rob Arnott, “Quantifying Backtest Overfitting in Alternative Beta Strategies”, by Suhonen et al, and “Smart Beta Herding and Its Economic Risks: Riding the Dragon” by Krkoska and Schenk-Hoppé. | Since the smart beta products first appeared, The Index Investor, we have emphasized that they are active management products (see, The Confusing World of Factor (“Smart Beta”) Models and Indexes, from our August 2003 issue). While it is possible that they will return lower returns with less risk, or higher returns with more risk than a broad market index fund, a belief that they will produce higher returns with lower risk rests on three hiqhly questionable assumptions: (1) The mispricing of factor risks that smart beta products claim to exploit is a durable phenomenon – e.g., one caused by investors’ systematic cognitive or emotional biases; (2) There are durable barriers that prevent other investors (including algorithmically driven funds) from arbitraging away the mispricing of one or more factor risks that smart beta products exploit; and (3) Investors are able to identify in advance smart-beta funds that are based on those factors to which assumptions (1) and (2) apply. Unfortunately, once it becomes widely recognized, the failure of smart-beta funds to deliver superior returns is likely to further shake investor confidence in active management. |
| “It Was the Worst of Times: Diversification During a Century of Drawdowns” by AQR Capital Management | AQR highlights a critical distinction between diversification and hedging. The former involves investing in assets whose returns have a low correlation to equities. There is no guarantee that the returns on diversifying investments will be positive when those on equities are negative. And as we saw in 2008, correlations across asset classes can substantially increase during periods of extreme uncertainty and system stress. In contrast, hedges are deliberately designed to increase in value when returns on equities decline –put options being the classic example. However, for this very reason, hedging investments will tend to be more expensive than diversifying investments. |
| “Challenging the Conventional Wisdom on Active Management: A Review of the Past 20 Years of Academic Literature on Actively Managed Mutual Funds”, by Cremers et al | Cremers presents a good summary of arguments in favor of active management. At Index Investor, we have never denied that over some periods of time many active managers will outperform an appropriate passive benchmark index. What we have always questioned, however, is (1) their ability to sustain that superior forecasting performance (or luck) over time; (2) their ability to identify and implement profitable investment opportunities as their funds grow in size; and (3) investors’ ability to identify these superior active managers in advance, rather than in hindsight. If you consider this a joint probability and assume that each of these probabilities is slightly better than luck – say, 55% -- then the joint probability – which essentially equals the probability of an active management strategy outperforming a passive strategy over the long term – is only equal to about 17% -- or a one in six chance. |
| “Private equity deals fail to keep up pre-crisis success” Financial Times 17Oct18 | This column is a good example of the argument against active management outlined above. “The proportion of winning private equity deals — those that deliver more than three times the original investment — has seen a sharp decline in the years since the financial crisis as buyout groups struggle with record-high valuations and fierce competition, an analysis has shown.” “On average, 35 per cent of deals produced healthy returns between 2002 and 2005 compared to roughly 20 per cent of winning transactions between 2010 and 2013, an analysis by Cambridge Associates and Bain & Company showed.” |
| One week after the above story this one appeared: “Private equity set to surpass hedge funds in assets” Financial Times, 24Oct18 | “Private equity will overtake hedge funds as the largest alternative asset class within the next five years as investors flock to private rather than public markets in search of returns, according to a new analysis.” There are at least two possible explanations for this: (a) optimism, overconfidence, and conformity biases on the part of the institutional investors committing more funds to private equity in spite of declining recent returns; or (b) a rational decision to take on more risk in pursuit of higher returns, even though the probability of the latter being realized has significantly declined. In the latter case, I have in mind the no-win situation faced by public sector pension funds in the United States, most of which are badly underfunded. Their managers must choose between hoping to reduce underfunding by earning high investment returns, or telling public sector employers that they must increase their annual pension fund contributions, which in turn will necessitate either cuts in spending in other areas, and/or an increase in taxes on the public. |
How Close is the Macro System to One or More Critical Thresholds?
As we have noted, the macro drivers of financial market regime changes typically follow a rough chronological sequence, from technology to economic, security, social, and political causes and effects. Yet there are many feedbacks loops between them, creating complex root causes for many of the critical thresholds we have identified.
Understanding the time dynamics in this complex system is critical to avoiding substantial downside investment risk.
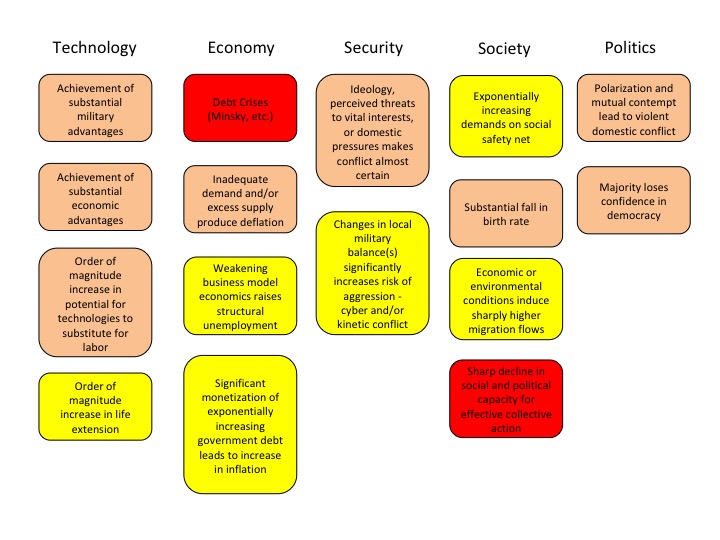
We use the UK Met Office Warning Model to communicate our assessment of these time dynamics. We estimate the time remaining before a critical macro system threshold is reached that could trigger a regime change, which is usually accompanied by substantial changes in asset class valuations.
The model uses three increasingly serious levels of warning, from “Be Aware” (condition yellow), to “Be Prepared” (condition orange), to “Take Action” (condition red).
For our purposes, we denote as “Be Aware” (yellow) critical thresholds that we assess to be three or more years away. We estimate that “Be Prepared” (orange) thresholds could be reached within 1 to 3 years. “Take Action” thresholds are very likely to be reached within one year.
Given their nature, we also note that in our three “wildcard” areas (Environment and Energy related; Disease and Human Caused Bioevents; and Cyber and Electromagnetic Events), our forecasts have higher levels of uncertainty.
The following charts summarize our estimate of the time remaining before different critical thresholds will be reached.
As described in our August 2018 issue, at the highest level, we believe the global macro system can be in one of four states, based on its degree of order versus disorder, and degree of social cooperation versus conflict. We believe that the system is currently in its most uncertain state, characterized by high degrees of underlying disorder and social conflict.
As we said at the beginning of this month’s forecast, based on new information collected and analyzed this month, and the result of the November mid-term elections in the United States (for which we delayed publication this month), we have concluded that we are entering the High Uncertainty Regime, which will eventually produce a fall of 20% or more in the values of all equity asset classes.
Our forecasting question has thus become, what is the probability we will either remain in this regime or enter a different one over the next twelve months?
At this point, we estimate there is a 40% chance of remaining in the High Uncertainty regime over the next 12 months, which will see the commencement of what promises to be a tumultuous US presidential campaign, as well as resolution of the Brexit saga (or at least the “end of the beginning”, and possibly the “beginning of the end”). Elsewhere in Europe French president Macron’s reforms are running into stiffening resistance, Germany continues to search for a successor to Angela Merkel, and there is much uncertainty about whether Italy will trigger another Eurozone crisis (which, because of its size, will be much more dangerous than the ones we have seen thus far). And in Asia, China will continue to struggle with an intensifying trade conflict with the United States and rising domestic stress as the economy slows, and the consequences of its unprecedented debt growth become more painfully apparent.
We conclude that over the next 12 months, the probability of returning to the Normal Regime is slight, at 10%. For reasons we cover in more depth in this month’s feature article, we also believe that the probability of entering the High Inflation regime over the next 12 months is also slight, at only 5%.
We estimate that the probability of entering the Persistent Deflation Regime over the next 12 months is 45%. With the waning in the US of the stimulative effect of the Trump tax cuts, the negative impact of prolonged uncertainty will have an increasingly negative effect on aggregate demand. This will be magnified by the substantial amount of debt that has been taken on by many companies, which more of them will likely struggle to service, which in turn will put more pressure on their cost structures, and potentially lead to increased unemployment, which will accelerate the downward spiral.
It is unlikely that any other asset class will experience a gain of 20% or more. There is a roughly even chance that gold could be the exception, and see a 20% or higher price increase. While the apparent inflation and political uncertainty premia in the gold price today are high relative to the last 25 years, they are still below the peak reached in 2012, and it is possible that herding in the face of higher uncertainty could produce 20% price gains.
Pre-Mortem Analysis
One of the most important forecasting disciplines is to ask yourself why your forecast could be wrong. Dr. Gary Klein’s research has shown that a very powerful and insightful way to do this is via a “pre-mortem analysis.” This method asks you to assume that it is a point in the future, and your forecast has been proven wrong (or your strategy or company has failed). You are then asked to look backward from this imagined point in the future, to explain why you failed, what you missed, and what you could have done differently to avoid your fate.
So let us assume that it is one year from now, and the high uncertainty regime has given way to a return to the Normal Regime, rather than to the Persistent Deflation regime.
How did this happen? What didn’t we anticipate happening?
(1) Perhaps because of an intensifying domestic debt crisis (and its own fear of Japanese-style deflation), or a belief that it had not yet achieved sufficient advantages to pursue more intense conflict with the United States, China reached a new trade agreement with the US and EU to support continued economic growth. This reverses (at least in the short-term) the growing tension in the US/China relationship, providing a strong confidence boost to the world economy and financial markets.
(2) Donald Trump’s replacement by Mike Pence, as well as divided party control of the US Congress after the 2018 mid-term elections led to new bipartisan initiatives to improve the productivity of the US healthcare and education systems, address stagnant middle class incomes, and reduce high levels of concentration in many industries. These and other structural changes contributed to higher expected growth rates, employment, and wage gains which, along with a more predictable and internationally focused United States, increased global confidence and produced a return to the Normal Regime.
Note: Combining this Forecast with Others and Extremizing the Result Should Increase Predictive Accuracy
Research has found that three steps can improve forecast accuracy. The first is seeking forecasts based on different forecasting methodologies, or prepared by forecasters with significantly different backgrounds (as a proxy for different mental models and information). The second is combining those forecasts (using a simple average if few are included, or the median if many are). The final step, which significantly improved the performance of the Good Judgment Project team in the IARPA forecasting tournament, is to “extremize” the average (mean) or median forecast by moving it closer to 0% or 100%.
Forecasts for binary events (e.g., the probability an event will or will not happen within a given time frame) are most useful to decision makers when they are closer to 0% or 100% than the uninformative “coin toss” 50%. As described by Baron et al in “Two Reasons to Make Aggregated Probability Forecasts More Extreme”, forecasters will often shrink their probability estimates towards 50% to take into account their subjective belief about the extent of potentially useful information that they are missing.
When you average multiple forecasters’ estimates, you are including more information, which should increase forecast confidence and push the mean estimate closer to 0% or 100%. However, this doesn’t happen when you use simple averaging. For this reason, forecast accuracy is increased when you employ a structured “extremizing” technique to move the mean estimate closer to 0% or 100%.
You can download an extremizing model from our website to use when combining the forecasts you use in your decision process. The extremizing factors in our model are those that the Good Judgment Project found maximized the accuracy of combined forecasts. Note that the extremizing factor is lower when average forecaster expertise is higher. This is based on the assumption that a group of expert forecasters will incorporate more of the full amount of potentially useful information than will novice forecasters.
Feature Article: Examining the Arguments For and Against a Transition to the High Inflation Regime
There are two ways the High Uncertainty regime could transition to High Inflation. The first scenario would be a substantial negative supply shock, such as a sharp decrease in the supply of oil (e.g., due to Iran making good on its longstanding threat to mine the strait of Hormuz), or massive crop failures (e.g., due to faster and larger than expected changes in global temperatures). To put this risk into perspective, just three grains -- wheat, rice, and corn -- account for 40% of all global dietary energy consumption.
Inflation caused by higher oil prices would likely quickly self-correct, as higher prices would reduce aggregate demand, which in turn would eventually lead to lower oil prices and inflation. On the other hand, a supply shock to the global food supply would very likely take longer to correct.
In the second scenario, the US Government would increase spending to fight a potentially deep downturn, finance this spending with debt, and then monetize that debt by having it purchased by their central banks. A slightly different version of this scenario has been offered by Bridgewater’s Ray Dalio. He posits that entitlement payments will rise faster than tax collections, and widen the US Government deficit at the same time as investors (both domestic and foreign) are increasingly unwilling to purchase it unless yields significantly increase. Fearing that this will choke off economic growth, the US Government successfully pressures the Federal Reserve to purchase more government debt, which holds down yields but at the cost of a sharp increase in the money supply, which eventually precipitates a run on the dollar and a rise in domestic US inflation.
Our assessment of this second high inflation scenario will begin with this familiar macroeconomic equation: MV=PQ. On the left side, M represents the money supply (i.e., a stock) and V (for velocity) represents the rate at which a given stock of money is spent (i.e., a flow). On the right side, P represents the price level (i.e., an increase representing inflation and a decrease representing deflation), while Q represents the real output of goods and services in an economy over a give period of time (i.e., real GDP). Hence, P x Q equals nominal Gross Domestic Product.
In theory, if monetary velocity (V) and real output (Q) remain constant, an increase in the money supply (M) should produce an increase in the price level (P). Yet despite a very substantial increase in the money supply after the 2008 financial crisis, we did not see a sharp increase in inflation. Why was that?
Let’s look at how the individual components of the MV = PQ equation behaved between December 2008 and December 2017. The cumulative increase in the US price level (as measured by CPI) was 17%. The cumulative increase in real output was 19%. The cumulative increase in nominal GDP was 39% (since the PQ relationship is multiplicative, not additive).
But the M1 money supply increased by 124% over this period. The reason the US did not experience a sharp increase in inflation despite an unprecedented increase in the money supply (via the Fed’s Quantitative Easing policy) was due to an equally unprecedented fall in monetary velocity.
The obvious question is why this occurred. Why did the private sector choose to save money rather than spend it? In a 2014 blog post (“What does Money Velocity Tell Us About Low Inflation in the U.S.?”) economists at the St. Louis Federal Reserve Bank offered to possible explanations: “A gloomy economic outlook after the financial crisis” and “the dramatic decrease in interest rates [to zero or negative real yields] caused a portfolio shift away from interest bearing assets and into cash.” In essence, the latter describes a liquidity trap (see our May 2001 article, “What’s a “Liquidity Trap” and Why Should I Worry About It?”).
Let’s now consider how these results could differ if in the future the federal government increases deficit spending and finances it via the issuance of bonds that are bought by the Federal Reserve, because of a lack of market buyers at what the government perceives as an acceptable yield. Let’s further assume that this produces an increase in both real output (Q) and the money supply. Once again, the question of whether this results in a sharp increase in inflation algebraically turns on the likely behavior of velocity.
Our view is that if the increase in government deficit spending takes place in the context of weakening private sector demand, with the current level of private sector debt overhang, and real rates still low or negative, it is hard to see why velocity would increase from its present low level. But that said, at the current level, there is much less room for it to further decline, so arguably that could produce some increase in inflation – but probably not that much unless the monetary expansion and deficit spending were truly massive. But in the current political environment, with the Democrats poised to control the US House of Representatives, it is hard to see how that could come to pass.
Moreover, there are also three other important factors to consider. The first is the assumption that central bank monetization of part of the US deficit will be necessitated by a lack of other buyers for US government debt at a yield deemed acceptable by the Treasury. In a weak economy, that may also be facing a Eurozone crisis and a more aggressive China, this assumption may not hold true. Even if the price of gold skyrockets, at some point it cannot absorb the likely savings flows seeking a low risk haven in the storm. And while not as attractive an investment as in the past, US Treasuries may still be the least ugly of the alternatives on offer (e.g., because of the superior breadth and liquidity of the US Treasury market).
Second, it seems unlikely that the US Federal Reserve will give up its independence (and the anchor on inflation expectations it provides) without a political fight. Any assumption that an administration can easily win that fight and win approval for a large increase in deficit spending is likely to be wrong.
Finally, given the amount of supply capacity that has built up in the world economy relative to what has been weak demand in recent years (a powerful if latent deflationary force, as we have noted), it may also be the case that the potential increase in prices caused by rise in demand driven by government spending will be offset by a sharp increase in supply (unless, of course, that supply increase is blocked by much higher trade barriers or other political actions).
To be sure, history – and the present – warn us that hyperinflations can occur. But in the case of the United States, there are also a series of countervailing factors that seem likely to offset most (but not all) of the potential causal pathways to the High Inflation Regime.
If you have any questions about anything we have written in this issue, please don’t hesitate to get in touch, at contact@indexinvestor.com