The Index Investor
February 2019
Key Takeaways
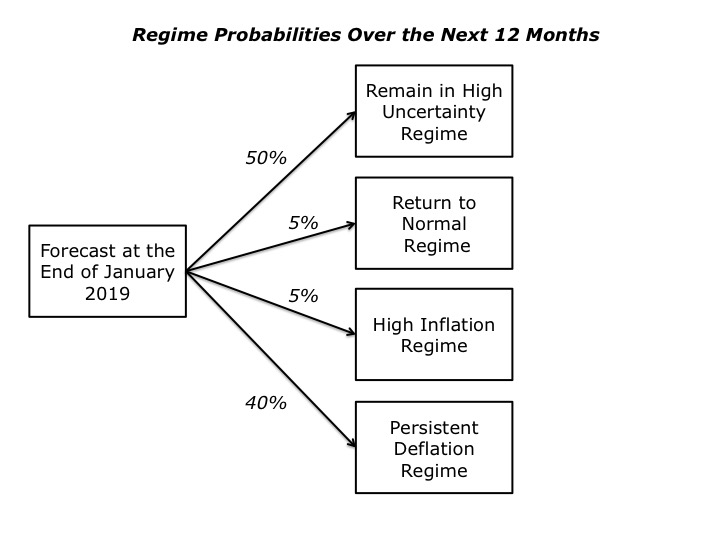
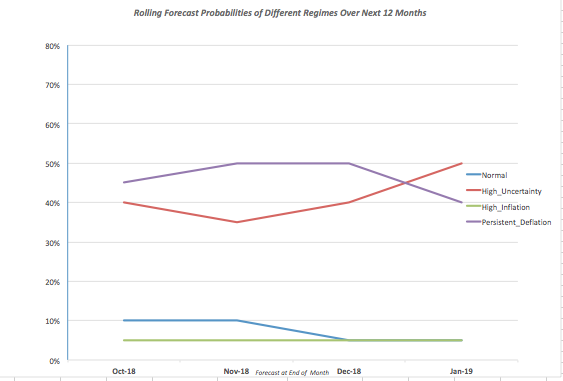
Over the next 12 months, our updated regime probability forecasts are as follows: Continuation of Current High Uncertainty Regime (50% up 10% from last month); transition to High Inflation Regime (5%, no change); return to Normal Regime (5%, no change); and transition to Persistent Deflation Regime (40%, down 10%). In making our forecast, we are acutely conscious of Rudiger Dornbusch’s famous quote: “Crises take a much longer time coming than you think, then happen much faster than you would have thought.”
While some quantitative indicators (Liquidity and BB spreads over Treasuries) point to a reduced level of stress in the macro system compared to last month, others point in the opposite direction (Economic Uncertainty Index, Asset Class Return Autocorrelation, and changes in the price of Gold).
On balance, we are inclined to put the most weight on the high level of the Economic Uncertainty Index, and the high level of return autocorrelation across major asset classes. This is consistent with the shrinkage of narrative diversity and increase in social copying that occurs as uncertainty increases. One could also argue that the falls in the liquidity and credit spreads are also consistent with an optimistic financial market narrative which concludes that the FED backing away from its planned rate rises and the possibility of a trade deal with China, portends a return to the Normal Regime. The increasing price of gold is inconsistent with this narrative, but gold investors may be taking a broader and more pessimistic perspective on worrisome developments in both the European and Chinese economies.
Key indicators this month were (1) the US Federal Reserve backed off its plan to increase rates in 2019; (2) The probability of a face-saving trade deal between the US and China increased; and (3) Newly announced Democratic candidates for the US presidential election in 2020 have taken unusually progressive positions.
Asset Class Valuation and Momentum Indicators (@31Jan19)
| Asset Class (ETF) | Valuation | 1 Month Return | Conclusion |
| US Real Return Govt Bond (TIP) | Likely Overvalued* | 1.42% | Increasing Overvaluation |
| US Nom Return Govt Bond (GOVT) | Likely Overvalued* | 1.01% | Increasing Overvaluation |
| US Investment Grade Credit (LQD) | Close to Fairly Valued* | 3.37% | Close to Fairly Valued |
| US High Yield Credit (HYG) | Likely Overvalued* | 4.94% | Increasing Overvaluation |
| US Commercial Property (VNQ) | Likely Undervalued* | 11.85% | Decreasing Undervaluation |
| US Equity (VTI) | Likely Overvalued* | 8.54% | Increasing Overvaluation |
| Foreign Developed Mkt Equity (VEA) | Likely Undervalued* | 7.47% | Decreasing Undervaluation |
| Emerging Markets Equity (VWO) | Almost Certainly Overvalued* | 9.66% | Increasing Overvaluation |
| Timber (WY) | Very Likely Undervalued* | 20.04% | Decreasing Undervaluation |
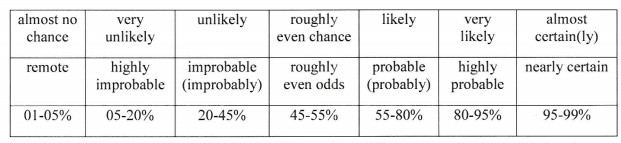
Note: The language we use to describe our estimated likelihood of asset class over or undervaluation is based on US Intelligence Community Directive 203 on Analytic Standards, which includes the following table:
Market Stress Indicators (@31Jan19)
| Market Stress Indicator | This Month vs Last Month |
| Asset Class Returns Autocorrelation (this month versus last month). Higher autocorrelation is an indicator of higher market stress. | .86 vs (.09) Indicates a sharp jump in market stress. |
| Economic Policy Uncertainty Index (how many days over the last 30 was index in top quartile of values since 1985?) | On 18 days the index was in the top quartile of daily values since 1984 (the 89th – very high – percentile of all rolling 30 day counts) |
| AAA Rated Bonds Spread over 10 Year Treasury Yield (month end). Asset Class Returns Autocorrelation (this month versus last month). Higher autocorrelation is an indicator of higher market stress. | 1.16% (46th percentile since 1983) vs 1.30% last month. |
| BB Rated Bonds Spread over 10 Year Treasury Yield (month end). High spreads indicate increasing credit risk. | 2.75% (36th percentile since 1996) vs 3.60% |
| Gold Price per Ounce in US Dollars (month end) | $1,323 vs $1,277, up 3.2%) |
Market Stress Indicators: Forecast Discussion
We view financial markets as a complex adaptive system. The size of changes generated by such a system follows a power law rather than a normal (Gaussian) distribution. The critical point is that large changes are much more common in complex adaptive systems than most people’s intuition leads them to believe.
While predicting the behavior of complex adaptive systems remains far more art than a science, various researchers have found that large changes in such systems are often preceded by subtle warning signs, as stress accumulates within them. While this research is not definitive, we believe that five warning signs are worth monitoring as potential indicators of growing stress within financial markets that could suddenly give rise to large changes in asset class valuations.
Our first indicator is the month-to-month autocorrelation of broad asset class returns (i.e., the relationship of this month’s returns to last month’s). A system under increasing stress loses resiliency, causing it to take longer to recover from perturbations; hence, autocorrelation increases as it approaches a critical transition (see, “Early Warning Signals for Critical Transitions” by Scheffer, et al).
The one-month autocorrelation of returns for the broad asset classes we monitor increases sharply to .86, versus (.09) last month and .86 the month before that. This indicates that financial markets are becoming more ordered and are potentially closer to a critical transition point (which would most likely be accompanied by sudden and substantial changes in asset class values) than they were last month.
The second market stress indicator we monitor is the Economic Policy Uncertainty Index published by the Federal Reserve Bank of St. Louis (via its FRED economic database), which is based on research by Baker, Bloom, and Davis (see their paper, “Measuring Economic Policy Uncertainty”). The index is based on automated text analysis of leading newspapers and magazine publications, to identify the frequency with which words and phrases are used that indicate uncertainty.
In humans' evolutionary past, when uncertainty increased the probability of survival was enhanced by staying close to a group. All of us still have that instinct. Research has found that as uncertainty increases, we have an unconscious bias towards higher conformity of our own views with those of a larger group (i.e., reduction in cognitive diversity). Behaviorally, heightened uncertainty induces more “social copying” of others, likely due to both conformity bias and the rational belief that others may be acting on the basis of superior information. This increase in conformity and copying makes a social system more ordered as uncertainty increases, and also reduces its responsiveness to perturbations (i.e., increases autocorrelation) because of delays in the social copying process.
The key point is that increasing uncertainty induces more, not less order in social systems, and in so doing primes them for sudden non-linear change.
Based on our continued research into the insights this index can provide, in 2019 we will focus on the number of days, in the previous 30 days, that this index was in the top quartile of all values since the index series begins at the start of 1985. We then compare this statistic to the full set of rolling 30-day periods, and calculate its percentile at the end of the most recent month. At the end of January, our rolling 30 day count of top quartile values was in the 89th percentile – a very high level that indicates a high degree of underlying uncertainty, and a macro system that is primed for sudden, non-linear change.
Our third market stress indicator is the spread between the yield on AAA rated bonds and the 10-year US Treasury. This is a proxy for the level of investor concern about financial system funding liquidity. At the end of January 2019, this spread stood at 1.16%, (the 46th percentile since the series began in 1983), down from last month’s 1.30% spread. This indicates a reduction in market stress.
Our fourth market stress indicator is the yield spread between speculative BB rated bonds and the ten-year US Treasury. Throughout history, excessive credit growth has been a root cause of many financial crises. An indicator of such growth is falling credit spreads, particularly in the case of riskier borrowers. In contrast, rising BB spreads indicate growing investor concern about the consequences of such growth, and the financial distress lower rated companies could experience in an economic downturn. At the end of January 2019, this spread was 2.75% (36th percentile since the series began in 1996), down from the 3.60% spread at the end of December. While this indicates reduced credit market stress, it is still a very low level for this late in what is already an exceptionally long period without a serious economic downturn.
Our fifth market stress indicator is what we term the “political risk premium” that is implicit in the price of gold. Our starting point for estimating this premium is the three different roles that gold plays. First, gold is a store of value in a world of fiat currencies. When the rate of money supply growth exceeds the growth of nominal GDP, gold’s price should increase to maintain its purchasing power. Between 2007 and 2017, the US money supply (M2) grew by about 86%, while nominal US GDP grew by 35%. The stock of gold grew by 18%, based on mine production over this period. We therefore infer that 33% of the increase in the price of gold represented the maximum potential gold price change that could be attributed to a desire to hedge inflation risk (86% less 35% less 18%).
Second, gold is a unit of account. We take this to mean that the annual change in GDP expressed in terms of physical gold (i.e., nominal GDP divided by the price of gold) should equal the change in real GDP calculated using the GDP price deflator to account for actual inflation over the period. A key challenge is the point at which to start this calculation.
We chose the price of gold in 1995/1996. In that period, the change in real global GDP measured using the IMF’s price deflator just about equaled the change in GDP measured in terms of physical gold. We interpret that coincidence as indicating that at that point in time, concerns about future inflation and political risk were minimal, and the change in the price of gold was mostly driven by its role as a unit of account. We calculated a subsequent series of gold prices that would produce the same change in “gold GDP” as the actual real GDP as calculated by the IMF. Between 2007 and 2017, “gold as a unit of account” warranted a 21% increase in its price.
Gold’s third role is as a hedge against inflation and what we term “political disaster” risk. We subtract the 21% estimated compensation for actual inflation from the 33% “gross” inflation risk hedge to derive an apparent 12% increase in the gold price that reflected the true risk premium to hedge against possible future inflation. However, between 2007 and 2017 the price of gold actually increased by 81%. This implies that 48% of this (81% less 21% less 12%) represented a premium for some other type of uncertainty at the end of 2017. The interesting question is the nature of the uncertainty for which gold is believed by some investors to be a superior hedge than traditional ports in a storm like short-term US government securities, or similar securities issued by other developed countries.
The logical inference is that the uncertainty in question must reflect a situation in which short term US Treasuries would be a less effective hedge than gold. This could be a world of widespread hyperinflation, capital controls, and/or radical changes in nations’ governments (of course, this would also imply a preference for investing in gold coins rather than bullion, as while the latter may be a store of value, it is far less convenient as a means of paying for transactions).
To put this in further perspective, this gold price “disaster risk” premium sharply increased from 2008 to 2012, then declined before sharply increasing again after 2016. Arguably, a significant part of the former increase reflects concerns about the potential inflationary consequences of dramatic quantitative easing by central banks. But this is not likely to be the case after 2016. Over the last month, the price of gold rose by 3.2%, after a 4.7% rise in December. For all of 2018, the price of gold fell by about 1.5% since the end of 2017. So, on a rough approximation, the political uncertainty premium at the end of January 2019 stood at about 50% (48% - 1.7% + 3.2%), compared to a low of 39% at the end of August 2018. This is another indicator of rising market stress.
To conclude, three of our indicators – asset class return autocorrelation, top quartile values for the Economic Uncertainty Index, and the price of gold – point to rising levels of underlying market stress, which set the stage for a sudden, sharp change in asset class valuations and prices. In contrast, our metrics for tracking liquidity and credit risk have indicated declining levels of market stress over the last month.
On balance, we are inclined to put the most weight on the high level of the Economic Uncertainty Index, and the high level of return autocorrelation across major asset classes. This is consistent with the shrinkage of narrative diversity and increase in social copying that occurs as uncertainty increases. One could also argue that the falls in the liquidity and credit spreads are also consistent with an optimistic financial market narrative which concludes that the FED backing away from its planned rate rises and the possibility of a trade deal with China, portends a return to the Normal Regime. The increasing price of gold is inconsistent with this narrative, but gold investors may be taking a broader and more pessimistic perspective on worrisome developments in both the European and Chinese economies.
Macro Regime Forecast and Implications for Asset Class Values
Summary: Why Did We Change Our Regime Probabilities?
Perhaps the wisest insight I’ve come across in 40 years of forecasting is this quote by the late economist Rudi Dornbusich: “Crises take a much longer time coming than you think, then happen much faster than you would have thought.”
With that quote in mind, I’ve increased the probability that 12 months from now we will still be in the High Uncertainty Regime from 40% to 50%, and decreased the probability that we’ll be in the Persistent Deflation Regime from 50% to 40%.
Three new pieces of information drove this forecast change.
The first was the decision of by the US Federal Reserve to back off its planned sequence of interest rate rises in 2019, out of concern for what it perceives as deteriorating conditions in the global economy (particularly Europe and China). This is likely to hold off a deeper downturn in the United States, at least for a while.
The second was additional indications that the economic downturn in China may be accelerating. This raises the probability that Xi and Trump will find their way to a trade deal that provides face-saving benefits to both leaders. While I don’t think this changes the underlying “correlation of forces” (to use an old Soviet phrase) that point towards growing and extended conflict between the US and China, in the short-term such a deal would temporarily reduce uncertainty and strengthen the “positive narrative” about the economy, the impact of which can already be seen this month in improving liquidity and credit spreads.
The third piece of new information was a spate of Democrats announcing their candidacies for the 2020 US Presidential election. Most notable about them was that most are staking out “progressive” policy positions well to the left of traditional party candidates (at least since George McGovern’s run in 1972). While some of their economic positions poll quite strongly with the public (e.g., reforming health care, making taxes more progressive), many of their social positions do not (e.g., speech restrictions/political correctness, legalizing third term abortion). How these candidates will fare over time with the public, and whether (given current investigations) Donald Trump will run again both remain highly uncertain.
This combination could sustain the High Uncertainty Regime – and thus competing optimistic and pessimistic narratives – for longer than I previously thought possible, and in so doing delay the onset of the Persistent Deflation Regime that I continue to think will follow.
Forecast Methodology
The focus of our monthly macro forecast is twofold. First, the probability of a change in financial market regime that causes changes of 20% or more in asset class valuations over the next year. Second, contingent on such a change taking place, the probability of a subsequent transition to other regimes.
Our analysis focuses on four possible macro regimes: (1) Normal Times, where equity asset classes perform well; (2) a High Uncertainty regime that is usually short and transitory, where asset classes like short-term government bonds perform best; (3) High Inflation, where commercial property, real return bonds and other traditional hedges are favored; and (4) Persistent Deflation, which up to now has only been seen in Japan, and in which the relative performance of different asset classes remains most uncertain.
Our forecasting methodology is derived from our experience on the Good Judgment Project, as described in the book, “Superforecasting” by Gardner and Tetlock, as well as a range of other sources, from the intelligence community to systems dynamics and complex adaptive systems to statistics and political economy.
We start with base rate/reference case data about the historical probability of large changes in equity and bond valuations. We then analyze the current situation from both a quantitative and qualitative perspective. In the latter, we focus on the key endogenous drivers of macro regime change, including technological, economic, national security, social, and political trends and uncertainties. We also focus on three potential sources of exogenous shocks that could also produce a macro regime change, caused by environmental, disease, and cyber related events.
While most of our attention typically focuses on various flows (e.g., economic growth, change in the price level, sales, earnings, job creation, etc.), endogenously caused regime changes result when those flows push key stocks beyond a critical threshold or tipping point, often setting off non-linear reactions across multiple areas. As noted by Hyman Minsky and others, a classic example is the steady accumulation of outstanding debt until it reaches the point where it can no longer be serviced and triggers a crisis.
Base Rate Data
Since the end of World War Two, there have been fifteen months where a downturn in the US equity market began that eventually reduced asset class value by 20% of more. That is a hazard rate of about 1.75% per month. Put differently, in any given month there is a 98.25% probability that a 20%+ downturn won’t occur, or, in a given year, an 81% probability.
However, as the time without a 20%+ downturn extends, the compound probability that one will not occur shrinks. At the end of August 2018, it is more than nine years since the last equity market decline of 20% or more. The probability of that happening is only 15%.
To estimate the base rate for a 20% fall in bond prices (which historically has been caused by a sharp increase in inflation, as we saw in the late 1970s and early 1980s), we analyzed monthly historical AAA bond yields since 1919. For consistency, we used them to calculate the price of a ten-year zero coupon bond. We then calculated the probability of a price decline of 20% or more over three different holding periods: 12, 18, and 24 months. In any month, the annualized probability of a decline of 20% or more over the subsequent 12 months is 12%; over 18 months, 20%, and over 24 months, 25%.
The Current State of Quantitative Regime Predictors
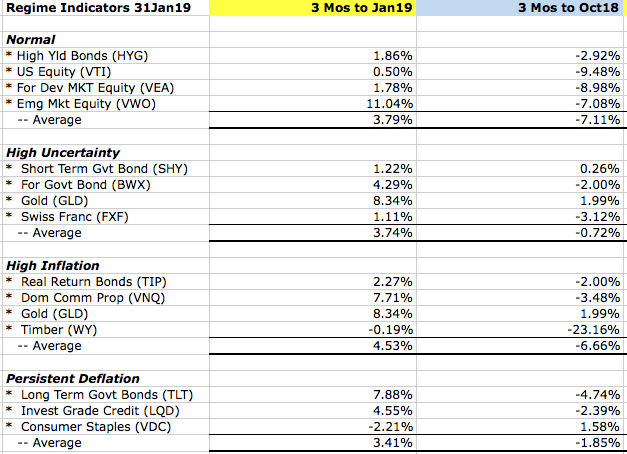
Our quantitative methodology focuses on the level and change in three-month returns, over the most recent and previous three-month periods, for those asset classes which should perform best under different regimes.
As you can see in the following table, based on three month returns to the end of January 2019, this analysis indicates that, over the next 12 months, the balance of expectations across all four regimes was in rough balance, which we consider to be another indication of high underlying uncertainty.
That said, comparing the change between the two three month periods, positive momentum is strongest for both the Normal and the High Inflation Regimes.
Like Professors Andrew Lo, Doyne Farmer and others, we regard financial markets as a complex adaptive system (CAS), that exist as part of a larger macro system comprised of other CAS between which there are multiple feedback loops. These other systems include those that produce technology innovations, and economic, environmental, national security (including cyber), social, demographic, and political outcomes.
We also find that these systems tend to operate and generate effects in a rough chronological sequence, albeit with many feedback loops between them. The following chart highlights that the changes we observe in different areas at any point in time are actually part of a much more complex evolutionary process.
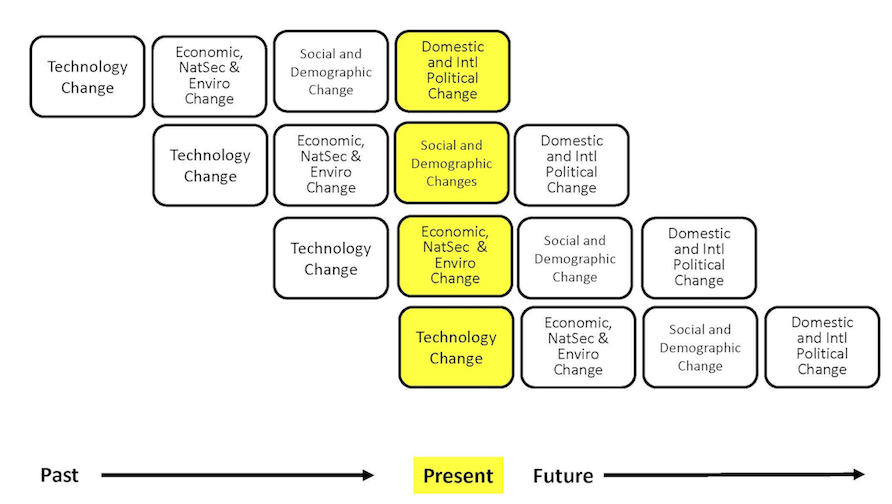
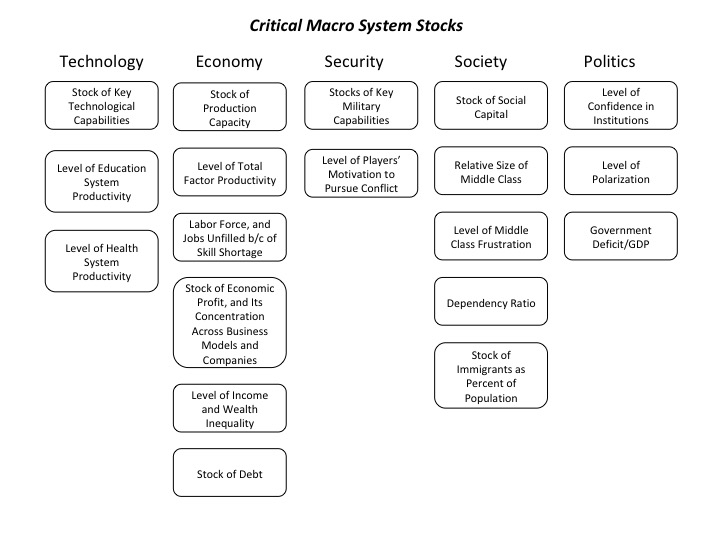
While most media coverage of these systems focused on flows (e.g., the size of the government deficit), rapid non-linear change in complex adaptive systems is often caused by a key stock (e.g., the amount of outstanding government debt) exceeding a critical threshold.
The next table highlights the key macro system stocks that we monitor.
In the next section, we will discuss information received over the past month that is related to these stocks, and which we believe is significant to our assessment of the probabilities that a critical threshold will be reached and a regime change will occur. We will conclude with our estimate, at the end of this month, of how close the macro system is to these critical thresholds, and the implications for financial market regime change probabilities.
As you can see in the following table, based on three month returns to the end of January 2019, this analysis indicates that, over the next 12 months, the balance of expectations across all four regimes was in rough balance, which we consider to be another indication of high underlying uncertainty.
That said, comparing the change between the two three month periods, positive momentum is strongest for both the Normal and the High Inflation Regimes.
| New Technology Information: Indicators and Surprises | Why Is This Information Valuable? |
| DeepMind’s AlphaStar software has for the first time defeated a top ranked professional player five games to zero in the real time strategy game Starcraft II. | SURPRISE As DeepMind notes, “until now, AI techniques have struggled to cope with the complexity of StarCraft… The need to balance short and long-term goals and adapt to unexpected situations, poses a huge challenge…Mastering this problem required breakthroughs in several AI research challenges including: Game theory: StarCraft is a game where, just like rock-paper-scissors, there is no single best strategy. As such, an AI training process needs to continually explore and expand the frontiers of strategic knowledge. Imperfect Information: Unlike games like chess or Go where players see everything, crucial information is hidden from a StarCraft player and must be actively discovered by “scouting”. Long term planning: Like many real-world problems cause-and-effect is not instantaneous. Games can also take anywhere up to one hour to complete, meaning actions taken early in the game may not pay off for a long time. Real time: Unlike traditional board games where players alternate turns between subsequent moves, StarCraft players must perform actions continually as the game clock progresses. Large action space: Hundreds of different units and buildings must be controlled at once, in real-time, resulting in a huge combinatorial space of possibilities… Due to these immense challenges, StarCraft has emerged as a “grand challenge” for AI research.” DeepMind’s latest achievement is further evidence of the accelerating pace at which AI capabilities are improving. To be sure, Starcraft is still a discrete system, governed by an unchanging set of rules. In that sense, it critically differs from real world complex socio-technical systems, in which agents’ adaptive actions are not constrained by unchanging rules, and system dynamics evolve over time. In real world complex adaptive systems, making sense of new information in an evolving context, inducing abstract concepts from novel situations, and then using them to rapidly reason about the dynamics of a situation and the likely impact of possible actions remain, for now, beyond the capabilities of the most advanced artificial intelligence systems. In addition, some critics have noted that DeepStar’s victory owed more to the speed of its play relative to its very talented human opponent, and physical accuracy of its moves (placement of units on a map) than it did to superior strategy (e.g., see, “An Analysis On How Deepmind’s Starcraft 2 AI’s Superhuman Speed is Probably a Band-Aid Fix For The Limitations of Imitation Learning”, by Aleksi Pietikainen). But all that said, DeepStar’s success still reminds us that the gap between the capabilities of AI and human beings, even in cognitively challenging areas, is closing faster than many people appreciate |
| “Quantum Terrorism” Collective Vulnerability of Global Quantum Systems” by Johnson et al. | SURPRISE Quantum computing, while exponentially more powerful than today’s technology, will also bring new vulnerabilities. The authors “show that an entirely new form of threat arises by which a group of 3 or more quantum-enabled adversaries can maximally disrupt the global quantum state of future systems in a way that is practically impossible to detect, and that is amplified by the way that humans naturally group into adversarial entities.” |
| Shoshana Zuboff’s new book, “The Age of Surveillance Capitalism: The Fight for the Future at the New Frontier of Power” crystallizes the often unspoken worries that many people have felt about exponentially improving artificial intelligence technologies. | SURPRISE Writing in the Financial Times Zuboff describes “a new economic logic [she] calls ‘surveillance capitalism’”. It “was invented in the teeth of the dot.com bust, when a fledgling company called Google decided to try and boost ad revenue by using its exclusive access to largely ignored data logs — the “digital exhaust” left over from users’ online search and browsing. The data would be analysed for predictive patterns that could match ads and users. Google would both repurpose the “surplus” behavioural data and develop methods to aggressively seek new sources of it…These operations were designed to bypass user awareness and, therefore, eliminate any possible “friction”. In other words, from the very start Google’s breakthrough depended upon a one-way mirror: surveillance…” Surveillance capitalism soon migrated to Facebook and rose to become the default model for capital accumulation in Silicon Valley, embraced by every start-up and app. It was rationalised as a quid pro quo for free services but is no more limited to that context than mass production was limited to the fabrication of the Model T. It is now present across a wide range of sectors, including insurance, retail, healthcare, finance, entertainment, education and more. Capitalism is literally shifting under our gaze.” “It has long been understood that capitalism evolves by claiming things that exist outside of the market dynamic and turning them into market commodities for sale and purchase. Surveillance capitalism extends this pattern by declaring private human experience as free raw material that can be computed and fashioned into behavioural predictions for production and exchange…” “Surveillance capitalists produce deeply anti-democratic asymmetries of knowledge and the power that accrues to knowledge. They know everything about us, while their operations are designed to be unknowable to us. They predict our futures and configure our behaviour, but for the sake of others’ goals and financial gain. This power to know and modify human behaviour is unprecedented. “Often confused with totalitarianism and feared as Big Brother, it is a new species of modern power that I call ‘instrumentarianism’. [This] power can know and modify the behaviour of individuals, groups and populations in the service of surveillance capital. The Cambridge Analytica scandal revealed how, with the right knowhow, these methods of instrumentarian power can pivot to political objectives. But make no mistake, every tactic employed by Cambridge Analytica was part of surveillance capitalism’s routine operations of behavioural influence.” As the Guardian noted in its review of her book, Zuboff, “points out that while most of us think that we are dealing merely with algorithmic inscrutability, in fact what confronts us is the latest phase in capitalism’s long evolution – from the making of products, to mass production, to managerial capitalism, to services, to financial capitalism, and now to the exploitation of behavioural predictions covertly derived from the surveillance of users.” “The combination of state surveillance and its capitalist counterpart means that digital technology is separating the citizens in all societies into two groups: the watchers (invisible, unknown and unaccountable) and the watched. This has profound consequences for democracy because asymmetry of knowledge translates into asymmetries of power. But whereas most democratic societies have at least some degree of oversight of state surveillance, we currently have almost no regulatory oversight of its privatised counterpart. This is intolerable.” |
| In light of Zuboff’s book, the provocatively titled article (“The French Fine Against Google is the Start of a War”) in the 24Jan19 Economist does not seem excessive. | SURPRISE “On January 21st France’s data-protection regulator, which is known by its French acronym, CNIL, announced that it had found Google’s data-collection practices to be in breach of the European Union’s new privacy law, the General Data Protection Regulation (GDPR). CNIL hit Google with a €50m ($57m), the biggest yet levied under GDPR. Google’s fault, said the regulator, had been its failure to be clear and transparent when gathering data from users…” “The fine represents the first volley fired by European regulators at the heart of the business model on which Google and many other online services are based, one which revolves around the frictionless collection of personal data about customers to create personalised advertising. It is the first time that the data practices behind Google’s advertising business, and thus those of a whole industry, have been deemed illegal. Google says it will appeal against the ruling. Its argument will not be over whether consent is required to collect personal data—it agrees that it is—but what quality of consent counts as sufficient…Up to now the rules that underpin the digital economy have been written by Google, Facebook et al. But with this week’s fine that is starting to change.” The growing public anger in the West over reduced privacy that both Zuboff’s book and the CNIL fine represent has important implications for the race to create ever more powerful machine learning/artificial intelligence capabilities, whose advancement is critically dependent on access to large amounts of training data. In China, data privacy is not an issue. In Europe, it is a very serious issue today. The US currently lies somewhere in between. While emerging technologies like Generative Adversarial Networks may in future be used to quickly generate high quality simulated data that can be used to train AI, we aren’t there yet. Until we are, the data privacy issue will be inextricably linked to the pace of AI development, which in turn has national security, as well as economic and social implications. |
| “We analyzed 16,625 papers to figure out where AI is headed next” by Karen Hao, in MIT Technology Review, 25Jan19 | “The sudden rise and fall of different techniques has characterized AI research for a long time, he says. Every decade has seen a heated competition between different ideas. Then, once in a while, a switch flips, and everyone in the community converges on a specific one. At MIT Technology Review, we wanted to visualize these fits and starts. So we turned to one of the largest open-source databases of scientific papers, known as the Arxiv (pronounced “archive”). We downloaded the abstracts of all 16,625 papers available in the “artificial intelligence” section through November 18, 2018, and tracked the words mentioned through the years to see how the field has evolved…” ”We found three major trends: a shift toward machine learning during the late 1990s and early 2000s, a rise in the popularity of neural networks beginning in the early 2010s, and growth in reinforcement learning in the past few years…The biggest shift we found was a transition away from knowledge-based systems by the early 2000s. These computer programs are based on the idea that you can use rules to encode all human knowledge. In their place, researchers turned to machine learning—the parent category of algorithms that includes deep learning…Instead of requiring people to manually encode hundreds of thousands of rules, this approach programs machines to extract those rules automatically from a pile of data. Just like that, the field abandoned knowledge-based systems and turned to refining machine learning…” “In the few years since the rise of deep learning, our analysis reveals, a third and final shift has taken place in AI research. As well as the different techniques in machine learning, there are three different types: supervised, unsupervised, and reinforcement learning. Supervised learning, which involves feeding a machine labeled data, is the most commonly used and also has the most practical applications by far. In the last few years, however, reinforcement learning, which mimics the process of training animals through punishments and rewards, has seen a rapid uptick of mentions in paper abstracts… [The pivotal] moment came in October 2015, when DeepMind’s AlphaGo, trained with reinforcement learning, defeated the world champion in the ancient game of Go. The effect on the research community was immediate… Our analysis provides only the most recent snapshot of the competition among ideas that characterizes AI research. But it illustrates the fickleness of the quest to duplicate intelligence… Every decade, in other words, has essentially seen the reign of a different technique: neural networks in the late ’50s and ’60s, various symbolic approaches in the ’70s, knowledge-based systems in the ’80s, Bayesian networks in the ’90s, support vector machines in the ’00s, and neural networks again in the ’10s. The 2020s should be no different, meaning the era of deep learning may soon come to an end.” |
| “It’s Still the Prices, Stupid”, by Anderson et all in Health Affairs | As we have noted, healthcare and education are critical “social technologies”, particularly in a period of rapid change and heightened uncertainty about employment (which, for many Americans, is the source of their health insurance). Improving the effectiveness, efficiency, and adaptability of both these technologies will have a critical impact on the economy, society, and politics in the future. The authors of this article update a famous 2003 article titled “It’s the Prices, Stupid”, which “found that the sizable differences in health spending between the US and other countries were explained mainly by health care prices.” The authors of the present article find that, “The conclusion that prices are the primary reason why the US spends more on health care than any other country remains valid, despite health policy reforms and health systems restructuring that have occurred in the US and other industrialized countries since the 2003 article’s publication. On key measures of health care resources per capita (hospital beds, physicians, and nurses), the US still provides significantly fewer resources compared to the OECD median country. Since the US is not consuming greater resources than other countries, the most logical factor is the higher prices paid in the US.” |
| On the education front, Colorado recently updated its “Talent Pipeline” Report, which provides a stark reminder of how poorly the US education system is performing, even in a state with the nation’s second highest percentage of residents with a bachelors degree or higher (about 40%). | Out of 100 students who complete 9th grade, 70 graduate from high school on time, 43 enroll in college that autumn, 32 return after their first year of college, and just 25 graduate from college within six years of starting it. Results like these have two critical implications. First, they point to stagnant or declining human capital, which is a key driver of total factor productivity and thus long-term growth, particularly as the economy becomes more knowledge intensive. Second, at a time when the capabilities of labor substituting technologies (like AI and automation) have been improving exponentially, the failure of human capital to keep pace will naturally induce businesses to invest more in the former and less in the latter, which would likely produce worsening economic inequality, rising unemployment, and skyrocketing government spending on social safety net programs – which will have to be paid for wither with higher taxes or unlikely cuts in other spending. |
| | |
| | |
| New Economic Information: Indicators and Surprises | Why Is This Information Valuable? |
| On 20th anniversary of the Euro, both the FT and Economist are pessimistic about its future | In “The Euro Enters Its Third Decade in Need of Reform” the Economist concludes that, “If Europe’s single currency is to survive a global slowdown or another crisis, it will require another remodeling that politicians seem unwilling or unable to press through…Political differences between the north and south mean that three institutional flaws remain unresolved. Private-sector risk sharing through banks and capital markets is insufficient, the doom loop connecting banks and sovereigns [via the former’s large exposure to sovereign bonds] has not been fully severed, and there is no avenue for fiscal stimulus.” In “Challenging Times Lie Ahead for the Eurozone”, the Financial Times’ Editorial Board notes that “the question of how the Eurozone would deal with another full-blown crisis has not yet received a proper answer…Challenging times lies ahead as economic growth slows, notably in countries such as Italy where debt levels are already too high.” In separate 15Jan19 column, however, the FT’s Martin Wolf argues that “the Eurozone is doomed to succeed” because breaking it up “would be hugely traumatic, financially and economically.” What is unarguable, however, is that the Eurozone’s response to the global financial crisis has sharply reduced the currency’s international role, as described in a new paper by Maggiori et al (“The Rise of the dollar and the Fall of the Euro as International Currencies”). |
| This month saw further coverage of rising fears about the level of debt in the global economy, and the pain and uncertainty that the future could bring if an economic downturn triggers widespread debt restructurings. | In a speech on “Debt Dynamics”, given on 23Jan19, Ben Broadbent, Deputy Governor of the Bank of England, began by noting the results of a Bank research paper that found that rapid expansion of private sector credit was a better predictor of the severity of subsequent recessions than the level of credit (see, “Down in the Slumps: The Role of Credit in Five Decades of Recessions”, by Bridges et al). In light of that observation, it is interesting to look at private sector credit growth in major countries between 2000 and 2017, using the IMF’s new Global Debt Database (the most comprehensive debt database ever constructed). As a percent of GDP, the highest growth was found in China (96%, from 111% of GDP to 207%); Canada (84%), and France (61%). Far smaller increases were recorded in Italy (39%), the UK (38%), the USA (20%), Germany (minus 23%), and Japan (minus 29%). Broadbent also pointed to the rapid growth in leveraged loans as a particularly worrisome development. As the Financial Times noted, “the so-called ‘leveraged loan’ market, where credit is typically extended to lowly rated companies…has exploded since the financial crisis, doubling in size of the past decade to $1.2 trillion.” The FT observed that the growth of the leveraged loan market “has eviscerated traditional investor protections and made looser lending standards common…which could amplify the next downturn” (“The Debt Machine: Are Risks Piling Up in Leveraged Loans?”) Along the same line, multiple observers have called attention to the disturbing fact that many of these leveraged loans are ending up in “collateralized loan obligation” vehicles (CLO), which use the same structure as the collateralized debt obligation vehicles that became infamous during the 2008 global financial crisis. Finally, when the next recession arrives, the financial distress in bond and loan (i.e., credit) markets will likely be rapidly amplified by a number of factors. First, increasing amounts of high yield bonds and CLO tranches that are held in retail investment vehicles, like mutual and exchange traded funds, which investors could rapidly try to exit at the first sign of trouble. Second, higher capital requirements on banks has reduced the level of liquidity in bond markets. Both of these could accelerate the fall in the price of debt instruments, and the rise in their yields. Third, due to more complex corporate capital structures, weaker bond and loan covenants, and a much more litigious approach by the parties involved, workouts and restructurings of distressed leveraged loans and high yield bonds could take much longer than before, which will further increase uncertainty in financial markets and the real economy (on the latter, see, “Bankruptcy Hardball” by Ellias and Stark, and “Investors in Debt Laden Companies Face Messy Workouts” by Sujeet Indap in the 22Jan19 Financial Times. |
| This month a growing number of observers have warned that the next recession is likely closer than most people expect, and nations are generally unprepared for it. | Larry Summers noted that “The critical challenge for monetary and fiscal policy will be to maintain sufficient demand amid immense geopolitical uncertainty, increasing protectionism, high accumulated debt levels and structural and demographic factors leading to increased private saving and reduced private investment” (“We Must Prepare Now for the Likelihood of a Recession”, Financial Times 7Jan19). In the FT, Martin Wolf warned that, “[policy] room for a response to a recession would be limited by historical standards, especially in monetary policy” and that the political “transformation of the global environment creates the risk that it would be impossible to mount a coordinated and effective response to a severe global economic slowdown.” He concludes on a pessimistic note: “Unfortunately, no simple mechanisms for reducing these sources of fragility now exist. These are deeply ingrained, and given recent political developments, are more likely to get worse than better” (“Why the World Economy Feels So Fragile”, Financial Times, 8Jan19). |
| In early January, the US Federal Reserve signaled a slowdown in the pace of its planned interest rate increases in 2019 | SURPRISE According to the released minutes from the Fed’s December meeting, the main reason for this move was increasing signs of a slowing global economy (e.g., weakness in Europe and China). This is likely to reduce macro uncertainty – at least temporarily. |
| According to the released minutes from the Fed’s December meeting, the main reason for this move was increasing signs of a slowing global economy (e.g., weakness in Europe and China). This is likely to reduce macro uncertainty – at least temporarily. | SURPRISE This important column notes how slowing population growth in many emerging markets will, in the absence of substantial productivity gains, slow their economic growth rates. “According to UN projections, the old age dependency ratio in EMs (65+ over the working age population) will rise from about 10 per cent at present to more than 22 per cent by 2050; the comparable increase in mature markets is from 28 per cent to 45 per cent…the growth advantage of more than 4 percentage points that EMs enjoyed over mature markets in the 2000-2010 period has narrowed to about 2 percentage points and will probably disappear in the long run… “This potential growth slowdown puts the recent increase in EM debt in a more worrisome light…the current EM debt burden will make it more difficult to fund and build up pension assets to provide for future retirees…This will put pressure on public pay-as-you-go pension systems in EM countries, especially if government deficits and debt cannot be brought under control…failure to adequately provision for future retirees can create social tension, not conducive to growth… “In conclusion, the case for global investors especially pension funds to diversify into EM assets (younger population, higher growth and potentially superior return) is still reasonable for the foreseeable future. However, in the long run, this case depends critically on whether policymakers in EMs can implement appropriate policies to tackle the structural problems mentioned above, to improve productivity and foster inclusive growth. In this race, some countries will do better than others. Hence, the key in EM investing is to be selective in picking country and stock exposures — and not treating EMs as a homogeneous bloc.” |
| A new paper, “Unicorns, Cheshire Cats, and the New Dilemmas of Entrepreneurial Finance?”, by Kenney and Zysmann, provides insight into the interaction of technological changes, and increased access to capital for startups, has changed the competitive dynamics in many sectors of the economy, and produced more underlying deflationary pressure on prices. | SURPRISE The “increased availability of open source software, digital platforms, and cloud computing has facilitated a proliferation of startups seeking to disrupt incumbent firms in a wide variety of business sectors…[This has been accompanied by] growth in the number of private funding sources that now include crowd-funding websites, angels, accelerators, micro-venture capitalists, traditional venture capitalists, and lately even mutual, sovereign wealth, and private equity funds – all willing to advance capital to young unlisted firms. The result has been the massive growth in the number of venture capital-backed private firms termed “unicorns” that have market capitalizations of over $1 billion…The ease of new firm formation and the enormous amount of capital available has resulted in to a situation within which new firms can afford to run massive losses for long periods in an effort to dislodge incumbents… This has produced “remarkable turmoil in many formerly stable industrial sectors, as the new entrants fueled by capital investments undercut incumbents on price. Because the new firms intending to disrupt existing firms are venture capital-finance, they can afford to operate at a loss with the goal of eventually triumphing. Existing firms competing with the disruptors must be profitable to survive, while the disruptors need only keep their investors. The ultimate result is that those firms with access to capital are likely survive and displace earlier firms and thereby change their respective industrial ecosystems.” |
| | |
| | |
| | |
| | |
| | |
| New National Security Information: Indicators and Surprises | Why Is This Information Valuable? |
| “The Party Congress Test: A Minimum Standard For Analyzing Beijing’s Intentions”, by Peter Mattis | SURPRISE The Chinese Communist Party Congress is held every five years. The 19th, and most recent, was in 2017. Mattis emphasizes the important information contained in Party Congress work reports, and how seldom these important indicators are incorporated into forecasts of China’s future actions. Mattis’ analyzes the most recent work report. He notes that, “One of the benefits of working one’s way through a document like the 19th Party Congress Work Report is that the reader sees a clear nesting of ideas. At the top, national rejuvenation is identified as the overriding objective. The features of national rejuvenation are identified: (1) national reunification; (2) securing China’s international position and leadership in global affairs; and (3) “build[ing] China into a great modern socialist country that is prosperous, strong, democratic, culturally advanced, harmonious, and beautiful. Each of those words attached to Chinese modernity, as the party defines it, have specific meanings within the party context that may not resemble how we in a liberal democratic society might understand them.” For example, “’the great rejuvenation of the Chinese nation’ or ‘the Chinese dream of national rejuvenation’— the shorthand for China’s rise to great power capability and status — operates on two levels: domestic and global. There is no intermediate regional space…the report also notes national rejuvenation requires ‘toppling the three mountains of imperialism, feudalism, and bureaucratic-capitalism that were oppressing the Chinese people.’ Contemporary threats of imperialism and bureaucratic-capitalism come from beyond China’s borders…Simply put, the party congress work report does not provide any evidence for regionally constrained ambitions. To those who reject this analysis on the basis that Chinese capabilities and reach fall short of their ambitious aims, Xi Jinping said ‘we should not stop pursuing our ideals because they seem out of our reach.’ China’s capabilities today simply are not a reliable indicator of its intentions for tomorrow.” |
| “Domestic Repression And International Aggression? Why Xi Is Uninterested In Diversionary Conflict” by George Yin from Brookings | SURPRISE Rising internal opposition to Xi Jinping is an underreported story in the west. This new article provides an excellent overview. It’s key conclusion: “Forces that oppose Xi may be dormant but their powers remain intact, and criticisms of Xi’s administration have been multiplying since the 19th Party Congress.” The author also notes that, “the theory of diversionary wars posits that leaders often have the incentive to pursue aggressive foreign policies in order to divert the domestic audience’s attention from domestic troubles. Through international conflict, leaders can either foster national solidarity or demonstrate their competence.” He then asks if Xi could “seek to consolidate power by adopting an assertive foreign policy in his second term?” In his answer to this question, Yin notes that, “crucially, diversionary war theory rests on a number of assumptions, two of which do not hold for Xi today…First, that leaders prefer foreign adventure over addressing domestic troubles…[and] Second, that key domestic players want conflict…A diversionary conflict is likely to further galvanize Xi’s opposition.” That said, Yin also cautions that, “Taiwan’s pursuit of de jure independence is probably the only issue that could unite the rival CCP factions under Xi for conflict.” |
| For most of January, there were many stories speculating that the US and China might be able to reach a face saving trade deal. But at the end of the month, the US announced an expanded series of criminal charges against Huawei Communications, in addition to the charges against the company’s CFO that led to her arrest at Vancouver airport, and pending extradition to the US. | In its negotiations with China, the US is demanding structural reforms – e.g., removal of Chinese regulations forcing foreign investors to disclose their technology – that have been an important part of their economic model. Eliminating the Chinese law the compels its technology companies to cooperate with China’s military and intelligence services would be harder still, and could potentially cause sufficient embarrassment to Xi to trigger attempts at removing him from power (and perhaps subsequent infighting between different Chinese Communist Party factions at a time when economic conditions are worsening at an accelerating pace). These developments raise the probability that rather than a relaxation of the growing US/China conflict, it may instead grow more intense. One important potential consequences of this was recently highlighted by the Financial Times’ Gillian Tett, who wrote: “Do not underestimate the risk of an iron curtain in tech” which could substantially disrupt those supply chains in which China has played an important role. Should this happen, the negative impact on economic growth would likely be substantial. |
| The newly released US National Intelligence Strategy contains a very sobering warning about cyber threats. So too did the US Intelligence Community’s annual Worldwide Threat Assessment report to Congress. | SURPRISE The National Intelligence Strategy states that, “Despite growing awareness of cyber threats and improving cyber defenses, nearly all information, communication networks, and systems will be at risk for years to come. Our adversaries are becoming more adept at using cyberspace capabilities to threaten our interests and advance their own strategic and economic objectives. Cyber threats will pose an increasing risk to public health, safety, and prosperity as information technologies are integrated into critical infrastructure, vital national networks, and consumer devices.” The Worldwide Threat Assessment contained this: “Our adversaries and strategic competitors will increasingly use cyber capabilities—including cyber espionage, attack, and influence—to seek political, economic, and military advantage over the United States and its allies and partners. China, Russia, Iran, and North Korea increasingly use cyber operations to threaten both minds and machines in an expanding number of ways—to steal information, to influence our citizens, or to disrupt critical infrastructure…” “At present, China and Russia pose the greatest espionage and cyber attack threats, but we anticipate that all our adversaries and strategic competitors will increasingly build and integrate cyber espionage, attack, and influence capabilities into their efforts to influence US policies and advance their own national security interests.” In the last decade, our adversaries and strategic competitors have developed and experimented with a growing capability to shape and alter the information and systems on which we rely. For years, they have conducted cyber espionage to collect intelligence and targeted our critical infrastructure to hold it at risk. They are now becoming more adept at using social media to alter how we think, behave, and decide. As we connect and integrate billions of new digital devices into our lives and business processes, adversaries and strategic competitors almost certainly will gain greater insight into and access to our protected information…” “For 2019 and beyond, the innovations that drive military and economic competitiveness will increasingly originate outside the United States, as the overall US lead in science and technology (S&T) shrinks; the capability gap between commercial and military technologies evaporates; and foreign actors increase their efforts to acquire top talent, companies, data, and intellectual property via licit and illicit means.” “Many foreign leaders, including Chinese President Xi Jinping and Russian President Vladimir Putin, view strong indigenous science and technology capabilities as key to their country’s sovereignty, economic outlook, and national power.” |
| New publications have addressed the implications of increased cooperation between Russia and China, and the threat this poses to the west. | The title of a new RAND analysis makes an important point: “Russia is a Rogue, Not a Peer; China is a Peer, Not a Rogue.” As the report notes, “Russia and China represent quite distinct challenges. Russia is not a peer or near-peer competitor but rather a well-armed rogue state that seeks to subvert an international order it can never hope to dominate. In contrast, China is a peer competitor that wants to shape an international order that it can aspire to dominate.” Another new RAND report, “Russia’s Hostile Measures in Europe” goes into great detail about the nature and use of the “measures short of war” that Russia employs to pursue its goals. |
| Perhaps most interesting of all this month have been reports related to Putin’s falling domestic support. | SURPRISE In “Don’t Shoot the Messenger” (published in The American Interest), Karina Orloval writes that, “The Kremlin’s trusted polling firm WCIOM, which also happens to be state-owned, has been releasing the results of its surveys faster and faster, and the news isn’t good for Russia’s President Vladimir Putin. The latest poll, measuring Russians’ “trust” in politicians, shows Putin registering only 32.8 percent support—his lowest rating in more than 13 years. This follows a poll released one week ago that had Putin at 33.4 percent. Both of those are a big fall from May of last year, when almost 47 percent of Russians trusted him…[Also], the respected independent pollster Levada reported that 53 percent of the public wants the government to resign, 20 points up from a month ago. Price increases and income drops were cited as prime causes for the discontent.” |
| There has been continuing chaos in the UK this month, as Theresa May’s government struggled to find an alternative to the draft UK/EU separation agreement that was rejected by Parliament | To oversimplify, the essential stumbling block is where to place the new border between the UK and EU. The problem is that the island of Ireland is divided between the Republic of Ireland (a member of the EU), and Northern Ireland (which is part of the UK). Northern Ireland accounts for about 30% of the population of the island, and 3% of the population of the UK. Essentially there are three border options: (1) Across the Republic/Northern Ireland border. This border was removed as part of the 1998 Good Friday Agreement that ended the violent period known as “the Troubles”; (2) Across the Irish Sea that separates the island of Ireland from the island containing England, Scotland, and Wales. The Northern Ireland Democratic Union Party objects to having part of the UK treated differently – i.e., remaining under European Union regulations, and since the last UK election, Theresa May’s government’s survival depends on the DUP’s support in Parliament; or (3) Across the English Channel, to which the Republic of Ireland objects because it would be forced to accept UK regulations. The current UK/EU Separation Agreement (that was rejected by Parliament) contained a so-called “Irish Backstop” to ensure that a physical border would not be rebuilt between the Republic of Ireland and the North. The backstop would force the UK to remain in a customs union with the EU if no subsequent trade agreement between the two was reached by March 2021 – two years after the UK is due to leave the EU. As long as the customs union was in effect, the UK would be prohibited from negotiating separate trade agreements with other nations. EU negotiators have thus far been unwilling to give any ground on this arrangement, nor has the UK proposed a detailed alternative. The probability has thus increased that in March, the UK will leave the EU without a transitional customs union agreement, and revert to trading with the EU on World Trade Organization terms. Even if that happens, the Irish border issue may not go away. It has been suggested that the UK could simply state it was not going to establish new customs checks on the Northern Ireland side of the border, and thus continue to comply with the Good Friday Agreement. This would put the EU in the awkward position of having to ask the Republic to build ones on its side. Time will tell. Overall, however, Brexit has already significantly increased uncertainty, and the likelihood of a negative economic shock for both the UK and the EU at a time when their growth rates are already slowing. |
| The title of a new column by the FT’s Ed Luce raises a critical issue as we move into a period of heightened US-China competition: “America’s Strange Blind Spot Towards India” | SURPRISE As Luce writes, “Some time in the coming years, India will become the largest country in the world. It’s the only possible counterweight to neighbouring China, which is America’s only serious rival. It’s the world’s largest democracy. And it's no longer mired in hopeless poverty…India’s economic growth is likely to be higher than China’s for the next 25 years.” |
| | |
| | |
| | |
| | |
| New Social Information: Indicators and Surprises | Why Is This Information Valuable? |
| “Why Do We Retire?” a new whitepaper published by Aegon | Many developed nations face an imminent tsunami of newly retired workers, and pressure on public and private sector pension plans. Aegon aptly notes that too much of the discussion about this upcoming wave has been focused on the financial and government budget issues it raises (e.g., pensions and healthcare expenditures), and not on other issues that are equally important – for example, social connection and loneliness, and the desire of many future retirees to cut back on work, but not wholly abandon it (which would also sharply reduce stress on inadequate pension resources). This paper does a good job of framing the issues many nations will soon have to confront. |
| “By Mollycoddling Our Children, We're Fuelling Mental Illness in Teenagers”, by Haidt and Paresky, calls attention to trends that are likely to affect society for years to come. | SURPRISE The authors note a number of trends that seem sure to affect future political dynamics as todays’ teenagers enter the electorate. “Rates of anxiety disorders and depression are rising rapidly among teenagers, and US universities can’t hire therapists fast enough to keep up with the demand…We recently co-wrote a book, with Greg Lukianoff, titled The Coddling of the American Mind, about the culture that erupted on American university campuses around 2014, and has spread to some campuses in the UK and Canada. In the book we describe how they began using the language of safety and danger to describe ideas and speakers, and to demand policies based on the premise that some students are fragile (or “vulnerable”). Terms such as “safe space”, “trigger warning” and “microaggression” entered the language. These, we believe, are requests made by a generation that was deprived of the necessary quantity of social immunisations. Students now react with a kind of emotional allergic response (often referred to as being “triggered”) to things that previous generations would have either brushed off or argued against. “It’s not the kids’ fault. In the UK, as in the US, parents became much more fearful in the 1980s and 1990s as cable TV and later the internet exposed everyone, more and more, to those rare occurrences of brutal crimes and freak accidents that, as we report in our book, now occur less and less. Outdoor play and independent mobility went down; screen time and adult-supervised activities went up… “Mental health statistics in the US and UK tell the same awful story: kids born after 1994 – now known as “iGen” or “Gen-Z” – are suffering from much higher rates of anxiety disorders and depression than did the previous generation (millennials), born between 1982 and 1994. “The upward trends for depression among teenage boys and girls are happening in the UK too. Yearly measures of major depression are not available in the UK, but the NHS reports extensive mental health statistics for England from 2004 and 2017 that allow us to make a direct comparison for the same time period. Using a stricter criterion, which finds lower overall rates, the pattern is similar: up slightly for boys, nearly double for girls. “This alarming rise does not just reflect an increase in teenagers’ willingness to talk about mental health; it is showing up in their behaviour too, particularly in the rising rates at which teenage girls are admitted to hospital for deliberately harming themselves, mostly by intentionally cutting themselves. Large studies In the US and UK using data through to 2014 show sharply rising curves in the years after 2009, with increases of more than 60% in both countries. A 2017 Guardian study of more recent NHS data found a 68% rise in hospital admissions for selfharm by English teenage girls, over the previous decade. “Even more tragically, we also see this trend in the rate of teenage suicide, which is rising for both sexes in the US and the UK. The suicide rate is up 34% for teenage boys in the US (in 2016, compared with the average rate from 2006-2010). For girls, it is up an astonishing 82%. In the UK, the corresponding increase for teenage boys through to 2017 is 17%, while the increase for girls is 46%. Nobody knows for certain why recent years have seen so much more of a change for girls than boys, but the leading explanation is the arrival of smartphones and social media. “Girls use social media more than boys, and they seem to be more affected by the chronic social comparison, focus on physical appearance, awareness of being left out, and social or relational aggression that social media facilitates”. |
| “Universal Basic Income: Debate and Impact Assessment” by Francese and Prady of the IMF | The rapid improvement of automation and artificial intelligence technologies, along with stagnant K12 education results, has increased interest in the consequences of a future scenario in which the number of employed people sharply falls, and/or income inequality significantly worsens. One solution that has been proposed is a “universal basic income” provided by the government and financed with higher taxes. This new IMF paper breaks new ground with its rigorous analytical approach to the impact of different approaches to structuring a UBI program – e.g., high/low progressivity, and high/low coverage of the population. While this paper makes no policy recommendations, it does an excellent job of framing the issues surrounding a concept that may become a much more popular topic of conversation in the years ahead. |
| Demographia 2019 Housing Affordability Survey | The inability to purchase a home of one’s own is an important source of underlying social frustration. While this is drive by economic factors (and before that technological change), growing frustration eventually finds expression in politics. These data are therefore of more than passing importance for what they may portend for politics in the future. As Wendell Cox writes on newgeography.com, the survey “rates middle-income housing affordability using the “Median Multiple,” which is the median house price divided by the median household income” Ratios of 3.0 and under are deemed affordable, while those of 5.1 and over are “severely unaffordable”. “There are 9 affordable major housing markets, all in the United States. There are 29 severely unaffordable major housing markets, including all in Australia (5) and New Zealand (1) …Thirteen of the major markets in the United States are severely unaffordable (out of 55), seven in the United Kingdom (out of 21 major markets) and two out of Canada’s six.” “The most affordable major housing markets are in the United States, with a moderately unaffordable Median Multiple of 3.9, followed by Canada (4.3) and Singapore (4.6). Ireland and the United Kingdom both have Median Multiples of 4.8. The major markets of Australia (6.9), New Zealand (9.0) and Hong Kong (20.9) are severely unaffordable.” |
| “Why the Housing Ladder Doesn’t Exist Anymore” by Thomas Hale, Financial Times 15Jan19 | This excellent article shows why the traditional assumption that one should start out by buying a small property and then trade-up over time to larger ones may be fatally flawed in today’s economy. If this is the case, once many of the people who believed in this approach discover that their dreams have been dashed, it seems likely to add to the current level of social frustration and anger directed towards elites. |
| “What The Next 20 Years Will Mean For Jobs – And How To Prepare”, by Stephane Kasriel for the World Economic Forum | This forecast of a future economic scenario has important implications for future social and political developments. Some highlights: “The majority of the workforce will freelance by 2027 (see, “Freelancing in America 2017”)… Fast technological change means that the people operating constantly evolving machines need to learn new skills – quickly. Our current education system adapts to change too slowly and operates too ineffectively for this new world… Our tax, healthcare, unemployment insurance and pension systems were all created for the industrial era, and they won’t serve anyone in the future if we can’t make significant reforms.” Unfortunately, there is little evidence that the political system is coming to terms with these changes and the social uncertainty, fear, and frustration they are creating in the middle class. To cite but one example: in a world where employment is more uncertain than ever, a single payer government program that separates health insurance from employment seems eminently logical – but it is already the target of multiple attacks in the United States. |
| “Beyond Gentrification” by Joel Kotkin and Wendell Cox for he Center for Opportunity Urbanism | The authors highlight how the gentrification process in many cities has led to social frustration and, as we have seen (e.g., in the Brexit and US presidential votes in 2016) political consequences. And there are no signs these trends are reversing. “We found that, in most cities, unbalanced urban growth has exacerbated class divisions, while doing little to address the decline of middle class households…Cities are battling for high-tech jobs, sometimes offering lavish inducements, but few poor inner-city residents are likely to work as coders for Amazon or Google… Little effort is being made to encourage the creation of sustainable middle-income jobs in industrial, warehouse, and business service firms, which once sustained communities outside the urban “glamour zone…Cities need a new urban development paradigm that goes beyond the current focus on tourism, media, and tech, which creates many high and low-end jobs but few in the middle.” |
| “How Real is Systematic Racism Today?” by John Staddon is a James B. Duke Professor of Psychology and Professor of Biology, Emeritus, at Duke University | SURPRISE In a world where systematic racism in increasingly claimed to be the cause of many social ills, this paper provides a rigorous analysis of this issue. For that alone, it is well worth a read. The author concludes: “the charge of systemic discrimination deflects attention from the proximal causes, endogenous as well as exogenous, of the racial disparities that led to its invention. Disparities—racial, ethnic, or gender-based—are not proof of anything. Disparities raise questions about their cause. Absent further information, a racial disparity does not favor one answer over others. To say, as some academic critics have, that “When I See Racial Disparities, I See Racism” is simply wrong… “The beauty of ‘systemic racism’ is its air of permanence. It is here forever, and its victims must be compensated in perpetuity. It has become the elusive and inexpugnable cause of all the ills of people of color. And it provides an endless supply of ammunition for those whose careers depend on the persistence of racism. It has become a cause of racial division rather than part of the cure. It should be abandoned.” |
| “What You Do At Work Matters: New Lenses On Labour” by Mealy et al | SURPRISE The authors create a new way of categorizing jobs by the activities performed. They then use network science to relate clusters of job activities to each other, to assess the ease of moving across occupations, which is a critical issue as the replacement of labor by automation, AI and other technologies accelerates. Critically, “they find strongly segregated clustering of high and low risk occupations…Such divisions in labour not only reiterate current concerns about the distributional consequences of automation, but also highlight potential challenges for workers seeking to transition into jobs with lower automation risk.” This points to more intense social and political conflicts if more creative policy solutions are not created and effectively implemented. |
| “Why Big Brother Doesn’t Bother Most Chinese” by Adam Minter, on Bloomberg | SURPRISE This is an extremely disturbing article, and therefore likely an important one. The author writes, “Chinese have already embraced a whole range of private and government systems that gather, aggregate and distribute records of digital and offline behavior. Depicted outside of China as a creepy digital panopticon, this network of so-called social-credit systems is seen within China as a means to generate something the country sorely lacks: trust. For that, perpetual surveillance and the loss of privacy are a small price to pay.” To be sure, in the past research has found that China is a society relatively low in trust; as in other nations with similar levels of trust, this has historically led to a preference for family groups as the dominant form of business organization. Yet for this same reason, the social credit system seems to be acceptable to many people. With measures of interpersonal trust trending downward in many western nations, developments in China have potentially worrisome implications for future developments in other nations. |
| Released in conjunction with the World Economic Forum, the latest Edelman Trust Barometer evidences continuing disillusion among publics around the world that is increasing the attractiveness of more extreme political views. | Across a range of countries, only 20% believe the system is working for them. In most developed countries, a majority of the population does not believe they will be better off in five years. Across both developed and developing nations, media is now trusted less than business and government. |
| “Feel the Fear” by John Hagel on Edge Perspectives | SURPRISE Hagel writes, perceptively I think, that “fear is becoming pervasive and increasingly intense around the world…Why is that happening? There are certainly many reasons, but my research suggests that we are in the early stages of a Big Shift that is generating mounting performance pressure on all of us. No matter what our credentials and track record in the past, the pressure is mounting to get even better faster in the future. It’s totally natural that we would feel fear in that kind of world, especially if we were taught that getting the right degrees and pursuing the right jobs would ensure our success. “This mounting performance pressure isn’t just about economic pressure and the ability to earn a living. It takes many different forms, including an accelerating pace of change where things we could rely on in our lives – values, norms, practices, etc. - suddenly are no longer there. But, it’s not just mounting performance pressure that’s driving the fear. There’s also a growing realization that our institutions are not equipped to help us respond to the mounting performance pressure. In fact, there’s a sense that our institutions are making us even more vulnerable to that growing pressure. That’s one of the key reasons that trust in all our institutions is rapidly eroding globally.” At some point, the mounting feeling of fear that Hagel so well captures, and the inability of our institutions to successfully address its root causes, will inevitably produce even more changes in the political environment than we have already seen. |
| | |
| New Political Information: Indicators and Surprises | Why Is This Information Valuable? |
| In the United States, the announced Democratic candidates for president in the 2020 election are taking positions well to the left of traditional Democratic party positions on a range of policy issues. In some ways, this mirrors the way Green parties in Europe are winning voters from traditional left of center socialist parties. | While polling data shows that a majority of US voters are concerned about increasing taxes on “the rich”, and healthcare (as economic disruption increases employment uncertainty, and makes the link between employment and health insurance less and less tenable), other progressive positions, and the tendency of many left-wing Democrats to impose litmus tests to ensure candidates’ ideological purity, seem likely to cost candidates’ support in the vital center of the electorate. This will be of particular importance if wither (a) Donald Trump is removed from office or (b) he is defeated in the Republican primary, resulting in nomination of a more centrist Republican candidate. |
| Two analyses, from 2016 and 1981, put the leftward shift of the Democratic party into perspective, and frame that strategic challenge facing presidential candidates in 2020. | SURPRISE In “Political Divisions in 2016 and Beyond”, Lee Drutman replicated Lilie and Maddox’ classic 1981 paper, “An Alternative Analysis of Mass Belief Systems: Liberal, Conservative, Populist, and Libertarian.” Both papers located sampled voters in a 2x2 matrix, defined by their positions on economic and social issues. Liberals and Conservatives take consistent views on both sets of issues. Libertarians are socially liberal and economically conservative; Populists are socially conservative and economically liberal. When comparing the two papers, the first striking finding is the change over 35 years in the percent of voters that the respective authors find in the different categories (note that this is an approximation, as the methodologies weren’t exactly the same). The size of the conservative bloc was essentially unchanged; it was estimated to be 25% of the electorate in 1981 (disregarding Lilie and Maddox fifth category of “inconsistents”), and 23% in 2016. Populists were also roughly the same, at 33% and 29%. Liberals, however, had grown from 23% to 45%, while Libertarians had shrunk from 19% to 4%. Drutman finds that in 2016, most Clinton voters were Liberals, while Trump voters were a combination of Conservatives and Populists (Libertarians split their votes about equally). In 2020, the essential question is whether a progressive Democratic candidate’s liberal positions on economic issues (e.g., single payer healthcare) will be able to attract a significant number of Populist voters, in spite of the Democratic candidate’s Liberal position on hot button social issues like identify politics and freedom of speech. |
| “Fake News on Twitter During the 2016 U.S. Presidential Election”, by Grinberg et al | SURPRISE “The spread of fake news on social media became a public concern in the United States after the 2016 presidential election. We examined exposure to and sharing of fake news by registered voters on Twitter and found that engagement with fake news sources was extremely concentrated. Only 1% of individuals accounted for 80% of fake news source exposures, and 0.1% accounted for nearly 80% of fake news sources shared. Individuals most likely to engage with fake news sources were conservative leaning, older, and highly engaged with political news.” |
| “Bureaucracy versus Democracy” by Philip Howard in The American Interest | SURPRISE Howard has written an insightful article that analyzes another underlying source of voter frustration with political institutions, noting that, “diagnoses of voter alienation converge at one point: a sense of disempowerment by Americans, at every level of responsibility, to make practical and moral choices. Almost without our noticing when it happened, bureaucratic structures have crowded out human agency.” In the face of the many problems facing not just the United States, but other nations as well, too often bureaucracies have been unable to design and/or implement effective policies. |
| The World Economic Forum meeting at Davos produced multiple stories talking about the “grim” or “dark” mood among attendees. | For example, as Fareed Zakaria wrote in the Washington Post (“Davos is a Microcosm of the World, and the Outlook is Grim”), “The atmosphere at the 2019 World Economic Forum reflects the global picture perhaps more genuinely than in years past, and the painting is not very pretty. The mood here is subdued, cautious and apprehensive. There’s not much talk of a global slowdown, but no one is confident about a growth story, either. There is no great global political crisis, yet people speak in worried tones about the state of democracy, open societies and the international order.” Here is the FT’s Gideon Rachman: “Everybody needs heroes — even Davos plutocrats. But the “global elite” is currently out of enthusiasm and ideas. In the corridors of the World Economic Forum last week, Kenneth Rogoff, the Harvard economist, summed it up: “This is the flattest Davos I can remember. Normally, there is a star country or a star industry that everybody is talking about. But this year, there is nothing” (“Davos 2019: No More Heroes for the Global Elite”). |
| | |
| | |
| | |
| Financial Markets and Investor Behavior: Indicators and Surprises | Why Is This Information Valuable? |
| A number of new papers have shed more light on the genetic roots of risk tolerance and risky behaviors | SURPRISE To the extent that they are genetically based (as opposed to learned or situationally based), differences in risk tolerance are likely to be impervious to attempts to modify them (e.g., through education). This suggests that financial advisors (and regulators) should instead focus on ways to compensate for them. In “Genome-Wide Association Analyses of Risk Tolerance and Risky Behaviors in Over 1 Million Individuals Identify Hundreds of Loci and Shared Genetic Influences”, by Auton et al, the authors “find evidence of substantial shared genetic influences across general risk tolerance and risky behaviors in the driving, drinking, smoking, and sexual domains.” Other research has found that impulsivity and risk tolerance are actually separate concept with different genetic and neurochemical roots (e.g., see, “Risk Taking and Impulsive Behaviour: Fundamental Discoveries, Theoretical Perspectives and Clinical Implications” by Isles et al). In “Relationships Among Impulsive, Addictive and Sexual Tendencies and Behaviours: A Systematic Review of Experimental and Prospective Studies in Humans”, Leeman et al find that “generalized, self-reported impulsivity is a predictor of addictive and sexual behaviours at a wide range of severity.” Separate research has found that impulsive behavior also has a strong genetic component (e.g., see “Genetics of Impulsive Behavior” by Bevilacqua and Goldman). In “Three Gaps and What They Mean for Risk Preference”, Hertwig et al note that risk tolerance measures based on self-reported preferences are more stable over time than those based on observed behaviors.” In our experience, this reflects the significant role that situational factors play in many decisions taken in the fact of risk, uncertainty, and ignorance. |
| The end of 2018 also saw the publication of a number of articles describing the increasing challenge to active management posed by algorithms. | The FT’s Robin Wigglesworth noted “a flurry of finger-pointing by humbled one-time masters of the universe, who argue that the swelling influence of computer-powered quantitative, or quant, investors and high-frequency traders is wreaking havoc on markets and rendering obsolete old-fashioned analysis and common sense” (“Volatility: how ‘algos’ changed the rhythm of the market”, FT 8Jan19). A recent research paper highlighted the increasing efficiency that appears to have resulted from the deployment of algorithmic strategies in some markets. In their study of the forward exchange rate market between 1994 and 2016, Levich et al “find widespread evidence of excess-predictability, hence currency market inefficiency, in the early part of the sample period and then at specific times, such as the recent global financial crisis. In the more recent part of the sample period, the evidence of excess-predictability [i.e., inefficiency] is largely limited to emerging market currencies” (“Measuring Excess-Predictability of Asset Returns and Market Efficiency over Time”). However, another paper found that systematic/algorithmic strategies do not yet deliver superior performance in more complex environments, such as global macro funds (see, “Systematic and Discretionary Hedge Funds: Classification and Performance Comparison” by Chuang and Kuan). Another recent research paper highlighted the human biases that some algorithmic strategies seek to exploit: “Most research on heuristics and biases in financial decision-making has focused on non-experts, such as retail investors who hold modest portfolios. We use a unique data set to show that financial market experts (institutional investors with portfolios averaging $573 million) exhibit costly, systematic biases. “A striking finding emerges: while investors display clear skill in buying, their selling decisions underperform substantially in terms of both benchmark-adjusted and risk-adjusted returns. We present evidence consistent with limited attention as a key driver of this discrepancy, with investors de-voting more attentional resources to buy decisions than sell decisions” (“Selling Fast and Buying Slow: Heuristics and Trading Performance of Institutional Investors” by Klakow Akepanidtaworn et al). |
| Along with many others, we mourn the passing of Jack Bogle, who encouraged us when we launched The Index Investor back in 1997. | In all the coverage of his accomplishments, a key issue, that we know bothered Bogle deeply, has received far too little attention: the difference between index investing and passive investment. Bogle was suspicious of exchange traded funds from the moment they were launched, fearing that over time they would grow in number, be based on ever narrower indexes, and encourage investors to frequently trade. In short, he feared that ETFs would become the antithesis of long term passive investing in a diversified portfolio of mutual funds that are based on broad asset class indexes. His fears were sadly prescient. For example, a recent article (“Index Funds Are King, But Some Indexers Are Passive-Aggressive”, by Peter Coy on Bloomberg, 24Jan19), and a recent academic paper (“The Active World of Passive Investing”, by Easley et al) both note that the majority of ETF products amount to lower cost active strategies based on indexes that track a wide range of sectors, regions, styles, factors, and investment themes. Picking narrowly defined index products instead of individual stocks or bonds or commodities does not make one a passive investor. To be sure, there will always be an active part of investing, whether at the level of investment policy formulation (e.g., how much to save, when to retire, target bequests, etc.), asset class definition, portfolio construction, product selection and timing to implement portfolio strategy, and/or policy and portfolio risk management decisions. However, for more than 20 years we have strongly supported Jack Bogle’s view that most investors can maximize the probability of achieving their goals by passively investing in a broadly diversified portfolio of broadly defined index funds. Our key additions to that philosophy is the recognition that avoiding large losses is critical to achieving long-term goals, particularly when markets can operate far from equilibrium. Wise investors therefore pay careful attention to both current asset class valuation metrics and the complex mix of macro forces that cause them to change over time. |
| | |
| | |
| | |
| | |
| | |
How Close is the Macro System to One or More Critical Thresholds?
As we have noted, the macro drivers of financial market regime changes typically follow a rough chronological sequence, from technology to economic, security, social, and political causes and effects. Yet there are many feedbacks loops between them, creating complex root causes for many of the critical thresholds we have identified.
Understanding the time dynamics in this complex system is critical to avoiding substantial downside investment risk.
We use the UK Met Office Warning Model to communicate our assessment of these time dynamics. We estimate the time remaining before a critical macro system threshold is reached that could trigger a regime change, which is usually accompanied by substantial changes in asset class valuations.
The model uses three increasingly serious levels of warning, from “Be Aware” (condition yellow), to “Be Prepared” (condition orange), to “Take Action” (condition red).
For our purposes, we denote as “Be Aware” (yellow) critical thresholds that we assess to be three or more years away. We estimate that “Be Prepared” (orange) thresholds could be reached within 1 to 3 years. “Take Action” thresholds are very likely to be reached within one year.
Given their nature, we also note that in our three “wildcard” areas (Environment and Energy related; Disease and Human Caused Bioevents; and Cyber and Electromagnetic Events), our forecasts have higher levels of uncertainty.
The following charts summarize our current estimate of the time remaining before different critical thresholds will be reached.
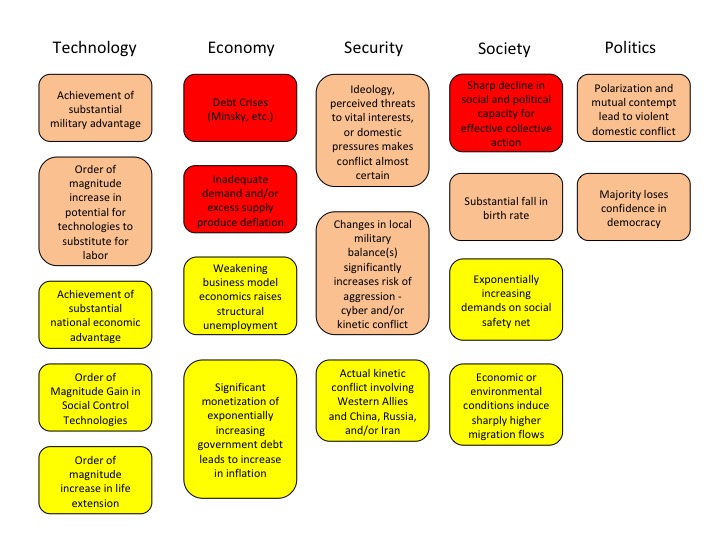
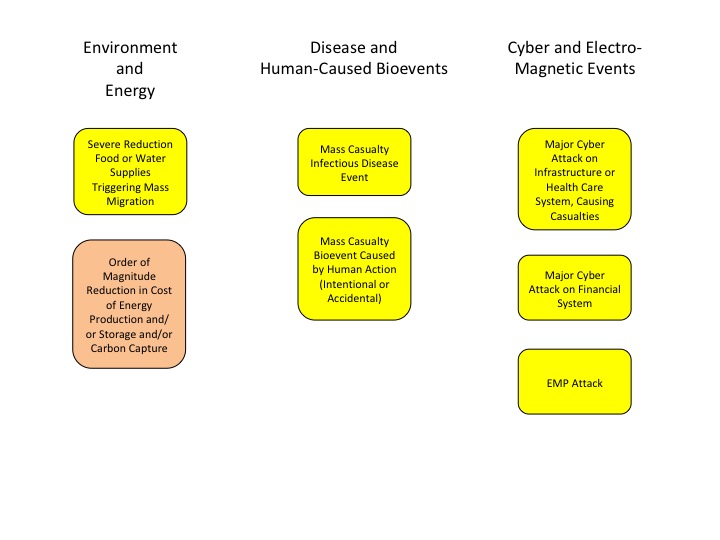
At the highest level, we believe the global macro system can be in one of four states, based on its degree of order versus disorder, and degree of social cooperation versus conflict. We believe that the system is currently in its most uncertain state, characterized by high degrees of underlying disorder and social conflict.
Our current forecast question is this: what is the probability we will either remain in the High Uncertainty Regime or transition to another regime over the next twelve months?
We currently estimate there is a 50% chance of remaining in the High Uncertainty Regime over the next 12 months (an increase of 10% from last month), which will see the commencement of what promises to be a tumultuous US presidential campaign, and what looks increasingly likely to be a so-called “Hard Brexit” with the UK leaving the EU without a transitional agreement.
We also conclude that over the next 12 months, the probability of returning to the Normal Regime is slight, at 5%, as is the probability of entering the High Inflation regime over the next 12 months, at only 5%.
We estimate that the probability of entering the Persistent Deflation Regime over the next 12 months has declined 10% to 40%, as a result of the Federal Reserve’s decision to back away from its planned rate increases and the higher probability of the US and China reaching a trade agreement, as worsening economic conditions put more pressure on Xi Jinping, and worsening political conditions putting more pressure on Donald Trump. Both leaders need a win, and a face saving trade agreement could provide it. Both of these developments will slow the momentum global economic decline that up to now has been accelerating.
While we expect the High Uncertainty Regime will produce declines of 20% or more in equity asset classes, it is unlikely that any other asset class will experience a gain of 20% or more. We estimate there is a roughly even chance that gold could be the exception, with that increase heavily tied to continued global confidence in the US government and economy. While the apparent inflation and political uncertainty premia in the gold price today are high relative to the last 25 years, they are still below the peak reached in 2012, and it is possible that herding in the face of increasing uncertainty could produce 20% price gains.
Pre-Mortem Analysis
One of the most important forecasting disciplines is to ask yourself why your forecast could be wrong. Dr. Gary Klein’s research has shown that a very powerful and insightful way to do this is via a “pre-mortem analysis.” This method asks you to assume that it is a point in the future, and your forecast has been proven wrong (or your strategy or company has failed). You are then asked to look backward from this imagined point in the future, to explain why you failed, what you missed, and what you could have done differently to avoid your fate.
The pre-mortem method takes advantage of the fact that humans reason much more concretely and in more detail when explaining the past than they do when trying to forecast the future.
So let us assume that it is one year from now, and our current forecast has turned out to be wrong.
How did this happen? What developments did we fail to anticipate?
At the end of January 2019, the leaders of the world’s three major powers – Xi Jinping, Donald Trump, and Vladimir Putin are all facing weakening economies and declining political popularity. History teaches us that this can lead to increased “foreign adventurism” to distract the public from worsening domestic conditions, as a nation rallies around its leader in a period of heightened external conflict. Should such a conflict develop between China and the United States, or between Russia and one or more European countries, it would generate a sharp increase in uncertainty that would likely cause a sharp economic slowdown and, given high debt levels, speed the arrival of the Persistent Deflation Regime.
With the UK “crashing out” of the EU – i.e., “Hard Brexit” – looking more likely by the day, it could also be possible that we have underestimated the economic disruption that will result. This could also cause a sharp increase in uncertainty, not the least because it will further undermine public confidence – perhaps on both sides of the Atlantic – in current political leaders’ ability to successfully navigate an increasingly complex and disordered environment. This could set the stage for later electoral wins by populist politicians on either end of the political spectrum, such as Jeremy Corbyn or Marine LePen. This scenario too would increase the probability of entering the Persistent Deflation Regime.
Note: Combining this Forecast with Others and Extremizing the Result Should Increase Predictive Accuracy
Research has found that three steps can improve forecast accuracy. The first is seeking forecasts based on different forecasting methodologies, or prepared by forecasters with significantly different backgrounds (as a proxy for different mental models and information). The second is combining those forecasts (using a simple average if few are included, or the median if many are). The final step, which significantly improved the performance of the Good Judgment Project team in the IARPA forecasting tournament, is to “extremize” the average (mean) or median forecast by moving it closer to 0% or 100%.
Forecasts for binary events (e.g., the probability an event will or will not happen within a given time frame) are most useful to decision makers when they are closer to 0% or 100% than the uninformative “coin toss” 50%. As described by Baron et al in “Two Reasons to Make Aggregated Probability Forecasts More Extreme”, forecasters will often shrink their probability estimates towards 50% to take into account their subjective belief about the extent of potentially useful information that they are missing.
When you average multiple forecasters’ estimates, you are including more information, which should increase forecast confidence and push the mean estimate closer to 0% or 100%. However, this doesn’t happen when you use simple averaging. For this reason, forecast accuracy is increased when you employ a structured “extremizing” technique to move the mean estimate closer to 0% or 100%.
You can download an extremizing model from our website to use when combining the forecasts you use in your decision process. The extremizing factors in our model are those that the Good Judgment Project found maximized the accuracy of combined forecasts. Note that the extremizing factor is lower when average forecaster expertise is higher. This is based on the assumption that a group of expert forecasters will incorporate more of the full amount of potentially useful information than will novice forecasters.
Feature Article: Understanding and Predicting Uncertainty Shocks: An Update
Back in 2010, The Index Investor published a two-part series on “Understanding and Predicting Uncertainty Shocks”. Since then, a lot more research on the root cause and effects of uncertainty shocks has been published. This month we briefly review highlights from this research, as well as their implications for investors.
At the outset, let’s all agree that the definition of “uncertainty” is notoriously hard to pin down. The broadest definition we’ve seen is “the absence of certainty.” A better definition may be “doubt that produces anxiety and inhibits action.”
As a practical matter, this definition situates uncertainty in the middle of a spectrum that runs from certainty to risk to uncertainty to ignorance. In the face of certainty, there is no doubt, and action is not inhibited. Nor is action typically inhibited in risky situations, where the full range of possible outcomes, along with their consequences and probabilities, are all believed to be well understood. Strangely enough, it is also usually the case that ignorance does not inhibit action. As John Maynard Keynes noted in Chapter 12 of The General Theory of Employment, Interest, and Money, in the face of ignorance we typically adopt “shared conventions” (i.e., common assumptions) that enable action. As Keynes noted, the most familiar of these “lies in assuming that the existing state of affairs will continue indefinitely, except in so far as we have specific reasons to expect a change.”
More so than risk or ignorance, it is uncertainty that is usually the greatest obstacle to action. More specifically, doubt and anxiety typically peak when we confront situations in which we do not understand the full range of possible future outcomes, and/or their consequences, and/or the relative likelihood that they will occur.
The extent of uncertainty we confront today is arguably greater than ever before. There are two main reasons for this.
The first is the inexorable tendency of systems (including organizations) to become more complex over time. Thanks to the second law of thermodynamics, in the absence of new injections of energy and/or information, open systems will inexorably become more disordered over time. Increasing disorder creates problems, and we use energy and information to create solutions to them. Yet these new solutions are often more complex than the ones that preceded them, and thus lead to new problems, necessitating even more complex solutions, whether technological or organizational.
As complexity accumulates, it becomes ever more difficult to fully explain the system effects we observe, because of the existence of multiple interacting causes, some of which produce non-linear and time-delayed effects. In the absence of causal understanding, prediction becomes more difficult, or devolves to associational/statistical reasoning, as in the case today’s deep learning methods whose underlying logic is often difficult or impossible to explain.
The second reason uncertainty is higher today than ever before is the dramatic increase in global connectivity over the last decade. While the increase in complexity has made the behavior of many systems more non-linear, the exponential increase in connectivity and the speed with which information flows across these connections has made many socio-technical systems more tightly coupled (both internally and externally) than ever before. Thirty-five years ago, in “Normal Accidents”, Charles Perrow famously observed that unexpected failure pathways (and the uncertainty they create) increase exponentially as system complexity and connectivity increase.
Recent Research
Research into uncertainty shocks has in recent years been greatly aided by the development of specific indexes for measuring uncertainty, based on the pioneering research of Baker, Bloom, and Davis in “Measuring Economic Policy Uncertainty”.
“Really Uncertain Business Cycles”, by Bloom et al uses a model of the economy with heterogeneous agents (rather than a single representative agent) to find that “uncertainty shocks can generate drops in GDP of around 2.5%”. Increased uncertainty also initially reduces the initial positive impact of policy actions taken to stimulate the economy in a recession.
In “The Nonlinear Effects of Uncertainty Shocks”, Jackson et al from the Federal Reserve Bank of St. Louis find that “when uncertainty is relatively low, fluctuations in uncertainty have small, linear effects. [However] in periods of high uncertainty, the effect of a further increase is magnified, and have a more pronounced effect on real economic variables…This is due to uncertainty propagating through both reductions in consumption spending and business investment and employment.”
“The Macroeconomic Impact of Financial and Uncertainty Shocks”, by Caldara et al finds that financial shocks are distinguishable from uncertainty shocks; however the latter “have an especially significant economic impact when they trigger a tightening of financial conditions, as in the Great Recession.” These same issues are also addressed in another paper, “The Real and Financial Impact of Uncertainty Shocks”, by Alfaro et al, which also concludes that uncertainty shocks can be particularly damaging when financial conditions are fragile.
In “Policy Uncertainty and Aggregate Fluctuations”, Mumtaz and Surico find that uncertainty about taxes and government debt have a “large and persistent effect on output, consumption, investment, consumer confidence, and business confidence.” In contrast, uncertainty about government spending and monetary policy has a significantly smaller impact on the real economy.
In “Uncertainty Traps”, Fajgelbaum and his co-authors show “how large by apparently short-lived uncertainty shocks can generate long-lasting recessions.” As noted by other researchers, an increase in uncertainty generates a fall in consumption and investment. “Since agents learn from the actions of others, information flows slowly in times of low economic activity, uncertainty remains high, further discouraging consumption and investment” in a self-perpetuating cycle.
Finally, in “The Evolving Impact of Global, Region-Specific, and Country-Specific Uncertainty”, Mutaz and Musso find that “common global uncertainty plays a primary role in explaining the volatility of inflation, interest rates, and stock prices.” This is similar to the conclusions in a recent IMF working paper “Media Sentiment and International Asset Prices”, which found that “not all news sentiment is alike. Changes in global news sentiment have the largest impact on equity returns around the world, which does not reverse in the short run.”
Similarly, in their new paper, “What are Uncertainty Shocks?”, Kozeniauskas et al begin by observing that “one of the primary innovations in modern business cycle research is the idea that uncertainty shocks drive aggregate fluctuations. A recent literature demonstrates that uncertain shocks can explain business cycles, financial crises, and asset price fluctuations with great success. But the measures of uncertainty used are wide ranging…If these disparate measures are really capturing a common underlying shock, what is it?”
To answer this question, they note that, “people become uncertain after observing an event that makes them question future outcomes. That raises the question: What sorts of events can make agents uncertain in a way that shows up in a wide variety of disparate measures?” They note that the fundamental driver of uncertainty shocks across multiple metrics is unexpected changes in the macro political economy (including perceived “disaster” or tail risk). This is also the exact focus of analysis and forecasting here at The Index Investor.
What Causes Uncertainty Shocks?
The economist Rudiger Dornbusch famously noted that, “crises take a much longer time coming than you think, and then happen much faster than you would have thought.”
Today’s hyperconnected world provides ample evidence of the accuracy of this insight. The more connected we become, the greater the potential for rapid shifts in opinion and behavior that create new strategic risks for many investors and organizations.
In order to better anticipate these sudden and substantial shifts, investors should understand the underlying processes that are at work. In practice, these often operate together, with positive (amplifying) feedback loops between them.
Our starting point is Daniel Kahneman’s distinction (made in his book, “Thinking Fast and Slow”) between two modes of thought.
“System 1” is rapid, instinctive, based on association, and generally unconscious. It generates fast conclusions and emotions that prime us for actions (e.g., fight or flight) that, from an evolutionary perspective, have been highly adaptive for the survival and success of the human species.
In contrast, “System 2” thinking is slower, deliberate, logical, and conscious. Because it is also more effortful, most human cognition is based on System 1, not System 2.
Rapid shifts in popular perception, opinion, and behavior that generate uncertainty shocks originate in both System 1 and System 2.
In the case of System 1, the most primal driver is human beings’ capacity to rapidly transmit fear, through a variety of non-verbal means, including facial expressions and odor.
A slightly more evolved System 1 response is the automatic increase in our desire to avoid disagreement or abandonment by a group that occurs when perceived uncertainty or adversity increase. In the evolutionary sense, this is adaptive behavior. However, in today’s environment it is the root cause of excessive conformity and groupthink in periods of high uncertainty, which, as we will describe below, reduces the diversity of narratives in a system and sets the stage for sudden, substantial change.
Conscious and effortful System 2 processes can also contribute to uncertainty shocks.
In “The Evolution of Social Learning and Its Economic Consequences”, Bossan et all demonstrate how over the course of evolution, social learning – deliberately imitating others – has became dominant. They note that this has had three critical effects. “First, for better or worse, the decisions of social learners are more exaggerated than those of individual [trial and error] learners. Second, social learners react with a delay to changes in the environment. Third, the behavior of social learners can become more and more detached from reality.”
In “Social Learning Strategies Regulate the Wisdom and Madness of Interactive Crowds”, Toyokawa et al ask, “why do groups of individuals sometimes exhibit collective wisdom and other times maladaptive herding?” They find that “challenging tasks [which generate greater uncertainty] elicit more conformity among individuals, with rates of social copying increasing with group size, leading to a higher likelihood of herding among large groups confronted with high uncertainty.”
Similar conclusions have been reached by two other research teams, including Escudero and Polavieja in “Adversity Magnifies the Importance of Social Information in Decision Making” and Rendell et al in “Why Copy Others? Insights from the Social Learning Strategies Tournament”.
Researchers have also found that while “loss aversion” is a normal human response when the result of a decision will remain private, when those results will be visible to others gains become more important (see, “Interdependent Utilities: How Social Ranking Affects Choice Behavior” by Bault et al). Combine this with human’s optimism and confirmation biases, and you can see why investors have a bias towards believing in positive market and macro narratives despite accumulating evidence that tells a more negative story.
Still other research finds that a relatively small fraction of agents in a population (about 10% or more) can produce and sustain significant opinion shifts (for example, see, “Social Consensus Through the Influence of Committed Minorities” by Xie et al, and “Committed Activists and the Reshaping of the Status Quo Consensus” by Mistry et al). Put differently, when a relatively small percentage of people in a group switch to a different narrative, or when an even smaller but more highly connected group does this, sudden and substantial changes in behavior and asset values – a classic uncertainty shock – can result.
Broadly speaking, decisions made by System 2 are based on three types of input: private information not available to everyone, public information, and social information.
As described in the work of a number of researchers (e.g., David Tuckett, Robert Shiller, Paul Ormerod, and Marvin Cohen), in the face of situations characterized by high complexity and uncertainty, humans tend to decide and act not on the basis of detailed quantitative analyses (which are impractical and often impossible), but rather on the basis of so-called “conviction narratives” or, more simply, the stories we tell ourselves and others to justify our beliefs and actions on the basis of relatively simple causal models.
As system complexity increases and causation becomes exponentially more difficult to fully understand, these simplified narratives rest on progressively more fragile assumptions (for more on this, see Gary Klein and Robert Hoffman’s papers on “Explaining Explanation”).
These narratives produce varying levels of certainty (or “conviction”), along with similarly varying degrees of emotional excitement or anxiety regarding the accuracy of our perceptions, the appropriateness of our proposed actions, and the likelihood they will achieve our goals (e.g., see: “News and Narratives in Financial Systems: Exploiting Big Data for Systematic Risk Assessment” by Nyman et al, and “The Economics of Radical Uncertainty” by Paul Ormerod).
From the aggregation and sharing of these individual conviction narratives and the net impact of their associated levels of emotional valence and arousal there emerges the phenomenon Keynes called “animal spirits," or what we more generally call the level of public confidence (and its complement, the level of uncertainty).
People have varying degrees of conviction about the accuracy and importance of the private information they possess. As we have noted, in the face of high uncertainty, or when they are members of large groups (which naturally arise in our age of hyper-connectivity) people will often weigh social information much more heavily than private information when constructing narratives to explain the past and forecast the future.
The surprising result is that increasing uncertainty therefore tends to produce a reduction, rather than an increase, in the number of competing narratives in a population, which makes a system more susceptible to sudden and dramatic change.
Under these circumstances, an unexpected public signal – for example, the announcement that a high-ranking government official has been indicted for a crime, or that a key party is abandoning a coalition government – can quickly undermine fragile but widely believed narratives, and cause dramatic changes in consumer and business confidence and behavior.
In a hyper-connected world, this result can also be produced endogenously, if, as noted above, a relatively small percentage of the population changes its view due to accumulating private information. Indeed, this is the underlying causal logic guiding the actions of those who attempt to change public opinion by targeting information (be it press releases or fake news) at highly connected people (e.g., “influencers”) in social networks.
Can We Anticipate Uncertainty Shocks?
After four years on the Good Judgment Project, there isn’t any doubt in my mind about that. The more important questions are how far in advance we can do this, at what level of aggregation, with what degree of accuracy, and whether and to what extent we act on our forecasts in a timely manner.
Let’s look first at the time horizon question. Perhaps the oldest technique for anticipating uncertainty shocks in financial markets is calculating broad asset class valuation ratios, and comparing them to historical averages. Closely related to this is the work of Didier Sornette and others on the identification of emerging financial market bubbles. However, when these techniques lead to the conclusion that an asset class is severely overvalued (and therefore likely to produce a future uncertainty shock), you will always be told that, “this time it’s different.” Reinhart and Rogoff looked at eight centuries of data and wrote a book with this title to remind you that it’s not.
The larger problem, as Keynes said, is that, “the market can stay irrational longer than you can stay solvent.” To which professional asset managers often add, “or sustain the career risk of being underweight in an asset class when both its returns and its overvaluation is increasing.”
That has led to the search for tools and methods that would enable a manager to more accurately time the arrival of uncertainty shocks. The simplest of these are based on differential returns between assets that perform best under different regimes (e.g., persistent deflation or high inflation). Other simple tools use debt market credit and liquidity spreads. We use all of these.
More advanced methods either make use of larger amounts of data and/or advanced methods of extracting insights from it. A simple example of this is our use of the month-to-month autocorrelation of returns across multiple asset classes, which is an indicator that research has found to be useful (in some, if not all cases) when predicting large changes in the behavior of complex systems.
Various machine learning techniques are now widely used to extract insights from the large amounts of data that is available today. For example, text data from traditional and social media feeds is mined to identify emerging issues and measure changes in various types of sentiment (see, for example, Richard Nyman’s excellent thesis, “An Algorithmic Investigation of Conviction Narrative Theory”). In some cases, insights derived from textual data are converted into standardized metrics, like the Economic Policy Uncertainty Index we use in our analysis of market stress levels.
However, these techniques are still limited by a number of important shortcomings. For example, text mining usually depends on the number of times certain words or phrases appear in the data set being analyzed, and/or the frequency of their use by agents in a network (e.g., what CEOs of public companies said in this quarter’s earnings conference calls with investment analysts). Simple frequency based approaches require that word or phrase use reach a certain level before being deemed significant. This creates the classic tradeoff between Type 1 and Type 2 errors, or false alarms and missed alarms. If the threshold word or phrase frequency trigger is set low, there will be a lot of false alarms; if it is set high, there will be more missed alarms.
Tracking word or phrase usage by important individuals (or high value nodes in network science terms) is one approach that has been used to improve the Type 1 vs. Type 2 tradeoff. However, placing more weight on fewer sources runs its own set of risks, from deliberate deception to lack of independence (e.g., as when many high value nodes are basing their opinions on the same set of flawed information inputs).
A far more fundamental limitation of machine learning techniques based on natural language processing is the subject of “The Book of Why”, by Dr. Judea Pearl, one of the preeminent scientists in the field of artificial intelligence. He posits a hierarchy of reasoning skills. At the lowest level is association or correlation. Today’s machine learning methods can recognize complex patterns in large data sets better than ever before. Yet they fundamentally operate in a statistical rather than model-driven mode.
The next highest level is causal reasoning that clearly connects causes and effects. This is something that today’s artificial intelligence techniques are far from mastering, particularly in the case of complex adaptive systems where the rules governing allowable actions are constantly evolving.
As we noted in last month’s feature article on the critical difference between threats and threat signatures, making AI more “context aware” (i.e., able to combine data with existing knowledge), and capable of creating abstractions and using them to reason across different situations (i.e., “transfer learning”) is the subject of multiple initiatives in both the private (e.g., computational narrative intelligence and story generation to explain data) and public sectors (e.g., DARPA and IARPA projects like AIDA, KAIROS, CREATE, and ICARUS).
At the top of Pearl’s hierarchy sits counterfactual reasoning, which builds on associational and causal methods and enables both retrospection and imagination. For example, the goal of IARPA’s FOCUS project is to substantially improve counterfactual reasoning methods.
Given the limitations of current artificial intelligence and other machine learning technologies, predicting uncertainty surprises, particularly in complex adaptive systems over longer time horizons, remains an activity where human cognition still reigns supreme.
Another important issue when predicting uncertainty shocks is the focus on your analytical efforts. More specifically, how do you divide your time between forecasting discrete variables (i.e., events) and continuous variables (i.e., trends)? For example, consider a company with a substantially overvalued stock price. In this case, a specific event – an earnings miss, a failed transaction, or publication of a critical research report – will likely trigger an uncertainty shock and a sharp fall in the company’s valuation. The key forecasting question is when one of those events is most likely occur.
Forecasting macro uncertainty shocks is different. To be sure, when they occur the media will always identify proximate events that they deem to be causal. They may well be, but only in the very narrow sense of the last grain of sand that causes a sandpile in which stress has been building to give way in a large slide.
The forecasting problem is that, in an integrated multilevel complex adaptive system characterized by constant changes in technological, economic, national security, social, and political conditions, there are an unknowable number of specific events that could trigger an uncertainty shock that produces large changes in financial asset prices. Trying to forecast them all is impossible.
Instead, our methodology focuses on forecasting the evolution of continuous variables, and how close we are to critical thresholds that will trigger uncertainty shocks and regime changes in the global macro system.
For a specific example of a forecast that was based on this approach, see our May 2007 article, “Why We Don’t Sleep Well These Days, and Moving Into Cash Looks Like a Good Idea.”
Can We Hedge Exposure to Uncertainty Shocks?
In broad terms, there are three strategies for hedging exposure to uncertainty shocks.
The first is to formulate “robust” plans that maximize the probability of achieving your goals across a wide range of possible future scenarios. In an investment context, the application of this principle leads to the recommendation to structure portfolios that are broadly diversified across a wide range of asset classes.
The second strategy is to ensure that a system or organization or portfolio has an adequate level “resilience” in case robustness fails. In investment terms, this takes the form of liquid assets; at a company this is more broadly interpreted as redundancy and hardening of critical systems, organizational techniques like critical incident teams and crisis training, and foregoing maximum efficiency in favor of maintaining a certain degree of “slack” resources that can be quickly deployed following a shock.
The final strategy is maximizing the adaptive capacity of an organization or portfolio. If robustness fails, and resiliency absorbs the initial negative impact, adaptation drives a quick return to previous levels of performance. Indeed, along with effectiveness and efficiency, adaptability is one of evolutions three core performance metrics, that apply to every organism, from the smallest bacteria to the largest organizations and nations.
There are three key elements to adaptability. Skill in anticipatory thinking continuously identifies potential threats, and enables the preparation and prioritization of options for responding to them. Tools like the “Met Office Model” we use at both the Index Investor and Britten Coyne Partners enable organizations to manage the complex dynamic of the speed at which threats are developing and the remaining time required to adequately respond to them. And developing organizational capacity for problem detection, solution design, and rapid implementation (often collectively termed “agility”) ensures that the adaptive process is continuous and effective.
So, to sum up:
(1) Macro uncertainty shocks are caused by individual and collective forces that are deeply rooted in our evolutionary past, and have been supercharged in our present age of high complexity and hyper-connectivity. As former Bank of England Governor Mervyn King has observed, we now live in “an age of radical uncertainty”.
(2) Macro uncertainty shocks have substantial and long-lasting effects, and their full impact usually occurs with a time lag.
(3) Macro uncertainty shocks can be anticipated, not by trying to forecast the exponentially large number of discrete events that can be their proximate cause, but rather by focusing on the trends that can push complex adaptive systems beyond critical thresholds (i.e., “tipping points”) and trigger sudden non-linear effects and regime change.
(4) By focusing on robustness, resiliency, and adaptability, we can hedge our exposure to uncertainty shocks.
If you have any questions about anything we have written in this issue, please don’t hesitate to get in touch, at contact@indexinvestor.com