The Index Investor
December 2018
Key Takeaways
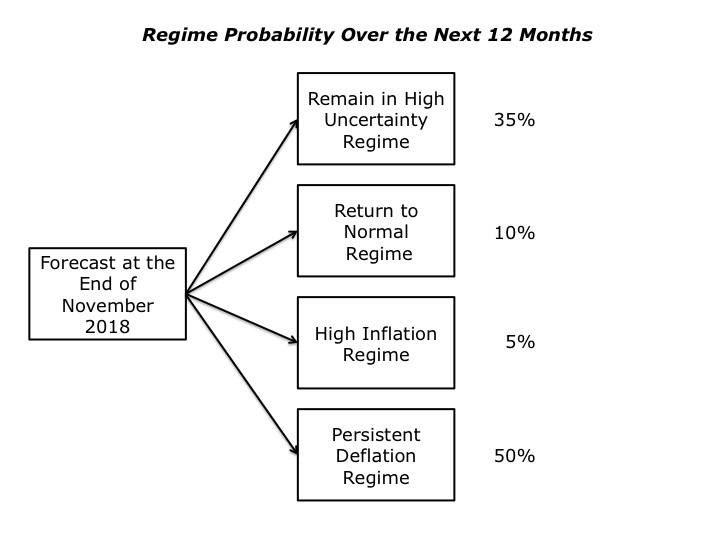
Based on high value information that we collected in November, we have increased our forecast probability of entering the Persistent Deflation Regime over the next 12 months to 50%. The probability of remaining in the current High Uncertainty Regime is 35%, while a transition to the High Inflation Regime is 5% and a return to the Normal Regime is 10%.
Compared to October, all five of our market stress indicators have risen, implying a continued increase in the level of underlying stress in financial markets during November 2018, and thus a further increase in the risk of substantial changes in asset class valuations, many of which we judge to be overvalued today.
In light of rising levels of uncertainty and conflict in the macro system, we have also reduced our estimate of the time remaining before several critical thresholds are reached.
Asset Class Valuation and Momentum Indicators (@30Nov18)
| Asset Class (ETF) | Valuation | 1 Month Return | Conclusion |
| US 10Yr Real Return Govt Bond (TIP) | Likely Overvalued* | 0.43% | Increasing Overvaluation |
| US 10Yr Nom Return Govt Bond (GOVT) | Likely Overvalued* | 0.88% | Increasing Overvaluation |
| US Investment Grade Credit (LQD) | Likely Overvalued* | (0.36%) | Decreasing Overvaluation |
| US High Yield Credit (HYG) | Likely Overvalued* | 3.16% | Increasing Overvaluation |
| US Commercial Property (VNQ) | Likely Undervalued* | 4.62% | Decreasing Undervaluation |
| US Equity (VTI) | Very Likely Overvalued* | 2.01% | Increasing Overvaluation |
| Foreign Developed Mkt Equity (VEA) | Likely Undervalued* | 0.51% | Decreasing Undervaluation |
| Emerging Markets Equity (VWO) | Almost Certainly Overvalued* | 4.83% | Increasing Overvaluation |
| Timber (WY) | Very Likely Undervalued* | 0.45% | Decreasing Undervaluation |
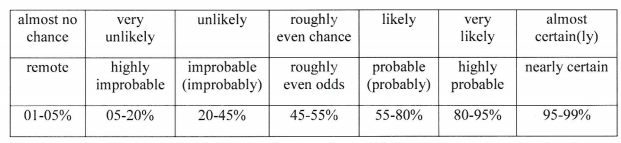
Note: The language we use to describe our estimated likelihood of asset class over or undervaluation is based on US Intelligence Community Directive 203 on Analytic Standards, which includes the following table:
Market Stress Indicators (@30Nov18)
Compared to October, all five of our market stress indicators have risen, implying a continued increase in the level of underlying stress in financial markets during November 2018, and thus a further increase in the risk of substantial changes in asset class valuations. BB rated bonds’ spread over the 10 Year US Treasury is still just 2.80%, which put it in just the 37th percentile since the series started in 1996. Such low credit spreads on speculative grade bonds are usually a sign of excessive credit growth, which underlies many other sources of market stress.
| Market Stress Indicator | This Month vs Last Month |
| Correlation of returns across asset classes | .86 vs (.62) |
| Economic Policy Uncertainty Index (monthly average) | 136 (17% of months since 1985 were higher) vs 112 |
| AAA Rated Bonds Spread over 10 Year Treasury Yield (month end) | 1.21% (53% of cases since 1983 were higher) vs 1.12% |
| BB Rated Bonds Spread over 10 Year Treasury Yield (month end) | 2.80% (63% of cases since 1996 were higher) vs 2.53% |
| Gold Price per Ounce in US Dollars (month end) | $1,220 vs $1,218 (up 0.2%) |
Market Stress Indicators: Forecast Discussion
We view financial markets as a complex adaptive system. The distribution of the changes generated by such a system follows a power law rather than the normal (Gaussian or "bell curve") distribution. The critical point is that large changes are much more common in complex adaptive systems than most people’s intuition leads them to believe.
While predicting the behavior of complex adaptive systems remains far more art than a science, various researchers have found that large changes in such systems are often preceded by subtle warning signs, as stress accumulates within them. While this research is not definitive, we believe that five warning signs are worth monitoring as potential indicators of growing stress within financial markets that could suddenly give rise to large changes in asset class valuations.
Our first indicator is the month-to-month autocorrelation of broad asset class returns (i.e., the relationship of this month’s returns to last month’s). A system under increasing stress loses resiliency, causing it to take longer to recover from perturbations; hence, autocorrelation increases as it approaches a critical transition (see, “Early Warning Signals for Critical Transitions” by Scheffer, et al).
The one-month autocorrelation of returns for the broad asset classes we monitor increased to .86 in October from (.62) in September. This indicates that financial markets are becoming more ordered and are potentially closer to a critical transition point (which would most likely be accompanied by sudden and substantial changes in asset class values) than they were last month.
The second market stress indicator we monitor is the Equity Market Related Economic Policy Uncertainty Index published by the Federal Reserve Bank of St. Louis (via its FRED economic database), which is based on research by Baker, Bloom, and Davis (see their paper, “Measuring Economic Policy Uncertainty”). The index is based on automated text analysis of leading newspapers and magazine publications, to identify the frequency with which words and phrases are used that indicate uncertainty.
In our evolutionary past, when uncertainty increased our probability of survival was enhanced by staying close to our group. We still have that instinct. Research has found that as uncertainty increases, we have an unconscious bias towards higher conformity of our own views with those of a larger group (i.e., reduction in cognitive diversity). Behaviorally, heightened uncertainty induces more “social copying” of others, likely due to both conformity bias and the rational belief that others may be acting on the basis of superior information. This increase in conformity and copying makes a social system more ordered as uncertainty increases, and also reduces its responsiveness to perturbations (i.e., increases autocorrelation) because of delays in the social copying process.
The key point is that increasing uncertainty induces more, not less order in social systems, and in so doing primes them for sudden non-linear change.
For the month of November, the average Economic Policy Uncertainty Index stood at the 83rd percentile of its values since the data series began in 1985 – to be clear, just 17% of values were higher over that period. This was a significant increase in average uncertainty since last month.
Our more fine-grained intra-month measure of uncertainty is the number of daily changes that are in the top and bottom 20% of the historical distribution. In November, it was in the 68th percentile -- 32% of rolling 30-day periods since 1985, has it been higher. Last month it was in the 82nd percentile.
To reiterate the point made above, high levels of uncertainty tend to cause people’s opinions to become more ordered, due to a higher tendency toward conformity and social copying. This primes a system for sudden, non-linear change.
Our third market stress indicator is the spread between the yield on AAA rated bonds and the 10-year US Treasury. We interpret this as a proxy for the level of investor concern about financial system liquidity. At the end of November 2018, this spread stood at 1.21%, (47th percentile), up slightly from last month’s 1.12% spread.
Our fourth market stress indicator is the yield spread between speculative BB rated bonds and the ten-year US Treasury. Throughout history, excessive credit growth has been a root cause of many financial crises. An indicator of such growth is falling credit spreads, particularly in the case of riskier borrowers. At the end of November, this spread increased from 2.53% to 2.80%, which still put it in only the 37thth percentile of spreads recorded since this data series began in 1996 – 63% the previous observations were higher. This is a dangerously low level this late in what is already an exceptionally long period without a serious economic downturn.
Our fifth market stress indicator is what we term the implicit “political risk premium” that is implicit in the price of gold. Our starting point for estimating this premium is the three different roles that gold plays. First, gold is a store of value in a world of fiat currencies. When the rate of money supply growth exceeds the growth of nominal GDP, gold’s price should increase to maintain its purchasing power. Between 2007 and 2017, the US money supply (M2) grew by about 86%, while nominal US GDP grew by 35%. The stock of gold grew by 18%, based on mine production over this period. We therefore infer that 33% of the increase in the price of gold represented the maximum potential gold price change that could be attributed to a desire to hedge inflation risk (86% less 35% less 18%).
Second, gold is a unit of account. We take this to mean that the annual change in GDP expressed in terms of physical gold (i.e., nominal GDP divided by the price of gold) should equal the change in real GDP calculated using the GDP price deflator to account for actual inflation over the period. A key challenge is the point at which to start this calculation.
We chose the price of gold in 1995/1996. In that period, the change in real global GDP measured using the IMF’s price deflator just about equaled the change in GDP measured in terms of physical gold. We interpret that coincidence as indicating that at that point in time, concerns about future inflation and political risk were minimal, and the change in the price of gold was mostly driven by its role as a unit of account. We calculated a subsequent series of gold prices that would produce the same change in “gold GDP” as the actual real GDP as calculated by the IMF. Between 2007 and 2017, “gold as a unit of account” warranted a 21% increase in its price.
Gold’s third role is as a hedge against inflation and what we term “political disaster” risk. We subtract the 21% estimated compensation for actual inflation from the 33% “gross” inflation risk hedge to derive an apparent 12% increase in the gold price that reflected the true risk premium to hedge against possible future inflation.
However, between 2007 and 2017 the price of gold actually increased by 81%. This implies that 48% of this (81% less 21% less 12%) represented a premium for some other type of uncertainty at the end of 2017. The interesting question is the nature of the uncertainty for which gold is believed by some investors to be a superior hedge than traditional ports in a storm like short-term US government securities, or similar securities issued by other developed countries.
The logical inference is that the uncertainty in question must reflect a situation in which short term US Treasuries would be a less effective hedge than gold. This could be a world of widespread hyperinflation, capital controls, and/or radical changes in nations’ governments (of course, this would also imply a preference for investing in gold coins rather than bullion, as while the latter may be a store of value, it is far less convenient as a means of paying for transactions).
To put this in further perspective, this gold price “disaster risk” premium sharply increased from 2008 to 2012, then declined before sharply increasing again after 2016. Arguably, a significant part of the former increase reflects concerns about the potential inflationary consequences of dramatic quantitative easing by central banks. But this is not likely to be the case after 2016.
Over the last month, the price of gold rose by 0.2%. Through November 2018, the price of gold has fallen by about 6% since the end of 2017, so, on a rough approximation, the political uncertainty premium now stands at about 42%, compared to 39% at the end of August 2018.
Macro Regime Forecast and Implications for Asset Class Values
Summary: Why Did We Change Our Regime Probabilities?
These were the key pieces of new information we observed this month that caused us to increase the probability that over the next 12 months we will transition into the Persistent Deflation Regime, and decrease the probability of remaining in the High Uncertainty Regime. All of these pieces of new information are discussed in more detail in this month’s Evidence File (see below).
(1) A new IMF report that concludes there is more slack in the world economy than was previously realized.
(2) A worsening of the US-China conflict that has the potential to severely disrupt world trade and supply chains, putting downward pressure on growth.
(3) A report by Bloomberg that 20% of China’s apartments are empty. Given the importance of real estate to China’s highly leveraged economy, this is a very negative indicator.
(4) Worsening disorder in Europe (continued confusion over Brexit and significant street demonstrations and rioting in France against president Macron’s proposed economic reforms), which along with the worsening of the US-China conflict has contributed to a rise in growth-depressing global uncertainty.
(5) Three major new reports and articles in the US, from highly respected sources (e.g., the American Enterprise Institute and the Brookings Institution) focused on how to respond to worsening inequality. Unfortunately, they did not leave us confident about either the completeness of their policy solutions, or, more importantly, that even if they were correct they could be effectively implemented in today’s political environment.
Forecast Methodology
The focus of our monthly macro forecast is twofold. First, the probability of a change in financial market regime that causes changes of 20% or more in asset class valuations over the next year. Second, contingent on such a change taking place, the probability of a subsequent transition to other regimes.
Our analysis focuses on four possible macro regimes: (1) Normal Times, where equity asset classes perform well; (2) a High Uncertainty regime that is usually short and transitory, where asset classes like short-term government bonds perform best; (3) High Inflation, where commercial property, real return bonds and other traditional hedges are favored; and (4) Persistent Deflation, which up to now has only been seen in Japan, and in which the relative performance of different asset classes remains most uncertain.
Our forecasting methodology is derived from our experience on the Good Judgment Project, as described in the book, “Superforecasting” by Gardner and Tetlock, as well as a range of other sources, from the intelligence community to systems dynamics and complex adaptive systems to statistics and political economy.
We start with base rate/reference case data about the historical probability of large changes in equity and bond valuations. We then analyze the current situation from both a quantitative and qualitative perspective. In the latter, we focus on the key endogenous drivers of macro regime change, including technological, economic, national security, social, and political trends and uncertainties. We also focus on three potential sources of exogenous shocks that could also produce a macro regime change, caused by environmental, disease, and cyber related events.
While most of our attention typically focuses on various flows (e.g., economic growth, change in the price level, sales, earnings, job creation, etc.), endogenously caused regime changes result when those flows push key stocks beyond a critical threshold or tipping point, often setting off non-linear reactions across multiple areas. As noted by Hyman Minsky and others, a classic example is the steady accumulation of outstanding debt until it reaches the point where it can no longer be serviced and triggers a crisis.
Base Rate Data
Since the end of World War Two, there have been fifteen months where a downturn in the US equity market began that eventually reduced asset class value by 20% of more. That is a hazard rate of about 1.75% per month. Put differently, in any given month there is a 98.25% probability that a 20%+ downturn won’t occur, or, in a given year, an 81% probability.
However, as the time without a 20%+ downturn extends, the compound probability that one will not occur shrinks. At the end of August 2018, it is more than nine years since the last equity market decline of 20% or more. The probability of that happening is only 15%.
To estimate the base rate for a 20% fall in bond prices (which historically has been caused by a sharp increase in inflation, as we saw in the late 1970s and early 1980s), we analyzed monthly historical AAA bond yields since 1919. For consistency, we used them to calculate the price of a ten-year zero coupon bond. We then calculated the probability of a price decline of 20% or more over three different holding periods: 12, 18, and 24 months. In any month, the annualized probability of a decline of 20% or more over the subsequent 12 months is 12%; over 18 months, 20%, and over 24 months, 25%.
The Current State of Quantitative Regime Predictors
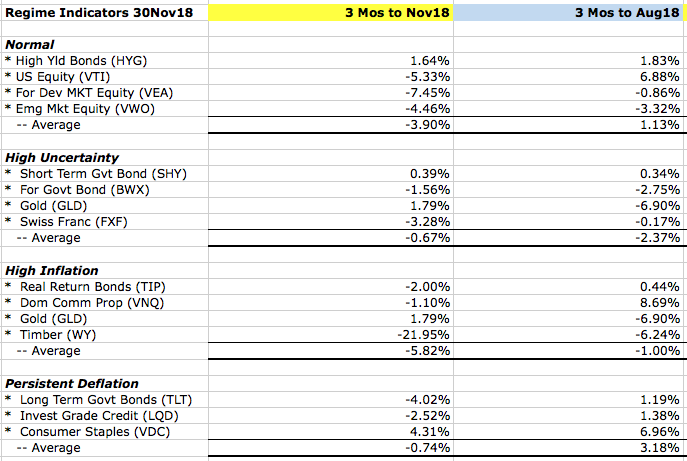
Our quantitative methodology focuses on the level and change in three-month returns, over the most recent and previous three-month periods, for those asset classes which should perform best under different regimes.
As you can see in the following table, at the end of November 2018, this analysis indicates that, over the next 12 months, the balance of expectations was split between continuation of the High Uncertainty Regime and a transition to the Persistent Deflation Regime.
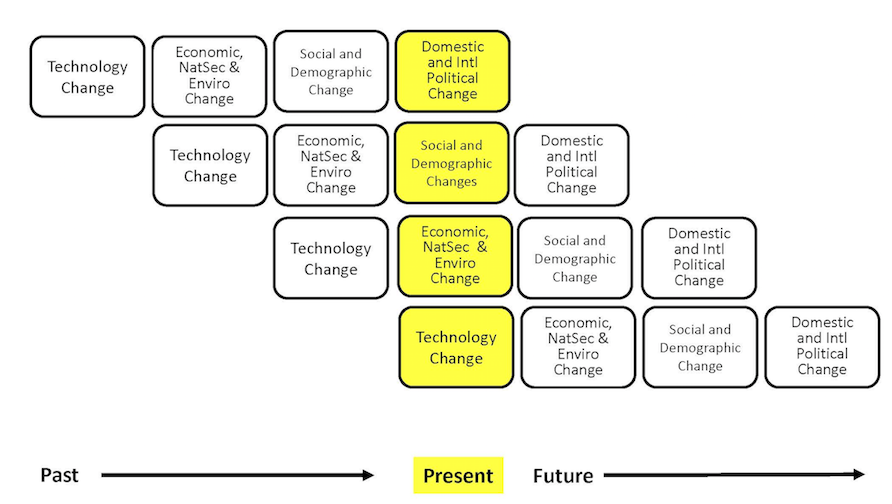
Like Professors Andrew Lo, Doyne Farmer and others, we regard financial markets as a complex adaptive system (CAS), that exist as part of a larger macro system comprised of other CAS between which there are multiple feedback loops. These other systems include those that produce technology innovations, and economic, environmental, national security (including cyber), social, demographic, and political outcomes.
We also find that these systems tend to operate and generate effects in a rough chronological sequence, albeit with many feedback loops between them. The following chart highlights that the changes we observe in different areas at any point in time are actually part of a much more complex evolutionary process.
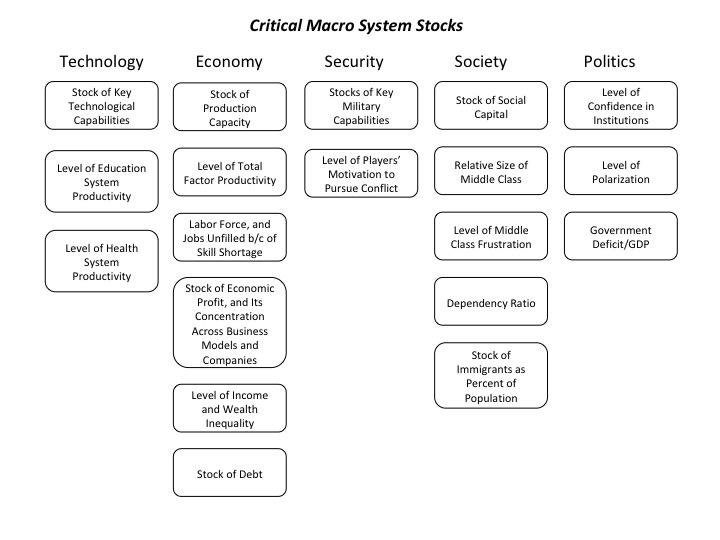
While most media coverage of these systems focused on flows (e.g., the size of the government deficit), rapid non-linear change in complex adaptive systems is often caused by a key stock (e.g., the amount of outstanding government debt) exceeding a critical threshold.
The next table highlights the key macro system stocks that we monitor.
In the next section, we will discuss information received over the past month that is related to these stocks, and which we believe is significant to our assessment of the probabilities that a critical threshold will be reached and a regime change will occur. We will conclude with our estimate, at the end of this month, of how close the macro system is to these critical thresholds, and the implications for financial market regime change probabilities.
In our methodology, new information is valuable insofar as it provides an updated indicator of how close we are to a critical threshold, or it is surprising and causes us to question the structure of our overall system model (e.g., the existence of another critical threshold we should monitor, or the range of possible outcomes for a key uncertainty).
| New Technology Information: Indicators and Surprises | Why Is This Information Valuable? |
| “Deep Learning can Replicate Adaptive Traders in a Limit-Order Book Financial Market”, by Calvez and Cliff | “Successful human traders, and advanced automated algorithmic trading systems, learn from experience and adapt over time as market conditions change…We report successful results from using deep learning neural networks (DLNNs) to learn, purely by observation, the behavior of profitable traders in an electronic market… We also demonstrate that DLNNs can learn to perform better (i.e., more profitably) than the trader that provided the training data. We believe that this is the first ever demonstration that DLNNs can successfully replicate a human-like, or super-human, adaptive trader.” This is a significant development. Along with similar advances in reinforcement learning (e.g., by Deep Mind with AlphaZero), one can easily envision a situation where – at least over short time frames – most humans completely lose their edge over algorithms. The good news (form humans at least) is that over longer time frames, the structure of the system evolves (and becomes less discrete), and performance becomes more dependent on higher forms of reasoning – causal and counterfactual – where humans are still far ahead of algorithms (and whose sensemaking, situation awareness, and decision making The Index Investor is intended to support ). |
| “Social media cluster dynamics create resilient global hate highways”, by Johnson et al | “Online social media allows individuals to cluster around common interests -- including hate. We show that tight-knit social clusters interlink to form resilient ‘global hate highways’ that bridge independent social network platforms, countries, languages and ideologies, and can quickly self-repair and rewire. We provide a mathematical theory that reveals a hidden resilience in the global axis of hate; explains a likely ineffectiveness of current control methods; and offers improvements…” |
| “The Semiconductor Industry and the Power of Globalization” The Economist 1Dec18 | “If data are the new oil...chips are what turn them into something useful.” This special report provides a good overview of how the critical and highly globalized semiconductor supply chain is coming under increased pressure as competition between China and the United States intensifies. |
| “There’s a Reason Why Teachers Don’t Use the Software Provided by Their Districts”, by Thomas Arnett | SURPRISE We have noted in the past that education (like healthcare) is a critical social technology where substantial performance improvement is critical to increasing future rates of national productivity growth and reducing inequality. This study is not encouraging with respect to the impact technology has been having on the education sector. The authors find that, “a median of 70% of districts’ software licenses never get used, and a median of 97.6% of licenses are never used intensively. |
| Reports emerged from China that gene editing CRISPR technology to modify a human embryo’s DNA before implanting it in a woman’s womb via IVF. The initial focus was reportedly on producing children who are resistant to HIV, smallpox, and cholera. | SURPRISE While this has been recognized as a possibility, there was also a belief that it would not happen so quickly, or with so little control. It was also significant that the target of the DNA modification was resistance to smallpox, a disease which is believed to have been eradicated and whose causal agents are now only retained by governments (which makes them potentially very powerful biowar weapons). |
| “Virtual Social Science” by Sefan Thurner. | SURPRISE Thurner is one of the world’s leading complex adaptive systems researchers, and anything he writes is usually rich with unique insights. His latest paper is no exception. He reviews findings from the analysis of 14 years of extremely rich data from Pardus, a massive multiplayer online game (MMOG) involving about 430,000 players in which economic, social, and other decisions are made by humans, not algorithms. This data can be used to develop and test a wide range of social science theories about the behavior of complex adaptive systems at various levels of aggregation, from the individual to the group to the system. It can also be used to evaluate agent-based, and AI driven approaches to predicting the future behavior of complex systems The author shows how many of the findings from analyzing game data line up with experimental findings based on the behavior of far fewer subjects. This points the way towards a new and potentially much more powerful approach to social science. However, Thurner also notes the current limits on the extent to which human societies can be understood, and their behavior predicted using this methodology: the inherent “co-evolutionary complexity” of complex adaptive social system, whose interactions cause structures to change over time, often in a non-linear manner. |
| New Economic Information: Indicators and Surprises | Why Is This Information Valuable? |
| “The Changing Nature of Work” World Bank World Development Report, 2019 | “Machines are coming to take our jobs” has been a concern for hundreds of years — at least since the industrialization of weaving in the early 18th century, which raised productivity and also fears that thousands of workers would be thrown out on the streets. Innovation and technological progress have caused disruption, but they have created more prosperity than they have destroyed.” “Yet today, we are riding a new wave of uncertainty as the pace of innovation continues to accelerate and technology affects every part of our lives…The days of staying in one job, or with one company, for decades are waning. In the gig economy, workers will likely have many gigs over the course of their careers, which means they will have to be lifelong learners…That is why this Report emphasizes the primacy of human capital in meeting a challenge that, by its very definition, resists simple and prescriptive solutions…” “This study unveils our new Human Capital Index, which measures the consequences of neglecting investments in human capital in terms of the lost productivity of the next generation of workers…” “Three types of skills are increasingly important in labor markets: advanced cognitive skills such as complex problem-solving, socio-behavioral skills such as teamwork, and skill combinations that are predictive of adaptability such as reasoning and self-efficacy. Building these skills requires strong human capital foundations and lifelong learning.” |
| “An Assessment of McKinsey’s Forecast for Artificial Intelligence” by Jeffrey Funk | SURPRISE Many analyses have recently been published on the potential impact of advancing artificial intelligence technologies on productivity and economic growth. Virtually all of them have forecast that the impact is likely to be large, and generate significant disruption, including job losses and rapid changes in corporate and potentially even national economic competitiveness. Funk’s analysis is a necessary and timely counterpoint to these reports. He looks behind the conclusions of a recent McKinsey report, seeking to understand how much of an impact AI will have, in specific industries, by when, and, critically, why. Funk takes a micro/activity-based approach, asking of those where AI seems likely to have the largest impact, how important they are to total costs and the value created for customers in different sectors. He also examines how much more room there is for substantial improvements in these areas, given past improvements and current improvement trajectories. His conclusion is that because these micro questions are often not addressed, either at all or in sufficient detail in recent reports on AI’s potential economic impact, considerable uncertainty surrounds their optimistic conclusions. |
| “Start-Ups Aren't Cool Anymore”, by Stephen Harrison in The Atlantic | “Research suggests entrepreneurial activity has declined among millennials. The share of people under 30 who own a business has fallen to almost a quarter-century low.” |
| “The Global Effects of Global Risk and Uncertainty” by Bonciani and Ricci from the European Central Bank | The authors identify a factor that explains about 40% of the variation in the price of about 1,000 risky assets in 36 countries. They argue that it represents changes in global uncertainty and risk aversion, and find (as did previous papers that primarily focused on the US) that uncertainty shocks have severe and long-lasting consequences for economic growth and asset returns. |
| “Global Uncertainty is Rising, and That is a Bad Omen for Growth” by Ahir, Bloom, and Furceri. | The authors present a new text-based quarterly “World Uncertainty Index” (WUI) and report five key findings: (1) Global uncertainty has increases significantly since 2012. (2) Uncertainty spikes are more synchronised in advanced economies than in emerging and low income countries. (3) Uncertainty is higher in emerging and low income economies than in advanced economies. (4) There is an inverted U-shaped relationship between uncertainty and democracy (uncertainty peaks at the midpoint between the evolution from autocracy to democracy). (5) Increases in the WUI foreshadow significant declines in output. |
| “The Monopolization of America” by David Leonhardt in The New York Times, 25Nov18 | Leonhardt makes a point in the NYT that Rana Foroohar has frequently made in the FT, about the negative economic consequences of the growing power of a limited number of companies that increasingly dominate their respective industries. For an excellent recent example of this, see the new report, “Provider Consolidation Drives up US Healthcare Costs”, by the Center for American Progress. We should never forget that in the first decade of the 20th century, president Theodore Roosevelt made trustbusting a populist crusade. Leonhardt notes that, a century ago, Louis Brandeis, the Supreme Court justice and anti‑monopoly crusader said, “’We may have democracy, or we may have wealth concentrated in the hands of a few, but we can’t have both’…In one industry after another, big companies have become more dominant over the past 15 years, new data show... “The new corporate behemoths have been very good for their executives and largest shareholders — and bad for almost everyone else. Sooner or later, the companies tend to raise prices. They hold down wages, because where else are workers going to go? They use their resources to sway government policy…” “Many of our economic ills — like income stagnation and a decline in entrepreneurship — stem partly from corporate gigantism. So what are we going to do about it? It’s time for another political movement…The beginnings of this movement are now visible” Similar points were also raised in a recent article in The Economist, “Western Governments Need a Plan for Reinstating Effective Competition.” |
| “The Rise of Zombie Firms: Causes and Consequences” by Banerjee and Hoffman from the Bank for International Settlements | “The rising number of so-called zombie firms, defined as firms that are unable to cover debt servicing costs from current profits over an extended period, has attracted increasing attention in both academic and policy circles. Using firm-level data on listed firms in 14 advanced economies, we document a ratcheting-up in the prevalence of zombies since the late 1980s.” “Our analysis suggests that this increase is linked to reduced financial pressure, which in turn seems to reflect in part the effects of lower interest rates. We further find that zombies weigh on economic performance because they are less productive and because their presence lowers investment in and employment at more productive firms.” On the latter point, see also, “The Walking Dead? Zombie Firms and Productivity Performance in OECD Countries” by McGowan et al. We expect that a key contributor to the persistence of the Deflation Regime will be extensive corporate debt defaults (which will involve either write-downs or debt/equity conversions). Elimination of zombie firms and redeployment of the resources that have been tied up in them could contribute to a beneficial increase in productivity growth, particularly if it is accompanied by reforms (e.g., in education and lifetime learning) that lead to substantial improvements in the quality of human capital. |
| “More Slack than Meets the Eye? Recent Wage Dynamics in Advanced Economies” by Hong et al from the IMF | SURPRISE This recent paper from the IMF Research Department finds that deflationary forces at work in the world economy may have been significantly underestimated. “Nominal wage growth in most advanced economies remains markedly lower than it was before the Great Recession of 2008–09. This paper finds that the bulk of the wage slowdown is accounted for by labor market slack, inflation expectations, and trend productivity growth. In particular, there appears to be greater slack than meets the eye.” |
| “The Deficit Reductions Necessary to Meet Various Targets for Federal Debt”, by the US Congressional Budget Office | This is a very sobering report that highlights the great challenge the US faces with respect to controlling the growth of federal government debt. “CBO analyzed the primary deficit reductions necessary to meet three different debt targets over four different time frames. The three targets are federal debt equaling 41 percent of GDP (the average over the past 50 years), 78 percent of GDP (the current amount), and 100 percent of GDP. The four time frames begin in 2019 and extend to 2033, 2038, 2044, and 2048. (In CBO’s extended baseline, debt held by the public grows to 152 percent of GDP in 2048.) |
| “What Economists Don’t Know About Manufacturing”, by Bonvillian and Singer in The American Interest | SURPRISE This analysis highlights the overlooked and critical connection between manufacturing expertise and productivity growth. “The decline of manufacturing really is as disastrous as common sense suggests…the delinking of innovation from production has put the United States increasingly at a competitive disadvantage…” “U.S. industry has allowed its historic production leadership to slip, endangering its innovative capacity—again, because production cannot really be delinked from innovation—in important areas of technology…” “The argument that manufacturing jobs are economically equivalent to services jobs was and remains simply wrong. Manufacturing jobs have the highest job multiplier effect; that is, they lead to more jobs throughout the economy than do jobs in other sectors. Manufacturing is also an innovation driver, so it is critical to U.S. research and development and follow-on technological innovation—and therefore to growth…” “The beginning of wisdom when it comes to understanding advanced manufacturing is the simple but somehow elusive point that not all industries are created equal in generating growth. Regrettably, mainstream economists have typically been unable to differentiate between the potential of different sectors.” |
| “The Dollar Can Defend Its Global Reserve Role Against the EU and China”, by Megan Greene in the Financial Times, 7Nov18 | “While the euro accounted for the second largest share of global central bank reserves by mid-2018, its share was only around one-third that of the dollar. It will be difficult for investors to put their trust in the euro as long as there are doubts about the Eurozone’s survival, most recently prompted by the Italian government flouting fiscal rules…” “For all the talk of an insurgent China, its currency is hardly poised to take over. The Renminbi accounted for a paltry 1.84 per cent of global central bank reserves in mid-2018. This could change as the Belt and Road Initiative expands — it would be easier for all countries in the project to use the same currency. But the Renminbi has a long way to go. It is not freely floating, monetary policy is unpredictable and China’s economy and financial system are not open.” |
| New National Security Information: Indicators and Surprises | Why Is This Information Valuable? |
| “The Role of AI in Future Warfare”, by Michael O’Hanlon, published by Brookings | SURPRISE Good, concise overview. The author concludes that, “Robotics and AI could take on a central, and very important, role in warfare by 2040—even without anything resembling a terminator or a large killer robot.” Critically, this increases the risk of faster escalation of future conflicts. |
| U.S.-China Economic And Security Review Commission, 2018 Report To Congress | The U.S.-China Economic and Security Review Commission is mandated by Congress to investigate, assess, and report to Congress annually on “the national security implications of the economic relationship between the United States and the People’s Republic of China.” This very thorough, 539 page report provides extensive evidence to support key findings that have become familiar but are still critical and in many cases unmet. Economic Challenges “China’s state-led, market-distorting economic model presents a challenge to U.S. economic and national security interests. The Chinese government, directed by the Chinese Communist Party (CCP) leadership, continues to exercise direct and indirect control over key sectors of the economy and allocate resources based on the perceived strategic value of a given firm or industry. This puts U.S. and other foreign firms at a disadvantage— both in China and globally—when competing against Chinese companies with the financial and political backing of the state.” “The Chinese government continues to resist—and in some cases reverse progress on—many promised reforms of China’s state led economic model.” “Chinese President and General Secretary of the CCP Xi Jinping has prioritized efforts to consolidate control over economic policymaking. However, this strategy may have unintended consequences for China’s economic growth. Increased state control over both public and private Chinese companies may ultimately reduce productivity and profits across a range of industries, with firms pursuing CCP—rather than commercial—objectives.” “China’s debt burden poses a growing threat to the country’s long-term economic stability. Even as Chinese banks’ nonperforming loans rise and unofficial borrowing by local governments comes due, Chinese policymakers continue to spur new credit growth to combat fears of an economic slowdown.” “The Chinese government structures industrial policies to put foreign firms at a disadvantage and to help Chinese firms. Among the policies the Chinese government uses to achieve its goals are subsidies, tariffs and local content requirements, restrictions on foreign ownership, intellectual property (IP) theft and forced technology transfers, technical standards that promote Chinese technology usage and licensing, and data transfer restrictions.” “China has reaped tremendous economic benefits from its accession to the World Trade Organization (WTO), and participation in the rules-based, market-oriented international order.” “However, more than 15 years after China’s accession, the Chinese government’s state-driven industrial policies repeatedly violate its WTO commitments and undermine the multilateral trading system, and China is reversing on numerous commitments.” Security Challenges “China signaled a decisive end to its more than quarter century- old guidance to ‘hide your capabilities and bide your time, absolutely not taking the lead’ as President Xi issued a series of new foreign affairs and military policy directives calling on China to uncompromisingly defend its interests and actively promote changes to the international order.” “The United States faces a rising power in China that sees the security structures and political order of the Indo-Pacific as designed to limit its power. The widening gap in military capability between China and the rest of region also enables Beijing to coerce its neighbors with the increasingly credible implied threat of force.” “Beijing is currently capable of contesting U.S. operations in the ground, air, maritime, and information domains within the second island chain, presenting challenges to the U.S. military’s longstanding assumption of supremacy in these domains in the post-Cold War era.” “By 2035, if not before, China will likely be able to contest U.S. operations throughout the entire Indo-Pacific region…China’s large-scale investment in next-generation defense technologies presents risks to the U.S. military’s technological superiority. China’s rapid development and fielding of advanced weapons systems would seriously erode historical U.S. advantages in networked, precision strike warfare during a potential Indo-Pacific conflict.” “China continues to develop and field medium- and long-range air, sea, and ground-launched missile systems that substantially improve China’s capability to strike both fixed and moving targets out to the second island chain. China’s ability to threaten U.S. air bases, aircraft carriers, and other surface ships presents serious strategic and operational challenges for the United States and its allies and partners throughout the Indo-Pacific.” “Prior to the PLA [Chinese military] achieving its objectives of becoming a “modern” and “world-class” military, Beijing may use coercive tactics below the threshold of military conflict rather than resorting to a highly risky use of military force to achieve its goals in the region. However, as military modernization progresses and Beijing’s confidence in the PLA increases, the danger grows that deterrence will fail and China will use force in support of its claims to regional hegemony.” |
| “A Fifth of China’s Homes Are Empty: That’s 50 Million Apartments”, Bloomberg News, 8Nov18 | SURPRISE This article provides further evidence that improvements in China’s military capabilities are occurring at the same time as its financial system and economy’s situation is becoming more fragile and precarious. “The nightmare scenario for policy makers is that owners of unoccupied dwellings rush to sell if cracks start appearing in the property market, causing prices to spiral. The latest data, from a survey in 2017, also suggests Beijing’s efforts to curb property speculation -- considered by leaders a key threat to financial and social stability -- are coming up short.” In “China’s Real Estate Market”, Liu and Xiong provide more important background on this issue. As they note, “The real estate market is not only a key part of the Chinese economy but also an integral component of China’s financial system. In 2017, housing sales totaled 13.37 trillion RMB, equivalent to 16.4% of China’s GDP. The real estate market is also deeply connected to China’s financial system through several important channels.” “First, housing holdings are the biggest component of Chinese households’ asset portfolios, partly due to a lack of other investment vehicles for both households and firms in China’s still underdeveloped financial markets.” “Second, China’s local governments heavily rely on land sale revenues and use future land sale revenues as collateral to raise debt financing.” “Third, firms also rely on real estate assets as collateral to borrow, and since 2007, firms, especially well-capitalized firms, have engaged heavily in acquiring land for investment purposes.” “Finally, banks are heavily exposed to real estate risks through loans made to households, real estate developers, local governments, and firms that are either explicitly or implicitly backed by real estate assets…” Through the third quarter of 2016, property-related loans totaled 55 trillion RMB, accounting for about 25% of China’s banking assets. Among these loans, mortgage loans to households accounted for 17.9 trillion, loans to real estate developers accounted for 14.8 trillion (including 7 trillion in regular loans, 6.3 trillion in credit through shadow banking, and 1.5 trillion through domestic bond issuance), and loans collateralized by real estate assets to firms and local governments accounted for 22.2 trillion. This heavy real estate exposure of banks makes the real estate market systemically important in China’s financial system.” |
| “Risks in China’s Financial System”, by Song and Xiong“ | The authors argue that while “a financial crisis in China is unlikely to happen in the near future, the ultimate financial risk lies with declining Chinese economic growth.” They point to “a vicious circle of distortions in the financial system has lowered the efficiency of capital allocation and thus economic growth, which will eventually exacerbate financial risks.” |
| “Chinese Influence and American Interests”, published by the Hoover Institution | “For three and a half decades following the end of the Maoist era, China adhered to Deng Xiaoping’s policies of ‘reform and opening to the outside world” and “peaceful development.’ “After Deng retired as paramount leader, these principles continued to guide China’s international behavior in the leadership eras of Jiang Zemin and Hu Jintao. Admonishing Chinese to ‘keep your heads down and bide your time,’ these Party leaders sought to emphasize that China’s rapid economic development and its accession to “great power” status need not be threatening to either the existing global order or the interests of its Asian neighbors.” “However, since Party general secretary Xi Jinping came to power in 2012, the situation has changed. Under his leadership, China has significantly expanded the more assertive set of policies initiated by his predecessor Hu Jintao. These policies not only seek to redefine China’s place in the world as a global player, but they also have put forward the notion of a “China option” that is claimed to be a more efficient developmental model than liberal democracy.” “While Americans are well acquainted with China’s quest for influence through the projection of diplomatic, economic, and military power, we are less aware of the myriad ways Beijing has more recently been seeking cultural and informational influence, some of which could undermine our democratic processes. These include efforts to penetrate and sway—through various methods that former Australian prime minister Malcolm Turnbull summarized as ‘covert, coercive or corrupting’—a range of groups and institutions, including the Chinese American community, Chinese students in the United States, and American civil society organizations, academic institutions, think tanks, and media…” “China’s influence activities have moved beyond their traditional United Front focus on diaspora communities to target a far broader range of sectors in Western societies, ranging from think tanks, universities, and media to state, local, and national government institutions. China seeks to promote views sympathetic to the Chinese Government, policies, society, and culture; suppress alternative views; and co-opt key American players to support China’s foreign policy goals and economic interests.” |
| “China’s Xi Jinping revives Maoist call for ‘self-reliance’”, Financial Times 12Nov18 | SURPRISE Even as Xi has sought to position China as a champion of globalisation amid the US retreat into protectionism, the call for “self-reliance” highlights how he is also advocating mercantilist policies that could reshape global supply chains… |
| False hopes of trade truce between US and China after the G-20 meeting in Argentina were quickly dashed by the arrest in Vancouver of the CFO of Huawei (on a charge of conspiring to evade US sanctions on Iran), and China’s subsequent threat to impose grave consequences on Canada if she is not released. | Make no mistake. The Second Cold War has begun. As Ely Ratner notes in Foreign Affairs this month, “There is No Grand Bargain with China”: “The days when the world’s two largest economies could meet each other halfway have gone. Over the course of his first five-year term, Xi passed up repeated opportunities to avert rivalry with Washington. His increasingly revisionist and authoritarian turn has instead eliminated the possibility of a grand bargain between the United States and China. On most issues of consequence, there is simply no overlap between Xi’s vision for China’s rise and what the United States considers an acceptable future for Asia and the world beyond.” |
| “Change in Post-Putin Russia?” by Andrew Wood, in The American Interest | SURPRISE This is an excellent analysis that should improve investors’ mental model(s) of the forces driving future scenarios for Russia. “Putinist authoritarian rule has returned Russia to the dilemma confronting the Soviet Union at the end of the Brezhnev era: whether it can rethink or reformulate its fundamental purposes without un-leashing forces that its rulers cannot control.” “Russia has reverted to a condition comparable to that which led in the end to the fall of the USSR. Today’s Kremlin, like its Soviet predecessor, has proved unable to adequately address the linked questions of how to secure beneficial relationships with the outside world, responsible governance, and stable economic and social development.” “Putin’s Russia is ruled by an opaque and shifting power structure centered on the Kremlin. It is now devoid of authoritative institutions beyond that framework that would enable Russia to develop into a fully functional or accountable state.” Can this change? Putin’s mission was from the beginning to re-establish “order,” with the recipe of a centralized KGB/FSB as its mandatory magic ingredient. Maintaining such order is still his central purpose, within Russia and beyond it.” “Putinist authoritarian rule has thereby returned Russia to the dilemma confronting the Soviet Union at the end of the Brezhnev era: whether it can rethink or reformulate its fundamental purposes without unleashing forces that its rulers cannot control. Putin’s Kremlin has in consequence become increasingly determined to centralize decision making and to preserve its hold on power.” “Rethinking Russia’s options as to its international relations, system of governance, and economic and social policies has thereby over time become more difficult and more risky than it once might have been…Putin has no compelling view as to what new domestic policies he can or should offer his public. That has made the myth of defending a besieged Fortress Russia an essential buttress for his regime.” “Russia’s governing structures have become predominantly staffed and directed by law enforcement and security agencies (Siloviki). The KGB was never in overall political charge in Brezhnev’s time, or even Andropov’s. It occupied a much-reduced place under Yeltsin. But the FSB in its various guises is now at the undisciplined heart of government under Putin, expressed in a variety of security organs under differing acronyms and troubled by internal rivalries. The link between the Russian security organs and Putin’s preoccupation with Russian nationalism is an essential element in that dominance, a preoccupation naturally shared with Russia’s military organizations.” “The Siloviki, broadly defined, also have parallel interests in the opportunities for enrichment opened up to them by their role. Those interests extend to cooperation with organized crime groups and working with illegitimate but tolerated vigilante forces.” “The Siloviki will have their say in determining whoever or whatever succeeds Putin. There may well be divisions among them but it would take a stubborn courage to suppose that any of their leaders might perhaps favor liberalizing reform…Absent a change of direction over the next few years, [the Siloviki] will inherit a Russia weakened by an economy and society troubled by low growth, secured in place by the politically determined structures imposed upon it.” “It follows from the above account that Russia will not in the predictable future find a way to address the linked questions of how to secure beneficial relations with the outside world, responsible governance, and stable economic and social development. “Those Russians who fear that a car crash is inevitable sooner or later, and possibly even before 2024, have a persuasive case to make. There are a number who judge that only such a catastrophe will enable Russia to escape from its present travails. If the fear of an imminent internal crisis while Putin is still in charge proves justified, its implications for the West could well prove troubling. That would also be the case if, as seems more plausible, the next Russian leadership proves unable to establish and legitimate its authority.” |
| “Providing for the Common Defense”, by the independent, non-partisan “Commission on National Defense Strategy for the United States”, established by the US Congress. | SURPRISE This report reviews the 2018 National Defense Strategy published by the Trump Administration. Its key conclusion is blunt, and needs to be seen in the context of the Report of the US-China Economic and Security Review Commission. “The security and wellbeing of the United States are at greater risk than at any time in decades. America’s military superiority—the hard-power backbone of its global influence and national security—has eroded to a dangerous degree. Rivals and adversaries are challenging the United States on many fronts and in many domains. America’s ability to defend its allies, its partners, and its own vital interests is increasingly in doubt. If the nation does not act promptly to remedy these circumstances, the consequences will be grave and lasting.” |
| “The Power of Nations: Measure What Matters” by Michael Beckley | SURPRISE Most quantitative assessments of relative national power are based on comparisons of gross resources. Beckley argues (and provides evidence) that comparing net resources is a better measure. Using this metric, he claims that the United States’ net power advantage over China is still substantial. A very thought provoking challenge to a lot of today’s conventional wisdom. “China may have the world’s biggest economy and military, but it also leads the world in debt; resource consumption; pollution; useless infrastructure and wasted industrial capacity; scientific fraud; internal security spending; border disputes; and populations of invalids, geriatrics, and pensioners. China also uses seven times the input to generate a given level of economic output as the United States and is surrounded by nineteen countries, most of which are hostile toward China, politically unstable, or both. Accounting for even a fraction of these production, welfare, and security costs substantially reduces the significance of China’s rise.” |
| “What Deters, and Why” by Mazarr et al from RAND | SURPRISE Another report from RAND that will improve our mental models of conflict. “The challenge of deterring territorial aggression, which for several decades has been an afterthought in U.S. strategy toward most regions of the world, is taking on renewed importance. An increasingly belligerent Russia is threatening Eastern Europe and the Baltic States with possible aggression, conventional and otherwise. China is pursuing its territorial ambitions in the East and South China Seas with greater force, including the construction of artificial islands and occasional bouts of outright physical intimidation. North Korea remains a persistent threat to the Republic of Korea (ROK), including the possibility of large-scale aggression using its rapidly advancing nuclear arsenal.” “Yet the discussion of deterrence—as a theory and practical policy requirement—has lagged in U.S. military and strategy circles. This study aims to provide a fresh look at the subject in this context, with two primary purposes: to review established concepts about deterrence, and to provide a framework for evaluating the strength of deterrent relationships…” “The study stems from a specific research question: What are the requirements of effective extended deterrence of large-scale military aggression? … Our research highlighted several specific themes about successful extended deterrence, including:” “Potential aggressors’ motivations are highly complex and typically respond to many variables whose interaction is difficult to anticipate.” “Generally, opportunism in aggression seems less common than desperation caused by real or perceived threats to security or status.” “Clarity and consistency of deterrent messaging is essential. Half-hearted commitments to allies risk being misperceived.” “A ‘firm but flexible’ approach strengthens, rather than weakens, deterrence; leaving an adversary no way out is not an effective way to sustain deterrence. Compromise and concession are typically part of any version of successful extended deterrence of large-scale aggression.” “Multilateral deterrence contexts are especially dangerous. Deterring an aggressive major power while restraining an ally from taking provocative actions at the same time is extremely difficult…” “In sum, this analysis suggests that aggressor motivations serve as the first, and in some ways decisive, variable for interstate deterrence outcomes. Weakly motivated aggressors are easy to deter; intensely motivated ones, whose level of threat perception verges on paranoia, can be impossible to deter….” “This analysis also suggests that clarity in what is to be deterred, and how the United States will respond if deterrence fails is the second essential element of a successful deterrent posture.” |
| Uncertainty in Western Europe continues to increase. | Brexit confusion has only gotten worse this month. Meanwhile, France is faced with worsening street demonstrations over tax increases (and Macron’s policies more generally); in Germany the CDU party struggles to decide on a successor to Angela Merkel who is sufficiently conservative to slow the growth in support for the (right) populist AfD party without moving so far the the right that they lose support of in the center; and Italy continues to play a game of budget chicken with the EU. |
| New Social Information: Indicators and Surprises | Why Is This Information Valuable? |
| “How to Save Globalization” by Scheve and Slaughter, in Foreign Affairs | “In a series of recent studies we conducted in communities across the United States, we heard the same sentiments from a range of respondents in a variety of circumstances: anxiety and anger about globalization and change that was not related to income alone but more broadly concerned whether Americans can still secure meaningful roles in their families and communities… “But because the problem goes beyond income inequality, the usual policy solutions are inadequate. It is not enough simply to redistribute income to financially compensate the losers from globalization. Addressing the backlash requires giving all Americans the tools they need to carve out the sense of security and purpose they have lost amid change. That can happen only if the United States completely transforms the way it invests in and builds human capital.” Unfortunately, defining specific policy changes to implement this strategy, and then successfully implementing them (and overcoming the dogged defense of the status quo by many interest groups, like K12 school districts and higher education institutions) is the hard part… |
| “Strategies for Left Behind Places”, by Hendrickson et al, published by Brookings | Clearly, the policy community in the United States is focused on, and struggling with, how to meet the economic and social challenges that in 2016 gave rise to the Trump presidency. “The 2016 election revealed a dramatic gap between two Americas—one based in large, diverse, thriving metropolitan regions; the other found in more homogeneous small towns and rural areas struggling under the weight of economic stagnation and social decline.” “This gap between two American geographies came as a shock to many observers….the lion’s share of growth in the last decade has been concentrated—with relatively few exceptions—in a small cohort of urban hubs while the rest of the country has drifted or lost ground…” “Public policy has done little to halt or even mitigate this trend. Indeed, taken as a whole, the policies of recent decades have almost certainly exacerbated it…Now, the political impacts of these sins of omission and commission are clear.” “As the country has pulled apart economically is also pulling apart politically…Political parties that once brought voters together across regional lines now focus their appeal on the particular interests and outlook of a single kind of region. In the United States and throughout the West, parties with their principal support in metropolitan areas do battle with parties based in less densely populated areas. …Making matters even worse, these political divisions mirror widening differences between diverse, liberal, internationally minded cities and more homogenous, conservative, and locally focused small towns and rural areas, spawning a new culture war.” “The crystallization of these dueling political identities has shaken the liberal democratic order in the United States and beyond. Throughout the West, parties representing those who feel that they have lost out stand opposed to parties representing those who have benefitted from the economic and cultural changes of recent decades.” |
| “Work, Skills, Community: Restoring Opportunity for the Working Class”, by Opportunity America, cosponsored by the American Enterprise Institute and the Brookings Institution | Opportunity America is an important joint effort by the United States leading center left and center right Think Tanks to better understand and devise policy solution for better addressing the worsening inequality that has arguably been a critical root cause of many of the nation’s social and political conflicts. “Looking back, it’s clear that we as a nation should have seen the problem coming: the symptoms were stark and alarming.” Still, for all the attention of the past two years, it isn’t clear that anyone, left or right, understands working-class America. Who makes up the working class today? What exactly is it that ails them? Why, unlike in so many other parts of America, do their fortunes seem to be declining rather than improving? And what can government—state or federal government— do to remedy the collapse in blue-collar communities?” The authors’ definition of “working class” is: people with at least a high school diploma but less than a four-year college degree living in households between the 20th and 50th income percentiles—roughly $30,000 to $69,000 a year for a household with two adults and one child.” The report notes that, “We as a nation can and must renew the social contract that once bound us—the promise that if you worked hard and played by the rules, you could get ahead…That promise is no longer true for much of the working class, and we must restore it.” The report concludes with a long list of policy initiatives that would not worsen the current US federal budget deficit |
| “Male Earnings, Marriageable Men, And Nonmarital Fertility: Evidence From The Fracking Boom” , by Kearney and Wilson | SURPRISE “There has been a well-documented retreat from marriage among less educated individuals in the U.S. and non-marital childbearing has become the norm among young mothers and mothers with low levels of education. One hypothesis is that the declining economic position of men in these populations is at least partially responsible for these trends. That leads to the reverse hypothesis that an increase in potential earnings of less-educated men would correspondingly lead to an increase in marriage and a reduction in non-marital births.” “To investigate this possibility, we empirically exploit the positive economic shock associated with localized “fracking booms” throughout the U.S. in recent decades. We confirm that these localized fracking booms led to increased wages for non-college-educated men…Analysis reveals that in response to local-area fracking production, both marital and non-marital births increase and there is no evidence of an increase in marriage rates. The pattern of results is consistent with positive income effects on births, but no associated increase in marriage.” In sum, it’s not just the economy. Social values have also changed, perhaps permanently. |
| “How Britain Can Heal Its Ailing Social; Care System”, by Camilla Cavendish in the Financial Times, 10Nov18 | A critical question as populations age is the relationship between, and funding of, not just medical and hospital care, but also what is known as “social care”, including assisted living and skilled nursing facilities, and services that enable elderly people to remain in their own homes. When the latter fail, the result is usually an increase in hospitalizations, which reduces the number of beds available for acute care patients. “Every rich country is grappling with how to look after a growing number of elderly people with increasingly complex conditions. It’s no coincidence that two of the nations that are aging most rapidly — Germany and Japan— have pioneered the most comprehensive responses Germany’s mandatory long-term care insurance system was introduced in 1995, when its care system looked about as frayed as England’s does now. The scheme was crafted to ensure that everyone got something, no one got something for nothing and everyone put something in. Workers pay a compulsory levy. Employers contribute half; and the retired pay in full. The government did a deal with voters: you pay more in, but you get more out. The burden is shared and the risk is pooled…” “Japan introduced a similar system in 2000…The German and Japanese systems are not perfect. Some Germans gripe about care staff but they like the option of using the fund to pay their own relatives to provide care. In Japan, people feel strongly that they don’t want to rely on the state if they can possibly help it and they do worry that the taxes to maintain the fund keep rising as the population ages. But they enjoy the security.” “No one in those two countries is living with the crippling uncertainty or the sense of unfairness that haunts us here [in the UK].” Or in the US... |
| “Are Millennials Different?” by Kurz et al from the Federal Reserve Bank of New York | SURPRISE History shows that it is rarely the working class that drives disruptive political change; rather the risk of such change peaks at times when the middle class finds its reality far below its expectations. For some time there have been questions about the extent to which this applies to Millennials, with some claims that they have different desires that previous generations – e.g., regarding a preference for renting city apartments versus owning homes in a suburb. This study dispels some of those beliefs, and makes clear that many aspiring middle class millennials have found their consumption desires frustrated. This further suggests that his frustration will inevitably find political expression, for example in stronger support for progressive and populist solutions, and in particular to growing calls for a national solution to the problem of high health care cost in the United States. The authors note that, “relative to members of earlier generations, millennials are more racially diverse, more educated, and more likely to have deferred marriage; these comparisons are continuations of longer-run trends in the population. Millennials are less well off than members of earlier generations when they were young, with lower earnings, fewer assets, and less wealth. For debt, millennials hold levels similar to those of Generation X and more than those of the baby boomers. Conditional on their age and other factors [including, critically, their higher levels of student debt], millennials do not appear to have preferences for consumption that differ significantly from those of earlier generations.” |
| “Liberal Parents, Radical Children”, by David Brooks, New York Times, 26Nov18 | “When I meet someone who runs an organization in a blue state, I often ask: Do you have a generation gap where you work? The answer — whether the person leads a college, a nonprofit, a tech company, an entertainment company or a publication — is generally the same: Yes, and it’s massive.” “The managers at these places, who are generally 35 and above, are liberals. They vote Democratic and cheer on all the proper causes of the left. But some of the people under 35 are not liberals, but rather are militant progressives. The older people in the organization often have nicknames for the younger set: the Resistance, Al Jazeera, the revolutionaries. The young militants are the ones who stage the protests if someone does something deemed wrong…” “On the left, the big difference is over meliorism. The older liberals are appalled by President Trump, alarmed by global warming, disgusted by widening income inequality, and so on, but are more likely to believe the structures of society are basically sound. You can make change by voting for the right candidates and passing the right laws. You can change individual minds through education and debate.” “The militants are more likely to believe that the system itself is rotten and needs to be torn down. We live in a rape culture, with systemic racism and systems of oppression inextricably tied to our institutions. We live in a capitalist society, a neoliberal system of exploitation. A person’s ideology is determined by his or her status in the power structure.” “Two great belief systems are clashing here. The older liberals tend to be individualistic and meritocratic. A citizen’s job is to be activist, compassionate and egalitarian. Boomers generally think they earned their success through effort and talent.” “The younger militants tend to have been influenced by the cultural Marxism that is now the lingua franca in the elite academy. Group identity is what matters. Society is a clash of oppressed and oppressor groups. People who are successful usually got that way through some form of group privilege and a legacy of oppression…” “I guess the final irony is this: Liberal educated boomers have hogged the spotlight since Woodstock. But now events are driven by the oldsters who fuel Trump and the young wokesters who drive the left. The boomer finally got the top jobs, but feel weak and beleaguered.” |
| “The Opportunity Atlas Mapping the Childhood Roots of Social Mobility”, by Chetty et al | “Economic mobility varies dramatically across the US. This paper introduces a new interactive mapping tool that traces the roots of outcomes such as poverty and incarceration back to the neighbourhoods in which children grew up. Among the insights the data reveal are that children who grow up a few miles apart in families with comparable incomes have very different life outcomes, and that moving in early childhood to a neighbourhood with better outcomes can increase a child’s income by several thousands of dollars later in life.” The website tool can be found here: https://www.opportunityatlas.org |
| “What explains America’s mysterious baby bust?”, in The Economist, 24Nov18 | Japan and more recently Europe have been experiencing dropping fertility rates for years. American was long thought to be immune to this decline. However, three years of data have now raised serious questions about that belief.“ America’s total fertility rate, which can be thought of as the number of children the average woman will bear, has fallen from 2.12 to 1.77. It is now almost exactly the same as England’s rate, and well below that of France.” The Economist also notes falls in fertility rates among Hispanics and city dwellers as key drivers of national level results. This has serious consequences. For any given level of target economic growth, a lower domestic birthrate means that either higher immigration or higher productivity growth will be required to achieve it. |
| New Political Information: Indicators and Surprises | Why Is This Information Valuable? |
| “What Happens if Americans Stop Trusting the System?” by Andrew Sullivan, in New York Magazine, 19Nov18 | Back in 2010, The Index Investor first began to write about what we called “Increasing Threats to Political Legitimacy” (e.g., see the May and September issues). Unfortunately, the trends we identified have continued unabated, and indeed have accelerated. Today, lots of smart people are writing about this issue. One of those is Andrew Sullivan, whose writing we have admired for years. We therefore paid a lot of attention to what he wrote this month. “It’s been quite a while now that the phrase “cold civil war” has been bandied about. And it’s useful, so far as it goes. Polarization has now become tribalism, and tribe is now so powerful a force it is beginning to eclipse national loyalty. The two nations, to borrow Benjamin Disraeli’s description of 19th-century Britain, stand facing each other, without blinking, faces flush, equally matched, on trigger alert for offense or another set battle.” “What we don’t quite know is if this tenuous, balanced equilibrium is sustainable indefinitely, the system careening from one party’s bitterly contested rule to gridlock and back again, until our tribal tensions are somehow exhausted. Or whether the cold civil war could at some point get a little warmer, or even, shall we say, hot…What we don’t know, in other words, is when the legitimacy of the entire political system could come into doubt, across the ideological spectrum, in a way that might sanction undemocratic responses.” Sullivan has expressed his concerns before, for example in his May, 2016 column: “America Has Never Been So Ripe for Tyranny”, which is well worth a read, even if you don’t agree with its conclusions. We have also seen many other writers searching for historical analogies to the present political situation in the United States. Ones we’ve found thought-provoking include “The Suffocation of Democracy” by Christopher Browning (which compares current circumstances in the US to Weimar Germany), “Lurching to a New Weimar”, by Joel Kotkin, and “The Suffocation of History” by Richard Landes (which criticizes the Weimar analogy). A quote often attributed to Mark Twain reminds us that “history doesn’t repeat itself, but it often rhymes.” It is one that we are well-advised to keep in mind. |
| “The Republican Party Has Changed Dramatically Since George H.W. Bush Ran It” by Perry Bacon | Written just after Bush’s death, this column makes extensive use of data to drive home how much politics and the composition of the Democratic and Republican parties in the US have changed over the past 30 years. We all know this is true, but this evidence-rich analysis still comes as a bit of a shock to those of us with long memories. |
| “Is the Left Going Too Far?” by Peter Beinart | An excellent article summarizing the history of two periods of the left’s ascendancy in modern American politics – the 30s and the 60s – which Beinart uses to assess the latest one, whose beginnings he dates to the Occupy Wall Street movement in 2011 and the rise of Bernie Sanders. Beinart reminds us that in both these previous situations, the left overreached and triggered a strong electoral counter-reaction, but not before achieving some policy wins. |
| “The Central Challenge of the Age” by David Brooks, in the New York Times, 5Nov18 | Following on Beinart’s conclusions, David Brooks highlights some of the challenges facing America’s resurgent progressive left politicians. “National identity is the most powerful force in world politics today…The Republicans have flocked to Trump’s cramped nationalism and abandoned their creedal story. That has left the Democrats with a remarkable opportunity. They could seize the traditional American national story, or expand it to gather in the unheard voices, while providing a coherent, unifying vehicle to celebrate the American dream. And yet what have we heard from the Democrats? Crickets.” “What is the Democratic national story? A void…In the past, Democrats tended to see immigration as an economic issue. Most mainstream Democrats have always been pro-immigrant, but they also favored border enforcement as a way to protect working-class wages. Barack Obama deported more unauthorized immigrants in his first two years in office than Trump has so far. Bernie Sanders used to dismiss open borders as a “Koch brothers proposal.” But now, especially in the wake of Trumpian nativism, immigration is seen as a racial justice issue. Calls for law and order on the border are taken as code for racism…” “Democrats have a very strong story to tell about what we owe the victims of racism and oppression. They do not have a strong story to tell about what we owe to other Americans, how we define our national borders and what binds us as Americans.” “Here’s the central challenge of our age: Over the next few decades, America will become a majority-minority country. It is hard to think of other major nations, down through history, that have managed such a transition and still held together…If the Democrats are going to lead this transition, they’ll need not just a mind‑set that celebrates diversity, but also a mindset that creates unity. They’ll need policies that integrate different groups into a coherent nation, with shared projects, a common language and culture and clear borders.” “If you don’t offer people a positive, uplifting nationalism, they will grab the nasty one. History and recent events have shown us that.” |
| | |
| Energy and the Environment: Indicators and Surprises | Why Is This Information Valuable? |
| The new US National Climate Assessment was quietly released the Friday after Thanksgiving. | The Financial Times summarized it as follows: “Climate change could cost the US hundreds of billions of dollars and cause thousands of deaths every year by the end of the century unless there is a global shift to curb greenhouse gas emissions, a federal government report has warned.” “The latest National Climate Assessment, which the administration is legally required to publish every four years, said the global climate was “changing faster than at any point in the history of modern civilization, primarily as a result of human activities”, and was having effects that were already evident in the US and projected to intensify in the future…” “The largest costs of climate change for the US this century were expected to come from lost ability to work outdoors, heat-related deaths and flooding, the assessment said.” |
| The U.N. World Meteorological Organization released new projections showing that “global temperatures are on course for a 3 – 5 degrees Celsius (5.4 – 9.0 degrees Fahrenheit rise in this century, far overshooting a global target of limiting the increase to 2c (3.6F) or less.” | SURPRISE However, there also appeared a very thought provoking note in Nature by Xu et al, titled “Global Warming Will Happen Faster than We Think”. The authors claimed three causes will produce this result: (1) Greenhouse gas emissions are still rising; (2) “Governments are cleaning up air pollution faster than most climate modelers have assumed…Aerosols, nitrates, and organic compounds reflect sunlight and have kept the planet cooler, perhaps by as much as 0.7 degrees Celsius globally”; (3) “There are signs that the planet might be entering a natural warm phase that could last for a couple of decades.” Most importantly, the authors note that rapid warming will create not only a need for higher spending to mitigate wide range of impacts (e.g., sea level rise), but also “a greater need for emissions policies that yield the quickest change in climate, such as controls on soot, methane, and hydrofluorocarbon (HFC) gases. There might even be a case for solar geoengineering – cooling the planet by, for instance, seeding reflective particles into the stratosphere to act as a sunshade.” We strongly suspect that this “faster than expected” climate change scenario is not one that many investors have fully taken into account. |
| The International Energy Agency released its 2018 World Energy Outlook, which provides a number of alternative scenarios for future supply and demand. | Some highlights: “The profound shift in energy consumption to Asia is felt across all fuels and technologies, as well as in energy investment. Asia makes up half of global growth in natural gas demand, 60% of the rise in wind and solar PV, more than 80% of the increase in oil, and more than 100% of the growth in coal and nuclear (given declines elsewhere)…” “The energy world is connecting in different ways because of shifting supply, demand and technology trends. International energy trade flows are increasingly drawn to Asia from across the Middle East, Russia, Canada, Brazil and the United States, as Asia’s share of global oil and gas trade rises from around half today to more than two-thirds by 2040… “Fifteen years ago, European companies dominated the list of the world’s top power companies, measured by installed capacity; now six of the top-ten are Chinese utilities…” “The electricity sector is experiencing its most dramatic transformation since its creation more than a century ago. Electricity is increasingly the “fuel” of choice in economies that are relying more on lighter industrial sectors, services and digital technologies. Its share in global final consumption is approaching 20% and is set to rise further.” “Policy support and technology cost reductions are leading to rapid growth in variable renewable sources of generation, putting the power sector in the vanguard of emissions reduction efforts but requiring the entire system to operate differently in order to ensure reliable supply…[However] today’s power market designs are not always up to the task of coping with rapid changes in the generation mix…this could compromise the reliability of supply if not adequately addressed.” As is already clear in North America and Western Europe, the many challenges the energy industry must overcome during its transition away from fossil fuels are still very non-trivial (e.g., current grid control technologies struggle when variable generation from wind and solar exceeds roughly 30%, and the integration of the gas and power systems is creating many more potential sources of largescale failures). Moreover, these challenges tend to be poorly understood by both policymakers and the public. |
| The US Agency for International Development (USAID) published a new report, “The Intersection of Global Fragility and Climate Risks” | This report’s findings largely replicated those in previous reports on the potential impact of climate change on national security risks by intelligence and defense organizations. “States with high exposure to climate hazards face multi-faceted challenges, including physical and livelihood risks for the population that may force states to redirect scarce resources to adaptation or humanitarian response efforts and strain the capacity of states that, in many cases, are still solidifying democratic institutions and mechanisms for meeting public needs. Similarly, fragility can affect many aspects of a state’s capacity and legitimacy across its political, economic, social, and security spheres.” A majority of highly fragile states—26 of the 39 states with the highest or high fragility—have a large number of people or large proportion of the population facing high climate risks. “States with more than 1 million people living in high exposure areas are mostly located in sub-Saharan Africa, followed by the Middle East and North Africa (MENA) and South and Southeast Asia. India stands out with more than 118 million people in high exposure areas, followed by Nigeria with 41 million, Egypt with 33 million, Democratic Republic of the Congo (DRC) with 19 million, and Burma with 15 million.” |
| | |
| | |
| Health and Infectious Disease: Indicators and Surprises | Why Is This Information Valuable? |
| “Biodefense in the Age of Synthetic Biology”, by the US National Academy of Sciences | This new report provides more specific information on the nature of a developing threat. “Synthetic biology expands what is possible in creating new weapons. It also expands the range of actors who could undertake such efforts and decreases the time required.” “Based on this study’s analysis of the potential ways in which synthetic biology approaches and tools may be misused to cause harm, the following specific observations were made: “Of the potential capabilities assessed, three currently warrant the most concern: (1) re-creating known pathogenic viruses, (2) making existing bacteria more dangerous, and (3) using microbes to make harmful biochemicals “ “With regard to pathogens, synthetic biology is expected to (1) expand the range of what could be produced, including making bacteria and viruses more harmful; (2) decrease the amount of time required to engineer such organisms; and (3) expand the range of actors who could undertake such efforts. The creation and manipulation of pathogens is facilitated by increasingly accessible technologies and starting materials, including DNA sequences in public databases. A wide range of pathogen characteristics could be explored as part of such efforts.” “With regard to chemicals, biochemicals, and toxins, synthetic biology blurs the line between chemical and biological weapons. High-potency molecules that can be produced through simple genetic pathways are of greatest concern, because they could conceivably be developed with modest resources and organizational footprint.” “It may be possible to use synthetic biology to modulate human physiology in novel ways. These ways include physiological changes that differ from the typical effects of known pathogens and chemical agents. Synthetic biology expands the landscape by potentially allowing the delivery of biochemical by a biological agent and by potentially allowing the engineering of the microbiome or immune system…Although unlikely today, these types of manipulations may become more feasible as knowledge of complex systems, such as the immune system and microbiome, grows.” [Note that this was written before the disclosure of the use of CRISPR technology in China to change human DNA to enhance resistance to smallpox]. |
| Financial Markets and Investor Behavior: Indicators and Surprises | Why Is This Information Valuable? |
| “Bogle Sounds a Warning on Index Funds”, Wall Street Journal, 29Nov18 | SURPRISE “The father of the index fund says it’s probably only a matter of time before they own half of all U.S. stocks; ‘I do not believe that such concentration would serve the national interest… There no longer can be any doubt that the creation of the first index mutual fund was the most successful innovation—especially for investors—in modern financial history. The question we need to ask ourselves now is: What happens if it becomes too successful for its own good… “If historical trends continue, a handful of giant institutional investors will one day hold voting control of virtually every large U.S. corporation. Public policy cannot ignore this growing dominance, and consider its impact on the financial markets, corporate governance, and regulation. These will be major issues in the coming era.” |
| “Beware of Gradual, then Sudden Fissures in Credit”, by Michael Mackenzie in the 30Nov18 Financial Times | “We are heading into a typical late-cycle period where the excesses of corporate borrowing come home to roost, an outcome that usually surprises many investors accustomed to the good times…there is a lot more credit exposure in the form of baskets such as exchange traded funds. As we have seen, this can exacerbate selling pressure across the broad credit market.” “Against that dynamic what really worries many in the market is the expansion of triple B-rated debt, now running at $2.5tn, up from $670bn in 2008…What remains to be seen is whether private equity funds, which have become much bigger players in credit, stick to the long view and don’t join the rush to the exit.” |
| “Investors Start to Fret About Ballooning US Public Debt”, by Gillian Tett, in the Financial Times 8Nov18 | “According to the Congressional Budget Office, the total annual cost of net interest payments on American debt in 2018 will be around $318bn. Right now, that sum seems manageable, relative to the overall American budget. But the CBO calculates that servicing costs will triple in size to nearly $1tn by 2028, on current policy trajectories and assuming that interest rates rise towards their long-term average of 3.7 per cent and 2.8 per cent for 10-year bonds and three-month bills respectively (or slightly above the current levels of 3.2 per cent and 2.34 per cent). If so, interest payments will soon become the third biggest item on the budget, eclipsing even military spending. However, if interest rates rise faster than the CBO expects, the picture would be worse. For another striking feature of American debt is that its average maturity is only six years, shorter than most European countries. And during the Trump administration this maturity has —lamentably — shortened.” |
| “Complacent investors face prospect of a Minsky moment”, by John Plender in the Financial Times, 13Nov18 | Plender begins by highlighting “the debt-dependent nature of economic growth in the developed world.” “Since 2008 debt has grown notably faster than nominal gross domestic product. This is most obviously the case in the US where public sector debt was on an unsustainable path even before Donald Trump introduced the first pro-cyclical fiscal expansion since Lyndon Johnson’s in the 1960s. Federal government debt is thus on a trajectory where the debt-to-GDP ratio could, according to the IMF, exceed 90 per cent by 2024. With a presidential election looming there is little likelihood Mr Trump will suddenly embrace fiscal orthodoxy…” “Another important area of potential complacency relates to liquidity or the ability to deal without prompting adverse price movements. Regulatory curbs on proprietary trading in banks are clearly having an impact. So, too, are many structural changes in the markets including collective investment vehicles [e.g., government debt mutual funds and ETFs] that are assumed to be able to liquidate investments if investors seek to pull out in a troubled market.” “[A further] difficulty is that the search for yield has pushed people into areas such as the corporate bond market that has never been particularly liquid … Liquidity is an elusive quality at the best of times. In a bear market it can disappear in a moment. Rest assured that not all of today’s trading strategies are predicated on that reality.” |
| “Loss attitudes in the US Population” by Chapman et al | SURPRISE “Base on a representative sample of the U.S. population (N = 2;000)…we find that around 50% of the U.S. population is loss tolerant. This is counter to earlier findings, which mostly come from lab/student samples, that a strong majority of participants are loss averse. Loss attitudes are correlated with cognitive ability: loss aversion is more prevalent in people with high cognitive ability, and loss tolerance is more common in those with low cognitive ability. |
| “The Current State of Quantitative Equity Investing” by Becker and Reinganum | An excellent overview that makes a critical point. “The current approaches and products of quantitative equity investing stand on the shoulders of major theoretical and empirical contributions in financial economics. At the root of disciplined, modern investment processes are two intuitive concepts: risk and return. The notion of total return is obvious—price appreciation plus any dividend payments.” “Risk is not so straightforward. Indeed, in Risk, Uncertainty, and Profit, Knight (1921) distinguished between risk and uncertainty. In essence, uncertainty involves environments in which investors cannot articulate potential outcomes or the likelihood of those outcomes. In contrast, risk is much more precise, like a roulette wheel. The possible outcomes are well specified and the likelihood of each outcome is known, but in advance, an investor does not know which outcome will be realized. Quantitative methods rely on this latter view of risk.” At The Index Investor, our focus is instead on Knightian uncertainty that does not lend itself to easy quantification based on the frequency of historical events. |
| “Replicating Anomalies”, by Hou et al | As Stanford’s John Ioannidis has repeatedly shown in his research, replicating previous academic findings is a serious problem across the social sciences. This paper extends this analysis to previous investment research findings of different anomalies and claims that they can be exploited to generate alpha. The authors find that, “most anomalies fail to hold up to currently acceptable standards for empirical finance.” They conclude that “capital markets are more efficient than previously recognized.” |
| “The Many Faces of Human Sociality: Uncovering the Distribution and Stability of Social Preferences”, by Adrian Bruhin | SURPRISE This study presents interesting findings that divide people into three different categories of social preference, which remain stable over time. “There is vast heterogeneity in the human willingness to weigh others’ interests in decision making. This heterogeneity concerns the motivational intricacies as well as the strength of other-regarding behaviors, and raises the question how one can parsimoniously model and characterize heterogeneity across several dimensions of social preferences while still being able to predict behavior over time and across situations…” “We find that non-selfish preferences are the rule rather than the exception. Neither at the level of the representative agent nor when we allow for several preference types do purely selfish types emerge in our sample. Instead, three temporally stable and qualitatively different other-regarding types emerge without pre-specifying assumptions about the characteristics of types.” “When ahead in a contest, all three types value others’ payoffs significantly more than when behind. The first type, which we denote as strongly altruistic type, is characterized by a relatively large weight on others’ payoffs – even when behind – and moderate levels of reciprocity.” “The second type, denoted as moderately altruistic type, also puts positive weight on others’ payoff, yet at a considerable lower level, and displays no positive reciprocity.” “The third type is averse to being behind, puts a large negative weight on others’ payoffs when behind, and behaves selfishly otherwise.” “We also find that there is an unambiguous and temporally stable assignment of individuals to types.” |
How Close is the Macro System to One or More Critical Thresholds?
As we have noted, the macro drivers of financial market regime changes typically follow a rough chronological sequence, from technology to economic, security, social, and political causes and effects. Yet there are many feedbacks loops between them, creating complex root causes for many of the critical thresholds we have identified.
Understanding the time dynamics in this complex system is critical to avoiding substantial downside investment risk.
We use the UK Met Office Warning Model to communicate our assessment of these time dynamics. We estimate the time remaining before a critical macro system threshold is reached that could trigger a regime change, which is usually accompanied by substantial changes in asset class valuations.
The model uses three increasingly serious levels of warning, from “Be Aware” (condition yellow), to “Be Prepared” (condition orange), to “Take Action” (condition red).
For our purposes, we denote as “Be Aware” (yellow) critical thresholds that we assess to be three or more years away. We estimate that “Be Prepared” (orange) thresholds could be reached within 1 to 3 years. “Take Action” thresholds are very likely to be reached within one year.
Given their nature, we also note that in our three “wildcard” areas (Environment and Energy related; Disease and Human Caused Bioevents; and Cyber and Electromagnetic Events), our forecasts have higher levels of uncertainty.
The following charts summarize our current estimate of the time remaining before different critical thresholds will be reached.
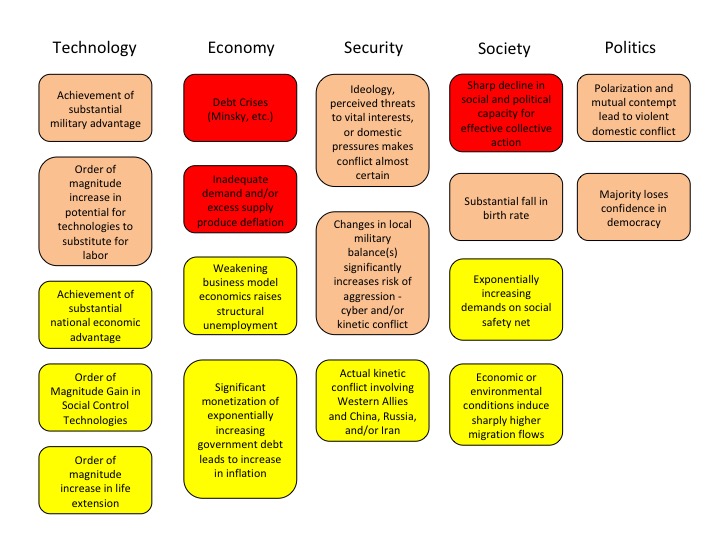
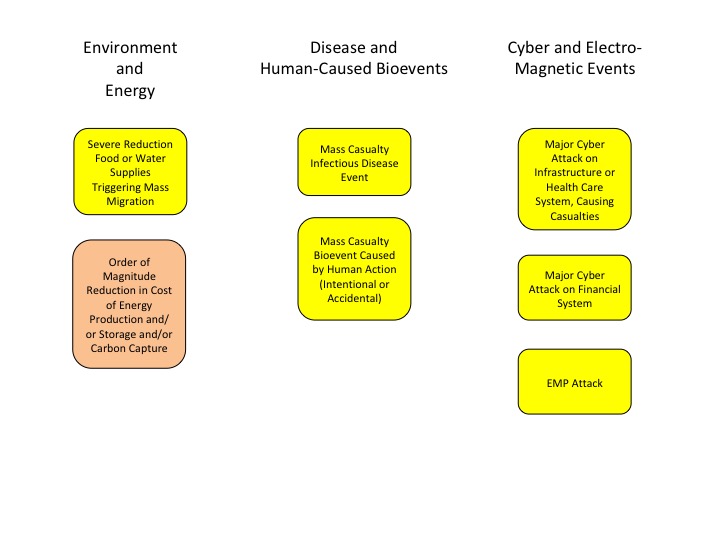
At the highest level, we believe the global macro system can be in one of four states, based on its degree of order versus disorder, and degree of social cooperation versus conflict. We believe that the system is currently in its most uncertain state, characterized by high degrees of underlying disorder and social conflict.
Our current forecast question is this: what is the probability we will either remain in the High Uncertainty Regime or transition to another regime over the next twelve months?
We currently estimate there is a 35% chance of remaining in the High Uncertainty Regime over the next 12 months, which will see the commencement of what promises to be a tumultuous US presidential campaign, and perhaps resolution of the Brexit saga (or at least the “end of the beginning”, and possibly the “beginning of the end”).
We also conclude that over the next 12 months, the probability of returning to the Normal Regime is slight, at 10%, as is the probability of entering the High Inflation regime over the next 12 months, at only 5%.
We estimate that the probability of entering the Persistent Deflation Regime over the next 12 months is now 50%. With the waning in the US of the stimulative effect of the Trump tax cuts, increasing uncertainty will have a more strongly negative impact on aggregate demand. This will be magnified by the substantial amount of debt that has been taken on by many companies, which more of them will likely struggle to service, which in turn will put more pressure on their cost structures, and potentially lead to increased unemployment, which will accelerate the downward spiral.
While we expect the High Uncertainty Regime will produce declines of 20% or more in equity asset classes, it is unlikely that any other asset class will experience a gain of 20% or more. We estimate there is a roughly even chance that gold could be the exception, with that increase heavily tied to continued global confidence in the US government and economy. While the apparent inflation and political uncertainty premia in the gold price today are high relative to the last 25 years, they are still below the peak reached in 2012, and it is possible that herding in the face of increasing uncertainty could produce 20% price gains.
Pre-Mortem Analysis
One of the most important forecasting disciplines is to ask yourself why your forecast could be wrong. Dr. Gary Klein’s research has shown that a very powerful and insightful way to do this is via a “pre-mortem analysis.” This method asks you to assume that it is a point in the future, and your forecast has been proven wrong (or your strategy or company has failed). You are then asked to look backward from this imagined point in the future, to explain why you failed, what you missed, and what you could have done differently to avoid your fate.
The pre-mortem method takes advantage of the fact that humans reason much more concretely and in more detail when explaining the past than they do when trying to forecast the future.
So let us assume that it is one year from now, and the high uncertainty regime has given way to a return to the Normal Regime, rather than to the Persistent Deflation regime.
How did this happen? What didn’t we anticipate happening?
(1) In previous issues, we have conjectured that perhaps because of an intensifying domestic debt crisis (and its own fear of Japanese-style deflation), or a belief that it had not yet achieved sufficient advantages to pursue more intense conflict with the United States, China could reach a new trade agreement with the US and EU to support continued economic growth. This would reverse (at least in the short-term) the growing tension in the US/China relationship, providing a strong confidence boost to the world economy and financial markets. In light of Novembers events (which we cover in this issue), we now regard the probability of this pre-mortem scenario as quite low.
(2) However we should not yet dismiss Donald Trump’s replacement by Mike Pence as a viable pre-mortem scenario that could cause our forecasts to be wrong. That said, upending our forecast would still require a Pence administration to make significant progress on a number of critical policy fronts, including relations with China, the productivity of the US healthcare and education systems, increasing real median household income, and reducing inequality.
Note: Combining this Forecast with Others and Extremizing the Result Should Increase Predictive Accuracy
Research has found that three steps can improve forecast accuracy. The first is seeking forecasts based on different forecasting methodologies, or prepared by forecasters with significantly different backgrounds (as a proxy for different mental models and information). The second is combining those forecasts (using a simple average if few are included, or the median if many are). The final step, which significantly improved the performance of the Good Judgment Project team in the IARPA forecasting tournament, is to “extremize” the average (mean) or median forecast by moving it closer to 0% or 100%.
Forecasts for binary events (e.g., the probability an event will or will not happen within a given time frame) are most useful to decision makers when they are closer to 0% or 100% than the uninformative “coin toss” 50%. As described by Baron et al in “Two Reasons to Make Aggregated Probability Forecasts More Extreme”, forecasters will often shrink their probability estimates towards 50% to take into account their subjective belief about the extent of potentially useful information that they are missing.
When you average multiple forecasters’ estimates, you are including more information, which should increase forecast confidence and push the mean estimate closer to 0% or 100%. However, this doesn’t happen when you use simple averaging. For this reason, forecast accuracy is increased when you employ a structured “extremizing” technique to move the mean estimate closer to 0% or 100%.
You can download an extremizing model from our website to use when combining the forecasts you use in your decision process. The extremizing factors in our model are those that the Good Judgment Project found maximized the accuracy of combined forecasts. Note that the extremizing factor is lower when average forecaster expertise is higher. This is based on the assumption that a group of expert forecasters will incorporate more of the full amount of potentially useful information than will novice forecasters.
Feature Article: The Fed Calls Time on the United States’ Hidden Debt Crisis: Public Sector Pensions
Normally, the Federal Reserve’s quarterly “Z.1” release of the National Accounts of the United States is not a cause of much excitement, let alone angst. But this year's 3rd Quarter release different, because the Fed finally added its very considerable weight to a critical argument over the true size of America’s unfunded public sector defined benefit plan liabilities.
As one who has been involved with the public pension issue for almost twenty years, I cannot overemphasize the importance of what the Fed has done, even if its consequences remain uncertain.
To be sure, recent years have seen a rising chorus of concern over the potential understatement of US public sector pension liabilities, by, among others, Robert Novy-Marx and Joshua Raugh, Jeffrey Brown and David Wilcox, Andrew Biggs, Steve Malanga, David Crane, Chad Aldeman, the Pew Charitable Trusts, and the credit rating agencies. Yet America’s growing public sector pension crisis has mostly remained in the “grey swan” category, or a recognized and growing risk, with a potentially substantial negative impact, whose consequences are believed to be so far in the future that they have yet to trigger or force significant action in the present.
So what did the Fed do? Technically, it began to report unfunded public sector pension liabilities, as calculated by the US Bureau of Economic Analysis using a new methodology that makes two important changes from the previous one.
First, liabilities are now calculated on a projected basis, rather than simply those that have been accrued to date by current and retired employees. In a world in which salaries and benefit promises continue to grow, and longevity increase, this methodology presents a more accurate estimate of the size of a pension plan’s liabilities.
Second, these future liabilities are discounted to their present value using the yield on AAA rated corporate bonds (about 4.10% at the end of November). This is significantly lower than the discount rate used by most state and local pension plan sponsors.
The Government Accounting Standards Board (GASB) allows these plans to (a) use accrued by not projected liabilities, and (b) discount them at a rate equal to the expected long-term investment return on the assets they hold. Use of this discount rate has been a source of increasing controversy in recent years.
Under the ERISA law, which applies to private but not public sector defined benefit pension plans, the former must discount their future liabilities using the yield on “High Quality Corporte Bonds” (which are further defined as those rated AAA, AA, A by Standard and Poor’s, or the equivalent by Moody’s, Fitch, and other rating agencies). The logic for using this rate is that the risk of default on a private company’s defined benefit pension obligations is equivalent to the risk of default on its bonds. Note that this logic is completely separate from the investment return the plan earns on its assets.
ERISA does not apply to public sector pension plans. Doing so, however, would make the essence of the grey swan issue crystal clear. According to the National Association of State Retirement Plan Administrators, the median public sector defined benefit pension plan currently uses a discount rate of 7.375%. To put this in perspective, at the end of November, the average yield on Single B rated corporate bonds was 7.48%. Using ERISA’s logic, which accords with financial economics theory, public plans’ use of this high discount rate implies that their beneficiaries are exposed to significant default risk (or, put differently, the risk of having their retirement benefits cut, as frequently happens when bankrupt private sector pension plans are transferred to the Pension Benefit Guarantee Corporation).
But this does not align with what public sector plan beneficiaries are told, or the way courts have behaved in the case of recent municipal bankruptcies, where pension obligations have been treated as senior to other forms of debt (including general obligation bonds, which heretofore were thought to be the most senior of all unsecured municipal debt issues). Seven states go so far as to protect public sector pension benefits in their constitutions.
If this is in fact the case, then it makes no sense to discount public sector pension plan liabilities at an unrealistically high 7.375% rate. Rather, they should be discounted at a rate that, at minimum, reflects the true probability of default by the plans’ municipal sponsors. For example, the average S&P credit rating on state government general obligation bonds is AA. At the end of November, the taxable equivalent yield on AA rated municipal bonds is 5.00% (using a 35% marginal tax rate). Yet as we have seen, courts have found that pension obligations are senior to general obligation bonds; hence, the Fed’s use of the lower AAA corporate bond yield is logical. In fact, if one were to claim that no plan default was possible, then the appropriate discount rate would be that on US Treasuries (e.g., the current 3.14% yield on 30 year Treasury bonds).
The initial result of the BEA and Fed’s changes was a very substantial increase in the present value of state and local defined benefits pension fund liabilities to approximately $8 trillion dollars, and a substantial increase in the funding shortfall (estimated liabilities less the current value of pension plan assets) to $4.2 trillion. This is significantly greater than the total value of state and local governments’ outstanding debt, which the Fed places at $3.1 trillion.
To put this into perspective, compare the total liabilities of state and local governments ($7.3 trillion) with others shown in the Fed’s 2018/third quarter report
Federal Government Debt = $17.8 trillion
Residential Mortgage Debt = $10.3 trillion
Non-Financial Corporate Debt = $9.6 trillion
Student Loan Debt = $1.6 trillion
While the initial impact of the Fed’s was shock, the longer term effects will likely be much more severe.
The first impact may come in disclosure statements made in collection with state and municipal bond issues. Now that the Fed has put a stake in the ground about their true size, continuing to use the GASB methodology to calculate unfunded public pension fund liabilities will almost certainly increase the risk of future litigation, against issuers, bond underwriters, and disclosure counsel. Once disclosed, however, the size of unfunded pension liabilities may end up reducing some issuers’ access to municipal bond markets.
The second impact will come in state and municipal pension plan annual reports, where the same issue will arise. Disclosure of substantially larger unfunded liabilities will inevitably lead to political concerns as to how they should be addressed.
The third impact will come at budget time, specifically in the calculation of sponsors’ “Annual Required Contribution” (ARC) to their public pension plans. If the Fed’s higher estimate of the unfunded liability is used, then ARCs will be significantly higher. In the absence of benefit cuts, this leaves state and local politicians with a no-win political choice between large cuts in other spending programs, or large tax increases. When some politicians inevitably try to make it, the case for the latter will likely be weakened by the presentation of data showing how few public sector employees actually stay on long enough to receive full benefits. Moreover, because of long vesting periods for new employees, many public sector pension plans serve to transfer potential benefits from employees who leave relatively early, to those who hang on until they qualify for full benefits. “Shining the light of day” on these aspects of public sector pension plan operations does not seem likely to boost political support for them.
Which is not to say that such support will not be offered by (usually Democratic) politicians who are heavily dependent on public sector unions for their reelection. Thus the fourth impact is likely to be heightened political conflict in many states, perhaps accompanied by calls for a federal bailout of state and municipal pension plans, which would convert state conflicts into a national one, in which taxpayers across the nation would be asked to bailout public pensions in the states which have been most irresponsible in their management. These include (with the Fed’s funding ratios in parentheses):
Illinois (25%)
New Jersey (30%)
Kentucky (32%)
Massachusetts (33%)
Connecticut (34%)
South Carolina (36%)
Pennsylvania (37%)
Moreover, this inevitable national debate over state and local pension bailouts will come at the very time that the federal budget itself will likely be under severe pressure from a combination of structural forces (e.g., an ageing population, increased conflict with China, higher interest payments on growing debt, etc.), and cyclical ones (e.g., automatic stabilizer payments, like social safety net benefits, during an extended economic downturn).
This brings us to the final impact, which was well described by Rob Arnott and Lisa Meulbroek in their Wall Street Journal article, “The Stealth Pension Mortgage on Your House” (5Aug18). The essence of their argument is that when it comes to raising taxes to fund public sector pensions, the least mobile tax base is real estate, as taxpayers can find various ways (including moving) to shift earnings and purchases to other states, and thus reduce local income and sales tax revenue. In fact, as others have argued, in some locations a substantial portion of recent tax increases is already being used to fund higher pension contributions (e.g., see, “Pensions Make Illinois Property Taxes Among the Nation’s Most Painful”, by Divounguy, Hill, and Tabor).
Moreover, the size of this “stealth pension mortgage” is non-trivial. As they authors note, “on average nationwide, unfunded state and local pension burdens represent 20% of real estate values. This often rivals or exceeds owners’ equity in their homes…If real estate prices eventually adjust to reflect unfunded pension obligations, many homeowners’ equity could be at risk.”
Last but certainly not least is the predictable response by some public pension advocates when confronted with the above arguments. “There’s not need to worry. High investment returns will solve the problem.” In fact, as AEI’s Andrew Biggs recently pointed out, because of reductions in the future rate of inflation they expect, in real terms the future returns public pension funds expect to earn are at an all time high (“Public Sector Pensions Assume Record High Investment Returns” published by AEI).
The key question is where they expect these returns to come from. Real interest rates are at near-record lows. Most equity markets are substantially overvalued. And if, as we currently forecast, the global economy is poised to enter the Persistent Deflation Regime, high real equity returns are unlikely.
To be sure, many public pension funds have, since the 2008 financial crisis, shifted a substantial portion of their portfolios into private equity, hedge funds, and other strategies in the hope of earning higher returns. Unfortunately, there is abundant evidence that in most cases these hopes are not being realized, even before the high expenses associated with these allocations are taken into account.
In sum, higher investment returns will almost certainly not solve the dire public pension funding situation the Fed has now brought into painful and unavoidable focus. The grey swan has finally arrived.
If you have any questions about anything we have written in this issue, please don’t hesitate to get in touch, at contact@indexinvestor.com