The Index Investor
August 2020
Tactical Asset Allocation Implications of Our Forecasts
Forecast Logic
Forecast Pre-Mortem Analysis
Combining and Extremizing Forecasts to Improve Predictive Accuracy
Feature Article: Joe Biden Wants to Remove Carbon from US Electricity Generation by 2035. Is That Realistic?
High Value Information Observed Last Month
- Technology
- Energy and Environment
- Health and Disease
- Economy
- National Security
- Society
- Politics
- Financial Markets and Investor Behavior
Critical System Thresholds/Tipping Points Analysis
Appendix: Anticipatory Thinking and Forecasting Methodologies
Current Macro Forecast
Over the next twelve months, evidence continues to accumulate that the real economy is in worse shape that equity market investors apparently believe. COVID lab test bottlenecks continue in the US, and infection levels remain high. As cold weather returns to the northern hemisphere, COVID cases will likely increase, assuming more people congregate in enclosed areas with insufficient ventilation and other measures to limit the accumulation of coronavirus aerosols to a level that can trigger superspreader events.
Bankruptcies are increasing; in the case of small and medium enterprises, this is leading not to Chapter 11 restructurings, but Chapter 7 liquidations, which represent a permanent loss of jobs and productive capacity.
The continuing failure of the politically polarized US Congress to pass another stimulus plan will very likely accelerate these trends.
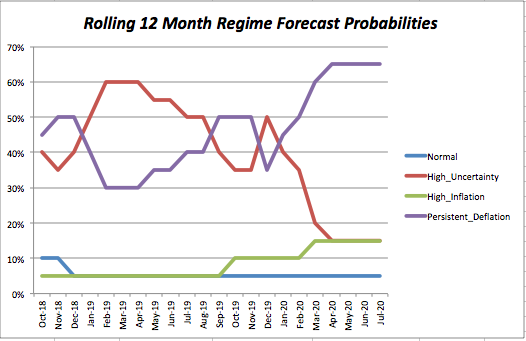
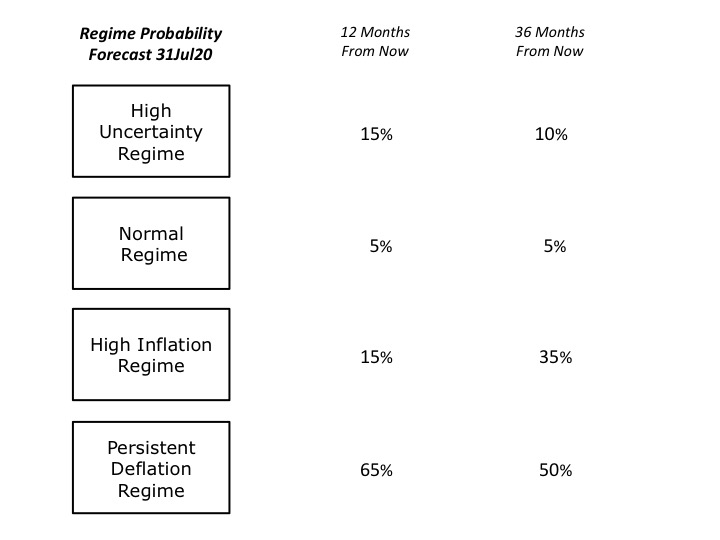
We have made no change to our 36-month regime forecasts. The probability the United States will be in the Persistent Deflation Regime remains 50%, as evidence continues to accumulate that the economy will very likely suffer a deeper and longer downturn than many investors currently expect.
It seems very likely that the US will experience a constitutional crisis after the November election. This will sharply increase uncertainty, with its attendant negative impact on the economy. At this point, it does not appear that this has been fully incorporated into asset market prices.
It also appears that the probability of an intensifying political crisis in the United States regardless of who is eventually sworn in as the nation’s next president has not been fully incorporated into the dominant narratives driving asset prices today.
The essence of the issue is this: Following the 2008 Great Financial Crisis, substantial numbers of middle class Americans lost their homes to foreclosure. Today, many of those same families are losing their jobs and having to close businesses in which they have invested all their savings and spent years building. And to make matters even worse, they are slowly beginning to realize that the COVID learning losses their children have experienced in school are very unlikely to be remediated, which has dire implications for their future prospects in the post-COVID economy (and the growth of the economy itself, as those losses will also depress future productivity gains). In the 2016 election we saw that the effects of the GFC unleashed social and political forces whose power elites failed to comprehend. I suspect that is happening again, with future effects that unknown at this point, but which will almost certainly lead to substantial increases in uncertainty.
Thus far, China’s response to COVID’s economic shock has followed its traditional stimulus playbook, with large, debt financed increases in spending on infrastructure, real estate, and by state owned enterprises. The problem is that every time they use it, the investments get even more marginal in terms of their potential economic return, and thus ability to repay their debt load. As Herbert Stein said, “if something cannot go on forever, it will stop.” And when it does, China will very likely face some type of crisis that could lead to a combination of increased internal disorder (less likely) and more aggressive external behavior (more likely).
Another important new development was Iran’s announcement that it is building a new port on the Gulf of Oman that will open in March 2021. This will enable it to export oil without having to ship it (to China) through the Strait of Hormuz. This will give it much more freedom to mine or otherwise attempt to close the Strait in the future. That may happen sooner than many expect, especially if Israel perceives that Donald Trump will not remain president, and that a Biden administration will be much less supportive of what the current Israel leadership appears to believe is an existential confrontation with Iran. This would likely incentivize Israel to speed up planned actions toward Iran if it believes its scope for taking those actions will soon be reduced.
Finally, it is important to keep in mind that the headwinds that were restraining aggregate demand growth before the devastating arrival of the COVID-19 pandemic either have not improved or are worsening. These include slower population growth and faster aging, weak productivity growth, declining labor share of GDP, rising levels of both inequality and debt, and the growing threat of job displacement as increasingly capable automation and artificial intelligence technologies are deployed.
Our 36-month forecast probability for being in the High Inflation Regime remains at 35%.
Whether the High Inflation Regime comes to pass will depend on the interaction between COVID19’s shocks to demand and supply, along with even more important political factors.
We know that the demand shock has been swift and severe, and has triggered falls in the US Consumer Price Index. Current evidence leads to the conclusion that depressed demand may last longer than many expect. The longer it takes to develop and deploy an effective vaccine, more layoffs will occur, more bankruptcies will take place, and the long term impact of uncertainty will be stronger. All of these depress consumption, investment, and export demand. If supply remained constant, this would tend to decrease rather than increase prices.
However, COVID19 has also been a shock to aggregate supply; many past episodes of high inflation were caused by such shocks (e.g., oil supply cutbacks in 1973 and 1979). In June, the US Consumer Price Index reversed its recent three months of decline, and increased by 0.6%. This was primarily driven by a 5.1% increase in energy prices, which reflected the interaction of a modest increase in demand as quarantines were lifted with a much larger reduction in supply.
On balance, we continue to believe that the impact of demand destruction will outweigh the impact of supply reduction.
In our view, the most logical cause of a return to the High Inflation regime over the next 36 months would be a crisis of confidence in the US government and/or economy that causes a flight from the US dollar and a sharp rise in the price of imported goods (and very likely gold as well).
Another potential cause of such a crisis would be the outbreak of open conflict between the China and the United States (e.g., a Chinese invasion of Taiwan or rapid escalation of a kinetic encounter in the South China Sea) in which American forces were defeated and/or global supply chains were severely disrupted.
Finally, at the 36-month time horizon, our forecast probabilities for the High Uncertainty (10%) and Normal Regimes (5%) also remain unchanged. The former regime could occur if the Democrats win the White House and both houses of Congress in November, and struggle to revive the economy with good policy initiatives, but without an effective coronavirus vaccine while facing intensifying conflict with China.
Return to the Normal Regime would require the same political wins and policy initiatives, avoidance of new uncertainty shocks, early deployment of a highly effective vaccine, and a sharp reduction in US-China tensions (e.g., due to the removal of Xi Jinping from office).
In reviewing the current situation, we are again reminded that when uncertainty is high, people rely more heavily on social learning and copying what others are doing. Not only does this slow the diffusion of new information throughout social systems like economies and financial markets, but it also causes these systems to coalesce around a small number of increasingly fragile narratives. Under these conditions, rapid, non-linear changes are very likely to occur.
That certainly appears to be the case today in global financial markets.
Portfolio Allocation Implications of Our Forecast
We take two approaches to deriving the tactical asset allocation implications from our analyses. The first takes a systematic approach, and is based on relative asset class valuations. Our starting point is our “neutral” model portfolio, which is equally weighted across nine broad asset classes, and also includes a 10% allocation to alpha strategies (equity market neutral and global macro) that are designed to have a low correlation to returns on broad asset classes. Based on asset class valuations, we systematically vary the asset class weights (but not the active strategy weight), increasing from 10% to 15% when an asset class is likely undervalued, and 15% when it is very likely undervalued. In the case of overvaluations, we go to 5% and then into cash, if there are no undervalued asset classes with room for an increase. In effect, this replicates the systematic rebalancing strategy we used for 15 years in our previous model portfolios.Based on subscriber requests, this month we are re-introducing a feature from the previous version of The Index Investor: Tactical Asset Allocation Implications from our analyses.
The second tactical approach is based on our subjective view not only of current asset class valuations, but also of the implications of the broader macro trends and uncertainties that we analyze each month. Importantly, this subjective view reflects our primary goal of avoiding large downside losses, rather than seeking large upside gains.
Two final notes: First, with respect to US fixed income, we include credit products (investment grade and high yield) in the same asset class as government debt, and will shift into the former when their valuations become attractive. Second, we regard gold not as a separate asset class to be held long-term, but rather as a complement to cash, into which we shift in periods of substantial overvaluation across multiple asset classes.
More information about our investment beliefs, including our core philosophy, approach to asset allocation (including our model portfolios and their long-term track record), and views on various approaches to active and passive management can all be found here.
Here is our latest asset allocation view:
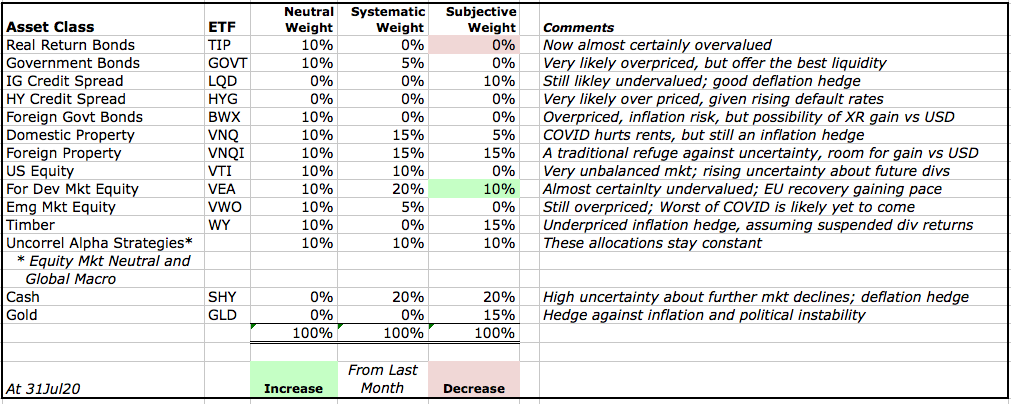
To expand our comment about timber. WY’s dividend was suspended when the COVID pandemic arrived. Up to that point, timber had very likely been undervalued. We assume the dividend will resume; hence it is very likely still is undervalued. However, if the dividend suspension is permanent, then it is almost certainly overvalued.
.
Forecast Logic: Quantitative Indicators
Implications of the Most Recent Three Month Asset Class Returns
Our quantitative forecast methodology focuses on the level and change in three-month returns, over the most recent and previous three-month periods, for those asset classes, which should perform best under different regimes (in this sense, our regimes can be regarded as macro factors). We assume that relatively higher returns are associated with more widely held investor belief in the probability that a given macro regime will develop in the future.
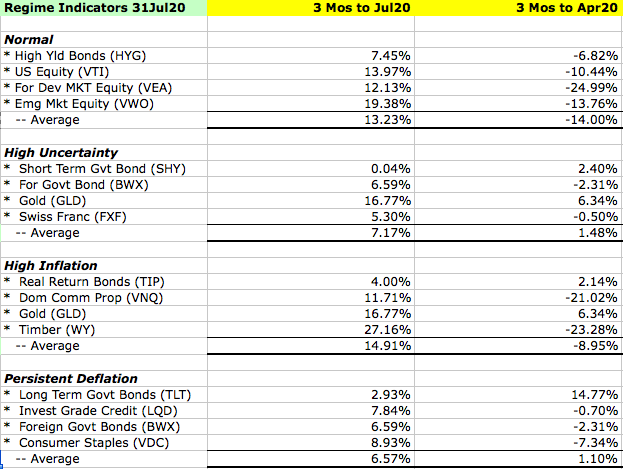
At the end of last month, rolling three-month returns on different asset classes implied that the marginal investor viewed the Normal and High Inflation regimes as the most likely to develop in the future, just as they did last month. As noted in our forecast, we disagree with this assessment, and the narratives on which it rests.
Asset Class Valuation and Momentum Indicators (@31Jul20)
| Asset Class (ETF) | Valuation | 1 Month Return | Conclusion |
| US Real Return Govt Bond (TIP) | Very Likely Overvalued* | 2.33% | Increasing Overvaluation |
| US Nom Return Govt Bond (GOVT) | Likely Overvalued* | 1.14% | Increasing Overvaluation |
| US Investment Grade Credit (LQD) | Likely Undervalued* | 3.09% | Decreasing Undervaluation |
| US High Yield Credit (HYG) | Very Likely Overvalued* | 5.04% | Increasing Overvaluation |
| US Commercial Property (VNQ) | Likely Undervalued* | 3.64% | Decreasing Undervaluation |
| US Equity (VTI) | Very Likely Overvalued* | 5.74% | Increasing Overvaluation |
| Foreign Devel Mkt Equity (VEA) | Very Likely Undervalued* | 2.63% | Decreasing Undervaluation |
| Emerging Markets Equity (VWO) | Very Likely Overvalued* | 8.58% | Increasing Overvaluation |
| Timber (WY) | Almost Certainly Overvalued* (due to temporary dividend suspension) | 23.82% | Increasing Overvaluation |
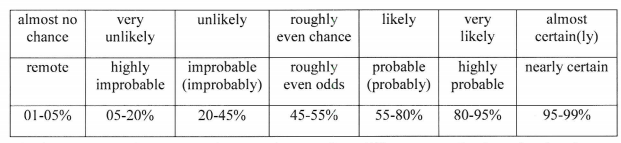
Note: The language we use to describe our estimated likelihood of asset class over or undervaluation is based on US Intelligence Community Directive 203 on Analytic Standards, which includes the following table:
Market Stress Indicators (@31Jul20)
| Market Stress Indicator | This Month vs Last Month |
| Asset Class Returns Autocorrelation (this month versus last month). Higher autocorrelation is an indicator of higher market stress. | .79 vs .24 the previous month. This indicates a sharp rise in the level of market stress. |
| Economic Policy Uncertainty Index (how many days over the last 30 was index in top quartile of values since 1985?). A higher number equals more market stress. | On 30 days last month (unchanged from the previous month) the index was in the top quartile of daily values since 1985 (the 99th percentile of all rolling 30-day periods). |
| AAA Rated Bonds Spread over 10 Year Treasury Yield (month end). Higher spreads indicate rising concern about market liquidity. | 1.48% (62nd percentile since 1983), vs 1.68% at the end of the previous month, indicating a high level of market stress. |
| BB Rated Bonds Spread over 10 Year Treasury Yield (month end). High spreads indicate increasing credit risk. | 3.55%, (56th percentile) down from 4.69% (81st) last month, indicating a falling level of market stress. |
| Gold Price per Ounce in US Dollars (month end). Rising gold prices are an indicator of increasing market uncertainty and stress. | $1,975 vs $1,771, up (11.5%) from the previous month. At the end of 2017, we estimated the “disaster premium” in the gold price was 47% (see our methodology in the Appendix). At the end of last month it was 99%. |
New Qualitative Evidence
• New analyses from both McKinsey and Deloitte found that companies are shifting their technology investments towards areas that will likely lead to job losses; however progress is being restrained by a lack of talent.
• This ties into the low likelihood that COVID learning losses are not going to be remediated, absent very substantial (and very unlikely) changes to the United States’ K-12 education system. This means that the talent shortage that is restraining companies’ investment in advanced technologies will very likely worsen. Not only will this hold down economy wide productivity gains (and thus the economic growth that is critical to serving the exponential growth in debt that COVID had triggered), but it will also support continuation of “winner take all” dynamics in many industries. Companies that can attract scarce talent can maximize the use of advanced technologies, which leads to higher market share, bigger profit margins, and the ability to pay talent more than competitors. The result is both worsening income inequality and increased concentration in a growing number of industries.
• New research was published on the aerosol transmission of coronavirus, and the importance of indoor air quality, masks, and physical distancing to limit superspreader events when more people head inside when the seasons change and temperatures drop in the northern hemisphere. On the bright side, new reports also found that population heterogeneity in individual responses to coronavirus means that we could be closer to limited herd immunity than previously estimated.
• The nations of the European Union finally agreed on a 750 billion Euro stimulus package. Along with much lower COVID infection rates than in the US, this should lead to a quickening economic recovery.
• The latest PEW Research poll finds that a record high 73% of Americans have an unfavorable opinion of China (68% of Democrats, and 83% of Republicans), up from just 29% in 2006. If Biden wins in November, US conflict with China is unlikely to moderate, unless and until Xi Jinping is removed as the nation’s leader.
• A series of new reports provided further evidence that America’s level of social capital has continued to decline, and the multiple negative effects that has had, not the least on the nation’s politics.
• In the US, multiple analyses focused on the fraught relationship between the increasingly progressive Democratic Party and the white working class. Whether Biden can win back voters who supported Obama in 2008 and 2012, but Trump in 2016 could be critical to his winning the swing states that cost Hilary Clinton the last election.
Pre-Mortem Analysis
One of the most important forecasting disciplines is to ask yourself why your forecast could be wrong. Dr. Gary Klein’s research has shown that a very powerful and insightful way to do this is via a “pre-mortem analysis.” This method asks you to assume that it is a point in the future, and your forecast has been proven wrong (or your strategy or company has failed). You are then asked to look backward from this imagined point in the future, to explain why you failed, what you missed, and what you could have done differently to avoid your fate.
The pre-mortem method takes advantage of the fact that humans reason much more concretely and in more detail when explaining the past than they do when trying to forecast the future.
So let us assume that it is one year from now, and our current forecast has turned out to be wrong.
How did this happen? What developments did we fail to anticipate?
- A number of world leaders – Xi Jinping and Donald Trump, and to a lesser extent Vladimir Putin and Ali Khamenei are all facing sharply weakened economies and declining political popularity. History teaches us that this can lead to increased “foreign adventurism” to distract the public from worsening domestic conditions, as a nation rallies around its leader in a period of heightened external conflict. Should a “kinetic” conflict develop between China and the United States, or Iran and Israel, Saudi Arabia, and/ or the US, or between Russia and one or more European countries (e.g., due to a Russian incursion into the Baltics), it would generate a very sharp increase in uncertainty that would likely accelerate the already sharp COVID-19 economic slowdown. Given given high debt levels, this would very likely accelerate the arrival of the Persistent Deflation Regime.
- On the other hand, the removal from office (by one means or another) of Xi Jinping or Donald Trump * could * lead to a reduction in the dangerously growing conflict between the two nations, and increase cooperation in both the fight against COVID19 and the recovery of the global economy. This would somewhat reduce the probability of both the Persistent Deflation and High Inflation Regimes, and raise the relative probabilities of the High Uncertainty and Normal Times Regimes.
- A supply side shock of some type – beyond the disruption of global supply chains caused by COVID-19 -- could produce a sudden increase in inflation. The most likely scenario is a reduction in oil supplies due to a prolonged kinetic conflict between Iran and the US. An unlikely scenario could be major crop failures associated with the next solar cycle, which NASA forecasts will be the weakest in 200 years. McKinsey recently concluded that the probability of such a failure has increased due to changes in the environment, and now stands at about 10% over the next five years.
- Another route to the high inflation regime (repeatedly noted by Bridgewater’s Ray Dalio) would be a sudden loss of confidence in the US dollar relative to other currencies (driving up import prices), perhaps because of increasing deficit monetization and policy paralysis if a severe downturn continues without meaningful policy reforms to address critical structural challenges. However, a sharp rise in import prices due to a collapse in the USD exchange rate also requires relatively higher confidence in another currency, with the Euro being the most likely candidate. This currently seems unlikely, given both the Eurozone’s economic and political uncertainty, and the prospect of an intensifying conflict between the West and China. If confidence collapsed in all major currencies, the price of gold would rise, and price inflation would only occur in terms of gold.
Note: Combining Our Forecasts with Others From Other Sources and Extremizing the Result Should Increase Your Predictive Accuracy
Research has found that three steps can improve forecast accuracy. The first is seeking forecasts based on different forecasting methodologies, or prepared by forecasters with significantly different backgrounds (as a proxy for different mental models and information). The second is combining those forecasts (using a simple average if few are included, or the median if many are). The final step, which significantly improved the performance of the Good Judgment Project team in the IARPA forecasting tournament, is to “extremize” the average (mean) or median forecast by moving it closer to 0% or 100%.
Forecasts for binary events (e.g., the probability an event will or will not happen within a given time frame) are most useful to decision makers when they are closer to 0% or 100% than the uninformative “coin toss” 50%. As described by Baron et al in “Two Reasons to Make Aggregated Probability Forecasts More Extreme”, forecasters will often shrink their probability estimates towards 50% to take into account their subjective belief about the extent of potentially useful information that they are missing.
When you average multiple forecasters’ estimates, you are including more information, which should increase forecast confidence and push the mean estimate closer to 0% or 100%. However, this doesn’t happen when you use simple averaging. For this reason, forecast accuracy is increased when you employ a structured “extremizing” technique to move the mean estimate closer to 0% or 100%.
You can download an extremizing model from our website to use when combining the forecasts you use in your decision process.
The extremizing factors in our model are those that the Good Judgment Project found maximized the accuracy of combined forecasts. Note that the extremizing factor is lower when average forecaster expertise is higher. This is based on the assumption that a group of expert forecasters will incorporate more of the full amount of potentially useful information than will novice forecasters.
Feature Article: Joe Biden Wants to Remove Carbon From US Electricity Generation by 2035. Is That Realistic?
In 2019, the United States consumed 4,118,000 gigawatt hours of electricity (4,118 billion kilowatt hours, or 4,118 terawatt hours).
By generation fuel, 63% was produced using fossil fuels (24% coal, 38% natural gas, 1% other). Nuclear accounted for 20%, and Renewables the remaining 17% (7% wind, 7% hydro, 2% solar, 1% other).
Realizing the Biden plan’s goals will require some combination of four changes:
1) A large increase in nuclear generation (very unlikely);
2) A large increase in the use of carbon capture and storage technologies (which, given current technologies, would produce a substantial increase in electricity prices);
3) A very large increase in generation from wind and solar; and
4) A very substantial increase in the use of utility scale battery storage technologies (both to reduce the use of gas fired plants that run to meet demand peaks, and to support the expansion of intermittent generation technologies like wind and solar).
The expansion of utility scale battery storage is by far the most uncertain of these options, yet seems to be the critical assumption that underlies the Biden plan. Given its disruptive potential, it is important to understand the underlying issues.
Let’s start by clarifying the confusing terminology used battery storage discussions. Megawatts are a measure of the power rating of a battery – how fast it can discharge stored energy. The more power that can be released over a given period of time, the more powerful the battery.
In contrast, Megawatt Hours are a measure of how much energy is storied in the battery – how much energy it can discharge.
Mathematically, a battery’s Megawatt Hours equal its power times the length of time (in hours) it can discharge its full power.
These highlight a fundamental battery tradeoff: You can get full power for short period of time, or a lower amount of power for a longer period of time. For example, a 60MW battery that stores 240 MWh of energy can discharge 60MW for four hours, or 30MW for eight hours.
Here’s an example. There are basically two types of power generation units. “Baseload” units have a high rate of capacity utilization, while “Peaking” units tend to be older and less efficient, and only generate power when daily electricity demand is at its highest point (note that these peak periods are of varying lengths, depending on the season and location of demand – e.g., areas with large cities tend to have longer peaks).
In the United States in 2018, almost 90% of electricity generated from natural gas was produced by highly efficient combined cycle baseload plants, while only 10% was produced by less efficient (and often ore polluting) combustion turbine peaker plants.
According to a recent study, New York’s gas fired peaker plants have a capacity of 4,500 Megawatts (4.5 gigawatts). The study’s authors concluded that, if cost efficient batteries that could discharge for 6 hours were installed, they could replace 275 Megawatts of this gas fired peaker capacity. Batteries that could discharge for 8 hours could replace 500 MW of gas fired peaker capacity. And if the 6-hour batteries were paired with new solar generation facilities, 1,804 MW of gas peaker capacity could be displaced.
That sounds great, doesn’t it? That’s certainly the kind of story you see a lot these days, extolling the brave new (greener) world of renewables (especially solar) paired with batteries that is just around the corner.
But how real is this vision?
Let’s look at six issues that you don’t read about as much: (1) Grid control; (2) Profitability of the battery storage revenue model; (3) Batteries’ cost; (4) Batteries’ long term safety and reliability; (5) Batteries’ use of rare earth minerals; and (6) How climate change will affect future solar radiation and wind.
Grid Control
Buried in the New York study was this critical sentence: “We did not consider [battery] charging constraints if multiple gas fired peakers were removed” and replaced with solar generation. The underlying assumption of pairing batteries with solar generation is that there will be times during the day when all the generating facilities on a grid will be producing more electricity than is required to satisfy total demand. During those periods, it is assumed that solar facilities will be allowed by the system operator to recharge their paired battery.
But by regulation, system operators are generally required to “dispatch” (i.e., take power from) producers in order of their cost, with the lowest cost facilities (e.g., nuclear plants) being dispatched first, and the most expensive ones (e.g., gas peakers) dispatched last. What happens if solar is so cheap that is frequently dispatched and has insufficient time to recharge the battery that is supposed to meet peak power demands (e.g., late on a winter afternoon when the sun has gone down and people come home and turn on a lot of electrical appliances)?
While it is not yet clear how regulators will make this tradeoff, it seems very likely that it will end up being litigated.
A closely related issue is the minimum number of hours that regulators and system operators will require battery storage operators to be able to provide. For example, a four hour minimum is likely to result in many more battery storage facilities than an eight hour requirement (which is why the PJM system operator has recently set an 11 hour requirement for storage operators to have grid access – a decision which is also getting challenged: see, “Capacity Value of Energy Storage in PJM” by Astrape Consulting for the US Energy Storage Association and the Natural Resources Defense Council).
More broadly, as you add more intermittent (or variable renewable) generating sources like wind and power to an electricity grid, along with fast responding batteries in multiple locations, maintaining control of that grid becomes much more challenging.
In essence, grid control involves the simultaneous solution of four problems:
1) Power generation and transmission capacity must be sufficient to meet peak demand for electricity
2) Power systems must have adequate flexibility to address variability and uncertainty in demand (load) and generation resources
3) Power systems must be able to maintain steady frequency
4) Power systems must be able to maintain voltage within an acceptable range.
Multiple “smart grid” projects seek to meet these challenges; however there are still obstacles they must overcome to achieve their goals (e.g., “The Role of Smart Grids in Integrating Renewable Energy” by the US National Renewable Energy Laboratory, and “Smart Grid: Status and Outlook” by the Congressional Research Service).
Profitability of the Battery Storage Revenue Model
Perhaps the most famous battery storage facility in the world is The Hornsdale Power Reserve in South Australia, more commonly known as the Big Tesla Battery.
Built in 2017, it can (before a planned expansion) deliver 129 Megawatt Hours of energy for about one hour.
70MW of its 100MW power is used for maintenance of frequency and voltage control (i.e., “grid stability”, or “Frequency Control and Ancilliary Services”, or FCAS).
30MW is used for “load shifting” – storing excess electricity generated by the adjacent wind farm, and sold for short periods into the market for a higher price during peak demand periods, in competition with gas peakers and other battery storage facilities.
Initially, provision of FCAS services was very profitable; however, as more battery storage facilities have opened competition has increased.
Moreover, so called “park spreads” from storing and reselling energy have been thin, due to both “round trip” efficiency losses (only about 80% of the originally generated energy can be resold to meet peak demand), and margin pressure due to competition from other peak suppliers (e.g., other battery storage operators and gas generators with excess capacity they can ramp up).
On the bright side, a recent review by the US Energy Information Administration (“Battery Storage in the United States: An Update on Market Trends”) identified a larger number of potential sources of revenue for battery storage operators:
• Frequency regulation helps balance momentary differences between electricity demand and supply within the transmission grid, often in order to help maintain interconnection frequencies close to 60 Hertz.
• Spinning reserve is the unused dispatchable generating capacity of online assets that provides grid frequency management, which may be available to use during a significant frequency disturbance, such as during an unexpected loss of generation capacity. This reserve ensures system operation and availability. Dispatchable generators are those that can be turned on or off in order to meet immediate needs of the system.
• Voltage or reactive power support ensures the quality of power delivered by maintaining the local voltage within specified limits by serving as a source or sink of reactive power (the portion of electricity that establishes and sustains the electric and magnetic fields of alternating‐current equipment).
• Load following supplies (discharges) or absorbs (charges) power to compensate for load variations—this application is a power balancing application, also known as a form of ramp rate control.
• System peak shaving reduces or defers the need to build new central generation capacity or purchase capacity in the wholesale electricity market, often during times of peak demand.
• Arbitrage occurs when batteries charge during periods when electrical energy is less expensive and discharge when prices for electricity are high, also referred to as electrical energy time‐shift.
• Load management provides a demand side customer‐related service, such as power quality, power reliability (grid‐connected or microgrid operation), retail electrical energy time‐shift, demand charge management, or renewable power consumption maximization (charging the battery storage system during periods when renewable energy is greatest so as to consume the maximum renewable energy from the battery system, i.e. charging with solar during the day or charging with wind during high wind periods).
• Storing excess wind and solar generation reduces the rate of change of the power output from a non‐dispatchable generator in order to comply with local grid requirements related to grid stability or prevent over production or over‐production penalties. Non-dispatchable generators cannot be turned on or off in order to meet immediate needs and are often intermittent resources (generators with output controlled by the natural variability of the energy source, for example wind and solar).
• Backup power, following a catastrophic failure of a grid, provides an active reserve of power and energy that can be used to energize transmission and distribution lines, provides start‐up power for generators, or provides a reference frequency.
• Transmission and distribution deferral keeps the loading of the transmission or distribution system equipment below a specified maximum. This application allows for delays in transmission upgrades, avoids the need to upgrade a transmission system completely, or avoids congestion‐related costs and charges.
• Co‐located generator firming provides constant output power over a certain period of time of a combined generator and energy storage system. Often the generator in this case is a nondispatchable renewable generator (for example, wind or solar).
Batteries’ Cost
The cost of battery storage has declined in recent years. Most recently, Lazard and Company estimated that the levelized cost of storage (LCOS, which includes associated costs beyond the battery itself) for a 100 MW battery that could delivery this power for four hours (i.e., that could deliver 400 Megawatt Hours of energy) is now between $189 and $325 per Megawatt Hour, without subsidies.
In comparison, a new combined cycle gas generating plant costs between $44 and $68 per Megawatt Hour.
In “Cost Projections for Utility-Scale Battery Storage”, NREL most optimistic case estimates that by 2030 the cost for a four-hour system could fall to $124 per Megawatt Hour ($207 middle case), and $76 per Megawatt Hour ($156 middle case) by 2050.
To put this in perspective, in March this year, Florian Mayr published an analysis of a recent solar plus storage deal in Arizona (“Battery storage at US$20/MWh? Breaking down low-cost solar-plus-storage PPAs in the USA”). After a masterful piece of financial analysis, he concluded that behind the deal’s complicated terms, the estimated cost of the storage was about $310, which he noted was “within the rage of aggressive, but realistic quotes we observe in the industry today.”
But that is in a state that has optimal conditions for solar plus storage installations. It is clear that the levelized cost of storage is going to have to come down much more to support more widespread deployment of this model.
Another aspect of the cost issue was highlighted in the aforementioned EIA report: “There are two major challenges in determining the profitability and cost of battery storage systems.
“First, quantifying the competitiveness of a battery storage technology with other technologies operating on the grid must consider the individual markets that the storage technology is planning to be used in and what revenue opportunities exist for the technology.
“The second challenge involves the degradation of the system over time, which is the lasting and continuous decrease in either a battery’s power or energy performance or both and is linked to use or age of a battery component or system.
“The performance can be characterized by the full cycle power input and output at an agreed‐upon charge/discharge rate. There are two general options that can be employed to ensure reliable performance during a storage system’s lifetime:
(1) Overbuilding: adding more storage or discharge capacity behind the inverter than is needed, so that as the system ages it will maintain a capacity at or above the contracted capacity required of the system.
(2) Continual Upgrades: replacing some portion of the storage system to maintain the agreed‐upon performance during its lifetime.
“The two approaches to meeting performance requirements affect the installed capital costs of the system. Overbuilding storage capacity leads to a higher initial installed capital cost, while continual upgrades lead to higher operation and maintenance costs throughout the lifetime of the storage facility. Therefore, comparing only the normalized capital cost of various battery systems, [as we have done in this analysis] does not capture the variation in the lifetime costs.”
Batteries’ Long Term Safety and Reliability
In “Why Is the Utility Industry Less Bullish on Grid-Scale Storage?”, Kavya Balaraman observed that, “In Utility Dive's 2020 State of the Electric Utility survey, 27% of participants said they expect their organization will significantly increase grid-scale battery storage in the next 10 years — a significant reduction from 37% in 2018, and 34% in 2019.”
Balaraman noted that, “Matthew Raiford, manager of the Consortium for Battery Innovation, a research organization focused on lead batteries, said that ‘there’s also the looming issue of safety — the last couple of years have witnessed some high-profile safety-related issues with battery storage, including an explosion at an Arizona Public Service facility last April and multiple storage-related fires in South Korea…I would venture to guess that over the next few years, there will be a refocusing in the market, looking at things like safety, reliability and the kind of technical economics of utilizing these systems’”.
Raiford’s quote is familiar to anyone who has tried to sell a new technology to a utility company. They are, quite rightly, very conservative customers. They know all-too-well that regulators and customers are risk averse, and that they face significant downside costs for self-inflicted errors. Despite the enthusiasm of battery storage supporters, don’t expect utilities and their regulators to jump n the bandwagon any time soon.
Batteries’ Use Of Rare Earth Minerals
Lithium-ion batteries are the most widely used technology in grid-scale storage today. However, their manufacture relies on continuing supplies of reasonably priced lithium, cobalt, and a number of rare-earth minerals.
In light of growing US-China tensions, the continuing supply of the rare-earths cannot be guaranteed. Moreover, supplies of both lithium and cobalt are highly concentrated in a small number of countries (e.g., the Democratic Republic of the Congo for cobalt).
A recent report by UNCTAD highlighted the risks this poses to the world battery industry (“Commodities at a Glance: Special Issue on Strategic Battery Raw Materials”).
How Climate Change Will Affect Future Solar Radiation And Wind
Another critical assumption that underlies Joe Biden’s green power vision is that climate change will not have a negative effect on current levels of solar radiation and wind.
There is evidence that this assumption is more uncertain that many people would acknowledge. For example, in the Northeast United States, since the 1950s available solar energy in the summer has decreased, as the warming Great Lakes have produced more clouds (see, “Examining the Climatology of Shortwave Radiation in the Northeast United States”, by Hanrahan et al).
And in “Southward Shift Of The Global Wind Energy Resource Under High Carbon Dioxide Emissions”, Karnauskas et al find that, “the use of wind energy resource is an integral part of many nations’ strategies towards realizing the carbon emissions reduction targets set forth in the Paris Agreement, and global installed wind power cumulative capacity has grown on average by 22% per year since 2006.
“However, assessments of wind energy resource are usually based on today’s climate, rather than taking into account that anthropogenic greenhouse gas emissions continue to modify the global atmospheric circulation.” The authors “apply an industry wind turbine power curve to simulations of high and low future emissions scenarios in an ensemble of ten fully coupled global climate models to investigate large-scale changes in wind power across the globe.”
Their “calculations reveal decreases in wind power across the Northern Hemisphere mid-latitudes and increases across the tropics and Southern Hemisphere, with substantial regional variations. The changes across the northern mid-latitudes are robust responses over time in both emissions scenarios, whereas the Southern Hemisphere changes appear critically sensitive to each individual emissions scenario…Established features of climate change can explain these patterns: polar amplification is implicated in the northern mid-latitude decrease in wind power, and enhanced land–sea thermal gradients account for the tropical and southern subtropical increases.”
Conclusion
Substantial greenhouse gas emissions reductions via widespread deployment of wind and solar power, battery storage, and the Smart Grid is a seductive vision that may very well win Joe Biden votes in this November’s election.
As a practical matter, however, it is based on six critical assumptions that are far more uncertain than its supporters acknowledge.
Even if the probability for each of them having their most optimistic outcome is 90% (a very optimistic estimate), their joint probability is only 53% (90% to the 6th power). If the individual probabilities fall to 80%, the joint probability declines to just 26%.
To answer the question we started with, no, Joe Biden’s goal of removing carbon from US electricity generation by 2035 is not realistic.
High Value Information Observed In July 2020
In our model of the complex global macro system, change drivers are arrayed across a roughly chronological process (albeit one with many feedback loops), in which technological and environmental changes precede changes in the economy and national security, which in turn lead to changes in society and politics, all of which produce the effects we observe in investor behavior and financial market valuations and returns.
In our methodology, we classify new information as significant and highly valuable if either it (1) is an “indicator”, which reduces our uncertainty about the value of a parameter in our mental model for making sense of the dynamic macro system, or (2) it is a “surprise” which increases our uncertainty about either the range of potential values for a parameter or the structure of our model. With respect to indicators, the higher our priori probability is for a regime, the more we look for indicators that it will not occur, and the lower our prior probability for a regime, the more we look for indicators that it will occur. Put differently, we tend to look for high value indicators that disconfirm our prior views.
| New Technology Information: Indicators and Surprises | Why Is This Information Valuable? |
| In July, OpenAI released GPT-3, the latest version of its natural language processing model, which has substantially improved performance over GPT-2 that was released last year. NLP is the subset of AI technologies that focuses on analyzing and generating human language – e.g., to answer questions posed by humans. | SURPRISE GPT-3 will enable many more creative and potentially disruptive applications of NLP. However, it is also important to keep in mind that GPT-3 is still based on associative, not causal or counterfactual reasoning. It excels at matching patterns (e.g., to answer questions or complete sentences), but does not actually comprehend the meaning of language or integrated it with existing knowledge to build and apply mental models of the real world in the way humans do. |
| New surveys from McKinsey and Deloitte on the state of AI adoption by businesses after COVID reached very similar conclusions | SURPRISE In “The Productivity J-Curve”, Brynjolfsson, Rock, and Syverson concluded that (as has been the case with previous general purpose technology innovations) substantial improvements in AI will only produce large productivity gains once companies have made substantial investments in intangibles, like improved employee knowledge and skills, and reconfigured processes and organizational structures. These two new reports are important indicators of the speed at which these changes are happening on the ground. In “Entering a New Decade of AI: The State of Play”, McKinsey finds that while growth in AI adoption is accelerating, “less than a third of companies that we surveyed have deployed AI in multiple businesses or functions.” The report highlights a familiar reason for this: “it’s hard work to deploy technology within an organization, not only because the technology problems are hard, but also because the change management is really hard.” McKinsey also noted that “frontier technologies” have not yet seen wide deployments. These include reinforcement learning and Generative Adversarial Networks (GANs). Also of note was McKinsey’s finding a significant gap between companies’ recognition of various AI related risks and their perceived ability to manage them today: “we asked respondents to identify which risks are relevant and then which risks they have mitigated. And across a certain set of risks—such as cybersecurity, explainability, regulatory compliance, and others—among all respondents we still see a significant delta between respondents who say their company has identified a relevant risk but then have successfully been able to mitigate it.” Finally, McKinsey found “more respondents than in the past year saying that there potentially could be a decrease in the size of their workforce for an individual company as a result of the deployment of AI.” In “Thriving in the Era of Pervasive AI”, Deloitte’s survey finds that “virtually all adopters are using AI to improve efficiency; mature adopters are also harnessing the technologies to boost differentiation.” However, “more respondents than in the past year saying that there potentially could be a decrease in the size of their workforce for an individual company as a result of the deployment of AI.” Like McKinsey, Deloitte also found a large gap between companies recognition of AI related risks and their perceived ability to manage them: “more respondents than in the past year saying that there potentially could be a decrease in the size of their workforce for an individual company as a result of the deployment of AI.” For example, while 54% of respondents cited “Making Bad Decisions Based on AI’s Recommendations” as a “major/extreme concern”, only 38% said they were prepared to manage it. Finally, 53% of respondents cited job losses related to AI as a “major/extreme concern”, but only 37% believed they were prepared to manage it. |
| “The Deck is Not Stacked: Poker and the Limits of AI”, Maria Konnikova | SURPRISE Konnikova begins by noting that, “the great game theorist John von Neumann viewed poker as the perfect model for human decision making, for finding the balance between skill and chance that accompanies our ever choice. He saw poker as the ultimate strategic challenge, combining as it does not just the mathematical elements of a game like chess, but the uniquely human, psychological angles that are more difficult to model precisely.” She goes on to describe the research of Carnegie Mellon professor Tuomas Sandholm, whose team has designed the two most effective poker playing AI’s, Libratus and Pluribus. Sandholm notes that his “goal isn’t to solve poker, as such, but to create algorithms whose decision making prowess in poker’s world of imperfect information and stochastic situations — situations that are randomly determined and unable to be predicted — can then be applied to other stochastic realms, like the military, business, government, cybersecurity, even health care.” Last year, Pluribus became the first AI to defeat multiple top ranked players (see, “Superhuman AI for Multiplayer Poker”, by Brown and Sandholm) Two of the Pluribus team’s innovations stand out. The first was its use of regret minimization as its objective function – e.g., how much better were the results from actions not chosen than the one that was. In humans, regret triggers powerful emotions that cloud our ability to learn from it. AI therefore learns faster from regret (see, “Stochastic Regret Minimization in Extensive Form Games” by Farina et al). The second was the development of an AI that could learn effective strategies by observing a game, without knowing its rules (see, “Efficient Exploration of Zero-Sum Stochastic Games” by Martin et al). While Pluribus’ achievement is extremely impressive, Konnikova concludes with a critical distinction: “real-life applications have to contend with something that a poker algorithm does not: the weights that are assigned to different elements of a decision” [e.g., to multiple competing goals]. If different players are pursuing different goals, or put different weights on them, and/or on different causal theories in a complex adaptive system (or both, as in “wicked problems”), then AI techniques are still insufficient. But as Pluribus shows, they are quickly improving. |
| “Standardising the Splinternet: How China’s technical standards could fragment the Internet”, by Hoffman et al | SURPRISE “China’s drive for technological dominance has resulted in a long-term, government-driven national strategy. This includes the creation of native technologies which reflect local policies and politics, micromanagement of the Internet from the top down, and the use of international standards development organisations (SDOs), such as the UN agency the International Telecommunication Union (ITU), to legitimize and protect these technologies in the global marketplace. “Alternate Internet technologies based on a new ‘decentralized Internet infrastructure’ are being developed in SDOs and marketed by Chinese companies. In a worst-case scenario, these alternate technologies and a suite of supporting standards could splinter the global Internet’s shared and ubiquitous architecture… “A fragmented network would introduce new challenges to cyber defence and could provide adversaries with a technical means to undermine norms, predictability and security of today’s cyberspace – which would also impact human rights and widen the digital divide.” |
| “Event Prediction in Big Data Era: A Systematic Survey” by Liang Zhao from Emory University | “Events are occurrences in specific locations, time, and semantics that nontrivially impact either our society or the nature, such as earthquakes, civil unrest, system failures, pandemics, and crimes. It is highly desirable to be able to anticipate the occurrence of such events in advance in order to reduce the potential social upheaval and damage caused. “Event prediction, which has traditionally been prohibitively challenging, is now becoming a viable option in the big data era and is thus experiencing rapid growth, also thanks to advances in high performance computers and new Artificial Intelligence techniques… “Due to the strong interdisciplinary nature of event prediction problems, most existing event prediction methods were initially designed to deal with specific application domains, though the techniques and evaluation procedures utilized are usually generalizable across different domains. However, it is imperative yet difficult to cross-reference the techniques across different domains, given the absence of a comprehensive literature survey for event prediction. "This paper aims to provide a systematic and comprehensive survey of the technologies, applications, and evaluations of event prediction in the big data era.” After providing a thorough overview, Zhang addresses remaining challenges in event prediction, including one that occurs across multiple AI applications: Judea Pearl’s familiar distinction between associational (e.g., correlation), causal, and counterfactual reasoning. “The ultimate purpose of event prediction is usually not just to anticipate the future, but to change it, for example by avoiding a system failure and flattening the curve of a disease outbreak. However, it is difficult for practitioners to determine how to act appropriately and implement effective policies [actions] in order to achieve the desired results in the future. This requires a capability that goes beyond simply predicting future events based on the current situation, requiring them instead to also take into account the new actions being taken in real time and then predict how they might influence the future. “One promising direction is the use of counterfactual event prediction that models what would have happened if different circumstances had occurred. Another related direction is prescriptive analysis where different actions can be merged into the prediction system and future results anticipated or optimized. Related works have been developed in few domains such as epidemiology. However, as yet these lack sufficient research in many other domains that will be needed if we are to develop generic frameworks that can benefit different domains.” |
| “Discovering Reinforcement Learning Algorithms”, by Oh et al from DeepMind and “MISIM: An End-to-End Neural Code Similarity System” by Ye et al from Intel Labs | SURPRISE These two papers both provide evidence of important advances in the automation of machine learning software development (known as “machine programming”). The DeepMind team notes that, “reinforcement learning (RL) has a clear objective: to maximise expected cumulative rewards (or average rewards), which is simple, yet general enough to capture many aspects of intelligence. Even though the objective of RL is simple, developing efficient algorithms to optimise such objective typically involves a tremendous research effort, from building theories to empirical investigations. “An appealing alternative approach is to automatically discover RL algorithms from data generated by interaction with a set of environments, which can be formulated as a meta-learning problem”… “Although there have been prior attempts at addressing this significant scientific challenge, it remains an open question whether it is feasible to discover alternatives to fundamental concepts of RL such as value functions and temporal-difference learning. “This paper introduces a new meta-learning approach that discovers an entire update rule which includes both ‘what to predict’ (e.g. value functions) and ‘how to learn from it’ (e.g. bootstrapping) by interacting with a set of environments.” The team from Intel notes that one challenge in machine programming has been “construction of accurate code similarity systems, which generally try to determine if two code snippets are semantically similar (i.e., having similar characteristics through some analysis). Accurate code similarity systems may assist in many programming tasks, such as code recommendation systems to improve programming development productivity, to automated bug detection and mitigation systems to improve programmer debugging productivity.” Their paper describes a substantial advance Intel has made in this area. |
| In the United States, the reopening of K-12 schools has become another polarized political conflict, with teachers unions issuing a long list of demands (e.g., no new COVID cases for 14 days) before they return to the classrooms. Unfortunately, there is little evidence of improvement in the weak approaches to remote learning that parents and students experienced in the spring. | Education is a critical “social technology.” In the absence of strong education system performance, talent shortages constrain the diffusion of new technologies. This contributes to winner take all dynamics in different industries, as well as to income inequality, as firms that attract the talent needed to adopt new technologies earn higher profits and pay employees more. However, slowed technology diffusion holds down the overall rate of productivity improvement and economic growth in the economy, which has negative implications for future levels of social and political conflict. The sudden shift to remote learning that COVID forced on schools resulted in substantial learning losses, which look likely to worse. Unfortunately, base rate data indicate that, in the absence of substantial change to the US education system, it is very unlikely that these learning losses will be made up (e.g., see “Catching Up to College and Career Readiness”, by ACT Inc., and “COVID-19 And Student Learning In The United States: The Hurt Could Last A Lifetime”, by McKinsey). |
| | |
| | |
| | |
| | |
| | |
| | |
| New Energy and Environment Information: Indicators and Surprises | Why Is This Information Valuable? |
| “Mines, Minerals, And Green Energy: A Reality Check”, by Mark Mills from Northwestern University | SURPRISE “As policymakers have shifted focus from pandemic challenges to economic recovery, infrastructure plans are once more being actively discussed, including those relating to energy. Green energy advocates are doubling down on pressure to continue, or even increase, the use of wind, solar power, and electric cars. Left out of the discussion is any serious consideration of the broad environmental and supply-chain implications of renewable energy… “All energy-producing machinery must be fabricated from materials extracted from the earth. No energy system, in short, is actually “renewable,” since all machines require the continual mining and processing of millions of tons of primary materials and the disposal of hardware that inevitably wears out. Compared with hydrocarbons, green machines entail, on average, a 10-fold increase in the quantities of materials extracted and processed to produce the same amount of energy… “Replacing hydrocarbons with green machines under current plans—never mind aspirations for far greater expansion—will vastly increase the mining of various critical minerals around the world. For example, a single electric car battery weighing 1,000 pounds requires extracting and processing some 500,000 pounds of materials… “Oil, natural gas, and coal are needed to produce the concrete, steel, plastics, and purified minerals used to build green machines. The energy equivalent of 100 barrels of oil is used in the processes to fabricate a single battery that can store the equivalent of one barrel of oil.” |
| “An Assessment Of Earth’s Climate Sensitivity Using Multiple Lines Of Evidence” by Sherwood et al | SURPRISE This interesting and potentially important paper evades a critical point: Achieving substantial emissions reductions, and thus slowing the rate of global warming, fundamentally depends on China’s willingness to adopt policies (like stopping construction of coal fired electric power generating plants) it has thus far refused to do. The authors note that, “the objective of this work is to analyze all important evidence relevant to climate sensitivity, and use that evidence to draw conclusions about the probabilities of various values of the sensitivity… “All observational evidence must be interpreted using some type of model that relates underlying quantities to observables, hence there is no such thing as a purely observational estimate of climate sensitivity. "Uncertainty associated with any evidence therefore comes from three sources: (1) observational uncertainty, (2) potential model error, and (3) unknown influences on the evidence such as unpredictable variability (which may or may not be accounted for in one’s model)… “Earth’s global “climate sensitivity” is a fundamental quantitative measure of the susceptibility of Earth’s climate to human influence. A landmark report in 1979 concluded that it probably lies between 1.5-4.5℃ per doubling of atmospheric carbon dioxide, assuming that other influences on climate remain unchanged. In the 40 years since, it has appeared difficult to reduce this uncertainty range. "In this report we thoroughly assess all lines of evidence including some new developments…We find that a large volume of consistent evidence now points to a more confident view of a climate sensitivity near the middle or upper part of this range. In particular, it now appears extremely unlikely that the climate sensitivity could be low enough to avoid substantial climate change (well in excess of 2℃ warming) under a high-emissions future scenario. “We remain unable to rule out that the sensitivity could be above 4.5℃ per doubling of carbon dioxide levels, although this is not likely. Continued research is needed to further reduce the uncertainty and we identify some of the more promising possibilities in this regard.” |
| “Housing Market Value Impairment from Future Sea-Level Rise Inundation”, by Rodziewicz et al from Federal Reserve Bank of Kansas City | The next two papers highlight the way too much climate research is spun to generate headlines and clicks, and not to help decision makers dispassionately weigh evidence. When it comes to climate research, critical reading is a must. “The rate of future global sea-level rise will likely increase due to elevated ocean temperatures and increases in land-ice melt. Nearly 40 percent of the U.S. population lives in coastal communities, and coastal properties are expected to become more prone to coastal flooding in the coming decades due to relative sea-level rise caused by both global and local factors. Understanding how this projected sea-level rise translates to lost economic value is critical to the decisions of insurance companies, banks, governments, investors, and regulatory agencies.” The authors “estimate a range of housing market value impairments from future sea-level rise in 15 major U.S. coastal cities as well as the associated timing of those impairments. Our estimates include only residential properties with four or fewer units and thus provide a lower bound estimate of economic risk from sea-level rise." They "estimate that within these 15 major U.S. coastal metros, sea-level rise will inundate between 2,000 and 28,000 properties by 2100 in a relatively low greenhouse gas concentration scenario and between 7,000 to 77,000 properties under an unlikely, extreme greenhouse gas concentration scenario. These estimates equate to direct economic losses between $0.1 to $1.8 billion under the low green- house gas scenario and $3.8 to $50.6 billion under the high scenario.” To put these estimated losses into perspective, in 2019 the estimated total value of US residential real estate was $33.6 trillion according to Zillow.com |
| “Projections of global-scale extreme sea levels and resulting episodic coastal flooding over the 21st Century”, by Kirezci et al | In the last month, this new paper received much more sensational (and uncritical) media attention than the one just discussed above. However, a careful read uncovers two critical points: First, it is based on the IPCC’s most extreme high emissions scenario (RCP 8.5), which assumes an average global temperature increase of 3.2 to 5.4 degrees centigrade. Second, it (implausibly) assumes “no coastal protection or adaptation.” Unsurprisingly, the results are grim: “there will be an increase of 48% of the world’s land area, 52% of the global population and 46% of global assets at risk of flooding by 2100. A total of 68% of the global coastal area flooded will be caused by tide and storm events with 32% due to projected regional sea level rise.” |
| | |
| | |
| | |
| | |
| | |
| | |
| | |
| | |
| | |
| New Economic Information: Indicators and Surprises | Why Is This Information Valuable? |
| The nations of the European Union finally reached a compromise and agreed a 750 billion Euro stimulus plan. However, the plan still must be approved by the European Parliament, which could force further changes in it. | While the north/south tensions that delayed agreement still remain, and there are concerns that southern nations will receive a disproportionate share of the bailout funds, the agreement led to a significant increase in the Euro XR versus the US dollar (which was also helped by a worsening COVID situation and political stalemate over another federal fiscal support bill in the US). Funds will be allocated on the basis of the relative economic harm COVID is estimated to have caused different countries. Critically, receipt of these funds will be linked to a country’s commitment to enact policy reforms. Funding may be blocked if a national government objects that another government is not implementing these reforms (with the EU Commission having the final say). Reflecting concern about eroding democracy in Hungary and Poland, a weighted majority of governments can also block disbursement of funds to nations not following “rule of law principles”. Over a longer time horizon, the issuance of 750 billion Euro in EU debt will accelerate the development of Euro capital market, and make it a more viable competitor to the US dollar. On the other hand, the weak provisions for countries’ obligations to contribute to repayment of these new EU bonds will, we expect, gradually be recognized, and cause investors to demand a relatively higher yield on them than they would on US Treasuries. Increasing economic problems in Italy in Spain, including any difficulties they have at rolling over their outstanding government debts will hasten this recognition. |
| In the United States, even as Congressional Democrats and Republicans remained deadlocked over the contents of a second fiscal package to support the economy, concerns continued to be voiced about the sustainability of mounting fiscal deficits that are largely being monetized by the Federal Reserve. | The essence of the problem is that a substantial increase in productivity is needed for the US to service a much higher level of debt without requiring some combination of extended (and politically destabilizing) austerity, inflation, and/or extensive debt restructuring. However a sustained increase in productivity will have to overcome many headwinds. In the short term, a number of factors will likely depress the size of the fiscal multiplier – the amount of GDP growth produced by each dollar of government deficit spending. These include high levels of inequality and private sector indebtedness, as well as an aging population. In the medium term, barriers to higher productivity growth include aging population and poorly performing education system, that fails to produce enough talent to support the diffusion of new technologies (e.g., robotics and artificial intelligence) beyond a limited number of increasingly dominant superstar firms in many industries. The extensive learning losses that many of America’s 57 million K-12 students have experienced due to COVID will only make this worse. Unfortunately, if the past ten years are any guide, most students will fail to make them up (for base case data see, “Catching Up to College and Career Readiness” by ACT Inc.). Uncertainties about America’s future growth potential has led to rising concerns about the possibility of a substantial increase in inflation at some point in the future. |
| The price of gold continued to increase in July. | Lacking increased gold demand for jewelry or industrial uses, this price increase logically reflected a combination of negative rates on US Treasury and other high quality sovereign debt, rising fears about future inflation, and growing concern about key currencies (the Euro and especially the US Dollar) as safe haven assets. Negative yields on sovereign debt are unattractive because the holder is guaranteed to lose money if the bond is held to maturity, and will lose even more if interest rates rise (which would cause bond prices to fall). Bank deposits still offer a small positive return, and gold has upside potential if uncertainty increases (which would likely cause US Treasury yields to become even more negative). With respect to inflation, we continue to believe that (as you can see in this month’s regime forecast) a sharp increase is not likely over the next 12 months. That leaves rising demand for gold driven by increasing uncertainty about the political stability in the United States, which is not unfounded, given the street rioting investors have watched, still rising rates of COVID infection, and growing concerns about whether President Trump may attempt to disrupt the November election or leave office if he is defeated. |
| In July, further evidence emerged about the structural changes underway in the economy. | SURPRISE In “US small-business recovery after the COVID-19 crisis”, McKinsey finds that, “After the 2008 recession, larger companies recovered to their pre-crisis contribution to GDP in an average of four years, while smaller ones took an average of six…[After the COVID shock], across all businesses, recovery could take five years or longer under two scenarios that McKinsey Global Institute and Oxford Economics have modeled and that more than half of global executives surveyed see as the most likely to unfold Among small businesses, recovery is again likely to take even longer. Many may never reopen.” In just one sector, Sharpe and Querolo from Bloomberg forecast that “One-Third of U.S. Restaurants Face Permanent Closure This Year”…” showing how the Covid-19 pandemic is decimating an industry that employs millions of Americans.” In “The Great Acceleration”, McKinsey notes that, “The fault lines between industries and business models that we understood intellectually before the COVID-19 crisis have now become giant fissures, separating the old reality from the new one. Just as an earthquake produces a sudden release of pent-up force, the economic shock set off by the pandemic has accelerated and intensified trends that were already underway. The result is a dramatic widening of the gap between those at the top and the bottom of the power curve of economic profit — the winners and losers in the global corporate performance race.” Similarly, in “The “New Normal” Is a Myth. The Future Won’t Be Normal at All”, Bain & Company observes that, “The lessons companies learned in the months after the outbreak were profound. Virtual, digital and automation initiatives, for both customer interactions and internal operations, accelerated at astonishing speed. Supply chains ruptured across the globe, signaling that companies have for too long sacrificed resilience for efficiency… Digital roadmaps once measured in years accelerated rapidly in days and quickly proved their worth… A recent Bain survey of IT buyers shows that more than 80% of companies are accelerating their automation initiatives in response to Covid-19.” The implications of this trend for future levels of social and political conflict are an important cause for concern, including David Autor and Elizabeth Reynolds’ warning in their paper, “The Nature of Work after the COVID Crisis: Too Few Low-Wage Jobs.” They note that, “the COVID crisis has shaken our core confidence that the U.S. labor market, caught between the demographic pincers of a swelling retiree population and a flagging fertility rate, would almost inevitably experience structurally tight labor markets for many years to come.” “No one foresaw that a global pandemic would spur an overnight revolution in telepresence that may upend commuting patterns and business travel, and hence dent demand in rapidly growing—though never highly paid—personal service occupations… As to whether these developments mean that the U.S. labor market will continue to deliver negligible—or perhaps as to whether these developments mean that the U.S. labor market will continue to deliver negligible— or perhaps negative—earnings gains for the typical U.S. worker… On its current trajectory, the unfortunate answer is likely yes.” |
| Evidence is accumulating that a substantial increase in debt restructurings lies ahead. | In the Financial Times, John Dizard warned that, “Hope Will Not Save US Commercial Properties.” “Commercial real estate will have to be entirely restructured in the US…The problem is most obvious for retailers, joined by the hoteliers. And in just a few more months, we will find out how many offices will be cut back by the work from home phenomenon. Will the offices be 80 per cent occupied? Or 50 per cent?” Writing elsewhere in the FT, Mohamed El-Erian, warned that, “Investors Must Prepare Portfolios for COVID-19 Debt Crunch.” “The financial stress caused by Covid-19 is far from over. Investors should brace for non-payments to spread far beyond the most vulnerable corporate and sovereign borrowers, in a reckoning that threatens to drag prices lower”… “There are already plenty of worrying signs: a record-breaking pace for corporate bankruptcies; job losses moving from small and medium-sized firms to larger ones; lengthening delays in commercial real estate payments; more households falling behind on rents and continuing to defer credit card payments; and a handful of developing countries delaying debt payments.” Finally, in “Firms, Failures, and Fluctuations: The Macroeconomics of Supply Chain Disruptions”, Acegmolu and Tahbaz-Salehi show how in today’s economy extended supply chains can amplify the negative aggregate impact of individual firm failures. The prospective impact of a rapid increase in bankruptcies on future social and political conflict is a matter for serious concern, particularly if they are handled poorly – which in this case likely means the same way they have always been handled. I have clearly in mind a prophetic 2012 article by Matt Stoller, “The Housing Crash and the End of American Citizenship.” He noted that, “much as divorce became a culturally common activity in the 1960s, [after the 2008 crash] the rise of a foreclosure epidemic has made the loss of a home a searing but familiar experience for tens of millions of Americans.” Stoller’s thesis was that, “this wave of foreclosures signals the end of an older social contract and the beginning of a period of deep political and economic instability. The crash of the housing market radically altered the wealth and power distribution mechanisms for the American political order.” This was written four years before Donald Trump’s election in 2016. A similar wipeout of America’s small businesses could have a similar, and similarly unpredictable, effect. |
| While the US is reporting increases in COVID-19 cases, and Europe’s economy appears to be recovering, the FT’s Jamil Anderlini reports that “Behind the Recovery, China’s Economy is Wobbling.” | Thus far, China’s economic rebound has only been “achieved with Herculean effort from an interventionist state falling back on the same tools it has relied on since the financial crisis of 2008. “Even before the first virus cases were discovered in Wuhan, the economy was struggling with massive over-investment, particularly in redundant real estate projects, mounting bad debt, growing dominance of inefficient state enterprises and chronic under-consumption. “The government’s response to the collapse of growth in the first quarter has exacerbated all these problems. “Financial regulators are warning of a flood of new bad loans and a surge in unregulated shadow banking even as Beijing opens the credit floodgates to get the economy moving again. “The build-up of debt in the economy in the aftermath of the 2008 crisis was the fastest and biggest in history and the pace has accelerated to record highs since the start of the pandemic. “Despite years of official rhetoric on the need to create a consumer economy and reduce reliance on investment as the main driver of growth, China’s household consumption as a percentage of gross domestic product remains extraordinarily low — less than 40 per cent… “That has prompted Beijing to boost growth through debt-fuelled investment, as it did in the wake of the global financial crisis. Once again, the drive has been led by investment in infrastructure and real estate, and it has been dominated by the sclerotic state-owned sector… “As the virus continues to rage across much of the world and as relations with the US and other important trade partners worsen dramatically, China’s leaders have clearly decided to revive the old strategy of debt-fuelled, state-dominated investment. “A decade ago, some economists liked to describe the Chinese economy as a bicycle that needed to maintain a certain speed or it would tip over and crash. Today it is more like a bicycle laden with enormous boxes of debt, ridden by a drunk and with strategic competitors such as the US trying to knock it over.” |
| | |
| | |
| | |
| | |
| | |
| | |
| | |
| | |
| | |
| | |
| | |
| | |
| | |
| New National Security Information: Indicators and Surprises | Why Is This Information Valuable? |
| “How Iran’s Oil Infrastructure Gambit Could Imperil The Strait Of Hormuz”, by Ewers and Tabatabai | SURPRISE “For decades, Iran has threatened repeatedly to obstruct naval traffic and disrupt the global energy market in the Strait of Hormuz. These threats had rung hollow for the most part — until now… “On June 25, Iran’s President Hassan Rouhani announced a possible game-changer — that by March 2021, his country would upgrade its energy infrastructure to bypass entirely the Strait of Hormuz when it exports its oil. These upgrades would include a new pipeline and port facilities in the southern coast bordering the Gulf of Oman. “And the recently announced comprehensive between Iran and China, a 25-year agreement that would cover energy, infrastructure, and military cooperation among other things, appears to stipulate the development of parts of this plan with support from Beijing. “The deal also provides for the development of a new port that would rest comfortably in Chinese control. “Rouhani’s ambitious new plan would allow Iran to close the Strait of Hormuz without losing its ability to export oil and forfeiting corresponding revenues… “Through this action, which seems to have been missed by many in the United States, Iran may be signaling its calculus is changing.” |
| “China’s Grand Strategy”, by Scobell et al from RAND | SURPRISE “To explore what extended competition between the United States and China might entail through the year 2050, this report focuses on identifying and characterizing China’s grand strategy, analyzing its component national strategies (diplomacy, economics, science and technology [S&T], and military affairs), and assessing how successful China might be at implementing these over the next three decades. “Foundational prerequisites for successful implementation of China’s grand strategy are deft routine management of the political system and effective maintenance of social stability. “China’s grand strategy is best labeled “national rejuvenation,” and its central goals are to produce a China that is well governed, socially stable, economically prosperous, technologically advanced, and militarily powerful by 2050. “China’s Communist Party rulers are pursuing a set of extremely ambitious long-term national strategies in pursuit of the overarching goals of their grand strategy… The report includes four scenarios for what China might look like in 2050: “1. Triumphant China, in which Beijing is remarkably successful in realizing its grand strategy 2. Ascendant China, in which Beijing is successful in achieving many, but not all, of the goals of its grand strategy 3. Stagnant China, in which Beijing has failed to achieve its long-term goals 4. Imploding China, in which Beijing is besieged by a multitude of problems that threaten the existence of the communist regime.” The authors conclude the scenarios #2 and #3 are the most likely. |
| “China is Done Biding Its Time”, by Campbell and Rapp-Hooper | SURPRISE “Over the course of the novel coronavirus crisis, analysts have watched relations between the United States and China spiral to a historic nadir, with scant hope of recovery. There are many reasons for the slide, but Beijing, in a striking departure from its own diplomatic track record, has been taking a much harder line than usual on the international stage—so much so, that even the most seasoned observers are wondering whether China’s foreign policy has fundamentally changed”… “As COVID-19 has ravaged the globe, Chinese President Xi Jinping has appeared to defy many of his country’s long-held foreign policy principles all at once… It has tightened its grip over Hong Kong, ratcheted up tensions in the South China Sea, unleashed a diplomatic pressure campaign against Australia, used fatal force in a border dispute with India, and grown more vocal in its criticism of Western liberal democracies… “It is too early to tell with certainty, but China— imbued with crisis-stoked nationalism, confident in its continued rise, and willing to court far more risk than in the past—may well be in the middle of a foreign policy rethink that will reverberate around the world.” |
| “People Win Wars: The PLA Enlisted Force and Other Related Matters”, by Clay and Blasko | SURPRISE The authors review recent initiatives to modernize China’s People’s Liberation Army, and conclude that its conscripted enlisted force remains a weak link. |
| The latest PEW Research poll finds that a record high 73% of Americans have an unfavorable opinion of China (68% of Democrats, and 83% of Republicans), up from just 29% in 2006. 77% of Americans have no confidence in Xi Jinping to do the right thing in world affairs. 73% (78% of Democrats and 70% of Republicans) say the United States should promote human rights in China, even if it harms bilateral economic relations. | It is very unlikely that US policy towards China will change very much if Biden is elected president, both because of widespread agreement across party lines and because Xi Jinping seems unlikely to change his approach if Biden is elected. See also, “Would Biden’s foreign policy really be much different from Trump’s?”, by Danielle Pletka from AEI |
| “The Quad is Poised to Become Openly Anti-China Soon”, by Derek Grossman from RAND | “One of the most heavily scrutinized aspects of the Donald Trump administration's Indo-Pacific Strategy is the role played by the Quadrilateral Security Dialogue, or “Quad,” comprised of Australia, India, Japan, and the United States. “Since the Quad's resurrection from a decade-long hiatus in November 2017, the group has met five times and has emphasized maintaining the liberal rules-based international order, which China seeks to undermine or overturn… “What has been striking about the Quad thus far, however, is that it has resisted openly identifying China as the primary target it seeks to rein in. “This is not a trivial issue as the first iteration of the Quad, in 2007, fell apart largely because Australia and to some extent India got cold feet over how much to push China without impacting other dimensions of their bilateral relationships with Beijing. “Thus, if the Quad is to be sustained this time around, it will likely have to come to grips with a forward-leaning approach to opposing Chinese activities throughout the region. Just one defection to a softer line on China could easily spell doom for the Quad all over again. At least for now, this go around appears to be different. For the first time in the Quad's history, the stars are aligning for a harder line on China, and the implications going forward could be significant.” |
| | |
| | |
| | |
| | |
| | |
| | |
| | |
| | |
| New Health and Disease Information: Indicators and Surprises | Why Is This Information Valuable? |
| “The implications of silent transmission for the control of COVID-19 outbreaks”, by Moghadas et al | SURPRISE The authors estimate that “the majority of incidences may be attributable to silent transmission from a combination of the presymptomatic stage and asymptomatic infections.” “Consequently, even if all symptomatic cases are isolated, a vast outbreak may nonetheless unfold. We further quantified the effect of isolating silent infections in addition to symptomatic cases, finding that over one-third of silent infections must be isolated to suppress a future outbreak below 1% of the population.” This implies that, in the absence of an effective and widely deployed coronavirus vaccine, in-home testing (or improved wearable sensor technology) that quickly identifies people infected with the virus will be critical to its long-term control. So too is control of potential superspreading events, which raises the subjects of aerosol based transmission of SARS-CoV-2 and indoor air quality. |
| There has been increasing debate over whether and to what extent SARS-CoV-2 is being transmitted via aerosols | SURPRISE In “Airborne Transmission of of SARS-CoV-2 Theoretical Considerations and Available Evidence”, Klompas et al note that, “The coronavirus disease 2019 (COVID-19) pandemic has reawakened the long-standing debate about the extent to which common respiratory viruses, including the severe acute respiratory syndrome coronavirus2 (SARSCoV-2), are transmitted via respiratory droplets vs aerosols. Droplets are classically described as larger entities (>5μm) that rapidly drop to the ground by force of gravity, typically within 3 to 6 feet of the source person. “Aerosols are smaller particles (<5 μm) that rapidly evaporate in the air, leaving behind droplet nuclei that are small enough and light enough to remain suspended in the air for hours (analogous to pollen). “Determining whether droplets or aerosols predominate in the transmission of SARS-CoV-2 has critical implications”… “Investigators have demonstrated that speaking and coughing produce a mixture of both droplets and aerosols in a range of sizes, that these secretions can travel together for up to 27 feet, that it is feasible forSARS-CoV-2 to remain suspended in the air and viable for hours, that SARS-CoV-2 RNA can be recovered from air samples in hospitals, and that poor ventilation prolongs the amount of time that aerosols remain airborne. “Many of these same characteristics have previously been demonstrated for influenza and other common respiratory viruses. These data provide a useful theoretical framework for possible aerosol-based transmission for SARS-CoV-2, but what is less clear is the extent to which these characteristics lead to infections. “Demonstrating that speaking and coughing can generate aerosols or that it is possible to recover viral RNA from air does not prove aerosol-based transmission; infection depends as well on the route of exposure, the size of inoculum, the duration of exposure, and host defenses. “Notwithstanding the experimental data suggesting the possibility of aerosol-based transmission, the data on infection rates and transmissions in populations during normal daily life are difficult to reconcile with long-range aerosol-based transmission. “First, the reproduction number for COVID-19 before measures were taken to mitigate its spread was estimated to be about 2.5, meaning that each person withCOVID-19 infected an average of 2 to 3 other people. This reproduction number is similar to influenza and quite different from that of viruses that are well known to spread via aerosols such as measles, which has a reproduction number closer to 18. “Considering that most people with COVID-19 are contagious for about 1week, a reproduction number of 2 to 3 is quite small given the large number of interactions, crowds, and personal contacts that most people have under normal circumstances within a 7-day period. “Either the amount of SARSCoV-2 required to cause infection is much larger than measles or aerosols are not the dominant mode of transmission. “Similarly, the secondary attack rate for SARS-CoV-2 is low. Case series that have evaluated close contacts of patients with confirmedCOVID-19 have reported that only about 5% of contacts become infected. “However, even this low attack rate is not spread evenly among close contacts but varies depending on the duration and intensity of contact. The risk is highest among household members, in whom transmission rates range between 10% and 40%. Close but less sustained contact such as sharing a meal is associated with a secondary attack rate of about 7%, whereas passing interactions among people shopping is associated with a secondary attack rate of 0.6%... “This pattern seems more consistent with secretions that fall rapidly to the ground within a narrow radius of the infected person rather than with virus-laden aerosols that remain suspended in the air at face level for hours where they can be inhaled by anyone in the vicinity. “An exception may be prolonged exposure to an infected person in a poorly ventilated space that allows otherwise insignificant amounts of virus-laden aerosols to accumulate [as in the case of almost all documented superspreader events]… “All told, current understanding about SARS-CoV-2 transmission is still limited. There are no perfect experimental data proving or disproving droplet vs. aerosol-based transmission of SARSCoV- 2. The balance of evidence, however, seems inconsistent with aerosol-based transmission of SARS-CoV-2 particularly in well-ventilated spaces.” |
| The debate over aerosol transmission, and the reopening of the economy, has increased the focus on indoor air quality | In “How to Make Indoor Air Safer”, Kaleigh Rogers finds that, “When people are outside, aerosol transmission is less of a concern because in wide-open spaces, these particles are quickly dispersed and diluted, making it difficult for an infectious concentration to accumulate.” Indoors, “you can achieve an air change by one of two ways…The first is “through the gross changeout of air, bringing in outside air and exhausting air from the room. Or you can achieve it by using high-efficiency filters that effectively remove virus-containing particles from the air”… “Guidelines from the Centers for Disease Control and Prevention, which were published before the COVID-19 pandemic, outline exactly what standards buildings need to have to achieve “airborne infection isolation,” which means stopping the spread of aerosols smaller than 5 microns. “At a minimum, buildings need to be reaching six air changes per hour, according to these CDC guidelines…The average commercial building now only performs one or two air changes per hour, and could squeeze in another with an air filtration system. The other four and a half or five air changes per hour, you’re really going to have to rely on in-room, stand-alone, HEPA filter air cleaners.” However, in “Why Aren’t We Talking About Ventilation”, Zeynep Tufekci concludes that, “six months into a respiratory pandemic, we are still doing little to mitigate airborne transmission.” See also, “Can HVAC systems help prevent transmission of COVID-19?” by McKinsey & Company |
| “US lab giant warns of new Covid-19 testing crunch in autumn”, by David Crow in the Financial Times | SURPRISE “The largest laboratory company in the US has warned it will be impossible to increase coronavirus testing capacity to cope with demand during the autumn flu season, in a sign that crippling delays will continue to hamper the US response to the pandemic.” James Davis, from Quest Diagnostics, is quoted as saying that, “it will be impossible to increase coronavirus testing capacity to cope with demand during the autumn flu season… but it’s not the labs that are the bottleneck. [It] is our ability to get physical machines and, more importantly, our ability to feed those machines with chemical reagents.” A separate analysis by Reuters concluded that, “public health officials are not addressing this core supply-chain problem” (“The U.S. has more COVID-19 testing than most. So why is it falling so short?”). |
| Two new analyses find that the importance of population heterogeneity to COVID spread and the threshold required for herd immunity has been underestimated. | SURPRISE This new research implies that we may be closer to a downward turn in the pandemic than previously believed. In “Persistent Heterogeneity Not Short-Term Overdispersion Determines Herd Immunity To COVID-19”, Tkachenko et al observe that, “It has become increasingly clear that the COVID-19 epidemic is characterized by overdispersion whereby the majority of the transmission is driven by a minority of infected individuals. “Such a strong departure from the homogeneity assumptions of traditional models is usually hypothesized to be the result of short-term super-spreader events, such as an individual’s extreme rate of virus shedding at the peak of infectivity while attending a large gathering without appropriate mitigation. “However, heterogeneity can also arise through long-term, or persistent variations in individual susceptibility or infectivity.” Most existing epidemiological models (e.g., Susceptible-Infected-Recovered) assume a homogenous population composed of identical individuals. When a model assumes a heterogenous population (e.g., in which individuals differ in terms of the strength of their immune system, their propensity to socialize, and the size of the contact networks with which they have regular interactions), the important new effects are observed. “Persistent heterogeneity has three important consequences compared to the effects of overdispersion: (1) It results in a major modification of the early epidemic dynamics; (2) It significantly suppresses the herd immunity threshold; (3) It significantly reduces the final size of the epidemic.” In “Power-Law Population Heterogeneity Governs Epidemic Waves”, Neipel et al examine German data and also “find that in strongly heterogeneous populations the epidemic reaches only a small fraction of the population. This implies that the herd immunity level can be much lower than in commonly used models with homogeneous populations.” |
| | |
| | |
| | |
| | |
| | |
| | |
| New Social Information: Indicators and Surprises | Why Is This Information Valuable? |
| “Fertility, mortality, migration, and population scenarios for 195 countries and territories from 2017 to 2100: a forecasting analysis for the Global Burden of Disease Study”, by Vollset et al | SURPRISE This study provides country level scenarios and estimates of coming population declines. For example, “if global labour force participation by age and sex remains the same from 2017 to 2100, the ratio of the non-working adult population to the working population might reach 1·16 globally, up from 0·80 in 2017… These population shifts have economic and fiscal consequences that will be extremely challenging.” As the authors note, “responding to sustained low fertility is likely to become an overriding policy concern in many nations given the economic, social, environmental, and geopolitical consequences of low birth rates.” |
| “Social Capital: Why We Need It and How We Can Create More of It”, by Isabel Sawhill from Brookings | “Formal institutions, such as government and markets, require an underpinning of more informal relationships that enable them to function. Without a certain degree of social trust, without norms of appropriate vs. inappropriate behavior, without strong institutions that uphold unifying and transcendent values, neither democracy nor the economy will flourish. Social capital, in short, is the glue that makes a society work. But it is not the panacea that some suggest. It is only in concert with good government, and a more inclusive prosperity, that it can address what ails America. “Social capital is a somewhat amorphous and academic term, but the literature suggests that the decline in trust in others, in strong relationships, and in community ties is one reason that Trump was elected, one reason that our health and longevity have been deteriorating, and one reason that economic growth has slowed. “What has gone wrong? The formation of character and the creation of prosocial norms depend on how families raise their children, how schools educate them, and how local institutions work to build a sense of community. All three of these institutions are now faltering.” |
| “The Demise of the Happy Two Parent Family Home”, by the US Congress Joint Economic Committee | The JEC has continued its multiyear research into social capital in the United States with this new report. “As sources of valuable social capital, few relationships are as important as the family ties between parents and children. However, as with other features of our associational life, family ties have been weakening for several decades. Today, around 45 percent of American children spend some time without a biological parent by late adolescence. That is up from around one-third of children born in the 1960s and one-fifth to one-quarter born in the 1950s. “Even more strikingly, among the most disadvantaged socioeconomic groups, even fewer children are raised in continuously intact families. Single parenthood is experienced by two-thirds of the children of mothers with less than a high school education and by eighty percent of black children. This inequality in family stability contributes to but also compounds economic inequality.” |
| “Social Bonds are Fraying Fast in America’s Cities”, by Samuel Abrams | SURPRISE “The social fabric in our cities is not only rapidly breaking down, but the pandemic has also accelerated American’s interest in leaving cities for places where geography enables social bonds with others to be stronger. "Before the pandemic, for instance, data collected by my colleagues and me at AEI revealed that 56 percent of urbanites stated that they knew their neighbors well. That figure has dropped to just 47 percent since the coronavirus appeared. "In contrast, suburban areas— places traditionally considered desolate and isolated but with spaces to connect and be physically distanced—saw small sociability increases with coronavirus, with a 4 point bump from 48 percent to 52 percent. Rural areas have seen no real change, with almost two-thirds of rural residents stating they know their neighbors well… “In urban areas, 42 percent of Americans state that they have been lonely a few times a week, nearly every day, or every day. This drops to 32 percent and 33 percent, respectively, for both suburban and rural areas and measures about depression are almost identical… “Two years ago, Gallup found that Americans pined for green and open skies; 29 percent of Americans wished to live in large and small cities but the lion’s share wanted to be away: 27 percent longed for a rural area and the remaining 43 percent were wishing for a small towns or suburbs if they could live anywhere in the United States. “The AEI data collected in the midst of the pandemic reveals that this desire to leave urban areas both big and small has accelerated with only 13 percent of Americans wanting to live in a city if they could live anywhere today. In contrast, 58 percent of Americans want to live in either a suburban area or a small town, and another 28 percent wanted a rural area. The turn away from cities is a 55 percent drop from 2018.” |
| Multiple new studies have found that areas with higher levels of social capital had greater compliance with quarantine, physical distancing and mask wearing recommendations, and experienced lower rates of COVID infections. | SURPRISE For example, in “Ties That Bind (and Social Distance): How Social Capital Helps Communities Weather the COVID-19 Pandemic”, Makridis and Wu find that, “on one hand, higher social capital could imply greater in-person interaction and risk of contagion. On the other hand, because social capital is associated with greater trust and relationships within a community, it could endow individuals with a greater concern for others, thereby leading to more hygienic practices and social distancing. “Our results suggest that moving a US county from the 25th to the 75th percentile of the distribution of social capital would lead to a 20% decline in the number of infections, as well as a 0.28 percentage point decline in the growth rate of the virus (nearly 20% of the median growth rate).” Similarly, using European data, Bartscher et al find that, “areas with high social capital registered between 12% and 32% fewer Covid-19 cases from mid-March until mid-May” (“The role of social capital in the spread of Covid-19”) |
| “Who Voted for Trump? Populism and Social Capital”, by Giuliano and Wacziarg | SURPRISE The authors argue that, “low levels of social capital are conducive to the electoral success of populist movements. Using a variety of data sources for the 2016 US Presidential election at the county and individual levels, [they] show that social capital, measured either by the density of memberships in civic, religious and sports organizations or by generalized trust, is significantly negatively correlated with the vote share and favorability rating of Donald Trump around the time of the election.” |
| “How The Pandemic Could Force a Generation of Mothers Out of The Workforce”, by Paine and Thomson-DeVeaux | SURPRISE “Studies have shown that women already shoulder much of the burden of caring for and educating their children at home; now, they’re also more likely than men to have lost their jobs thanks to the pandemic. And the collapse of the child care and public education infrastructure that so many parents rely on will only magnify these problems, even pushing some women out of the labor force entirely.” |
| “Twenty-Seven-Year Time Trends In Dementia Incidence In Europe And The United States”, by Wolters et al | SURPRISE This is good news: Rates of dementia appear to be falling, which in the future will reduce the burdens on patients’ families and health system costs. “An estimated 47 million people worldwide are living with dementia, making it a leading cause of dependence and disability. Because of rapid aging of the population, the number of people living with dementia is projected to triple in the next 30 years, and the socioeconomic burden of dementia to increase accordingly. “The projected burden of dementia could be alleviated if improvements in life conditions and health care over the last decades have decreased dementia risk.” Examining multiple studies from Europe and the United States, the authors find that, “Of 49,202 individuals, 4,253 (8.6%) developed dementia. The incidence rate of dementia increased with age, similarly for women and men, ranging from about 4 per 1,000 person-years in individuals aged 65–69 years to 65 per 1,000 person-years for those aged 85–89 years. “The incidence rate of dementia declined by 13% per calendar decade (95% confidence interval [CI], 7%–19%), consistently across studies, and somewhat more pronouncedly in men than in women (24% [95% CI 14%–32%] vs. 8% [0%–15%])… “If we assume continuation of this trend in Europe and North America into the coming decades—although this was not the main objective of our study—it could imply that 15 million fewer people will develop dementia by 2040 in high-income countries, compared to widely quoted projections of the global burden of disease.” |
| | |
| | |
| | |
| | |
| | |
| New Political Information: Indicators and Surprises | Why Is This Information Valuable? |
| “Morality Justifies Motivated Reasoning In The Folk Ethics Of Belief”, by Cusimano and Lombrozo | No, you haven’t been imagining it – or the only one who has thought this was going on in our political life… “When faced with a dilemma between believing what is supported by an impartial assessment of the evidence (e.g., that one’s friend is guilty of a crime) and believing what would better fulfill a moral obligation (e.g., that the friend is innocent), people often believe in line with the latter. But is this how people think beliefs ought to be formed? “We addressed this question across three studies and found that, across a diverse set of everyday situations, people treat moral considerations as legitimate grounds for believing propositions that are unsupported by objective, evidence-based reasoning. “We further document two ways in which moral evaluations affect how people prescribe beliefs to others. First, the moral value of a belief affects the evidential threshold required to believe, such that morally good beliefs demand less evidence than morally bad beliefs. “Second, people sometimes treat the moral value of a belief as an independent justification for belief, and so sometimes prescribe evidentially poor beliefs to others.” |
| “Democracy is Not Destiny”, by Ruy Teixeira | SURPRISE “In the months after Barack Obama’s historic victory, the conventional wisdom held that Democrats would now dominate the nation’s politics for decades. “There have been long periods where one party generally has the upper hand,” famous Democratic strategist James Carville remarked at the time. Obama’s victory, the title of Carville’s new book predicted, marked the beginning of just such an epoch: 40 More Years—How Democrats Will Rule the Next Generation. “Carville’s analysis was based on a simple narrative: Groups that favor Democrats are growing. Groups that favor Republicans are shrinking. Demographic change will keep swelling the Democratic ranks until Republicans have little choice but to surrender. "It is a narrative I know well, for it is based on a bowdlerization of my own work. In 2002, John Judis and I published The Emerging Democratic Majority. In our book, we argue that Democrats should take advantage of a set of interrelated social, economic and demographic changes, including the growth of minority communities and cultural shifts among college graduates. But we also emphasized that building this majority would require a very broad coalition, including many voters drawn from the white working class… To hold this broad coalition together, we argued, Democrats needed to adopt a form of “progressive centrism.” The party should proudly emphasize the ability of government to improve the lives of ordinary Americans. But its governing ideology could not present itself as standing in radical opposition to the country’s founding values… This crucial nuance was quickly lost. "And so, many Democratic pundits, operatives and elected officials have falsely come to believe that demographics are destiny…Instead of focusing on the fact that this emerging majority only gave Democrats tremendous potential if they played their cards right, many progressives started to interpret it as a description of an inevitable future… “The result has been a decade-long electoral disaster. With the exception of Obama’s victory in 2012, Democrats lost just about every important election for the next eight years. “By early 2016, the party was down to 44 seats in the United States Senate, 188 seats in the House of Representatives, 18 governorships and 3,164 seats in state legislatures—the fewest elected offices Democrats have held nationwide since the 1920s. Then came the coup de grace: Donald Trump defeated Hillary Clinton to become the 45th President of the United States… “The bowdlerization of the emerging Democratic majority thesis neatly complemented the political predilections of a rising set of people who placed questions of group identity and disadvantage at the heart of their political activism. “This approach, which soon came to be known as “identity politics,” privileges mobilization around multiple, intersecting levels of oppression based on group identification over mobilization around universal rights and principles that bind people together across groups. Since most white non-college voters were rightly perceived to be uninterested in—if not outright hostile to—the core tenets of intersectional politics, those who favored this approach had a reason to embrace an electoral strategy that dispensed with them…The apotheosis of this attitude was Hillary Clinton’s infamous statement that half of Trump’s supporters belonged in a “basket of deplorables” … “If Democrats don’t correct their misunderstanding of what it takes for them to win elections, the next decade could turn out to be just as bitter as the last. But even after ten painful years, their most influential operatives continue to believe that demographic changes will inevitably give them a decisive advantage”… |
| “First as Tragedy, Then as Farce: The Collapse of the Sanders Campaign and the “Fusionist” Left”, by Nagle and Tracey | SUPRRISE The authors describe the two very different primary campaigns run by Bernie Sanders in 2016 and 2020. They note that, “immediately after the 2016 election, [Sanders] authored a message that was decidedly different in tone from the frantic, denunciatory screeds ripping across the left-liberal media at that time: “Donald Trump tapped into the anger of a declining middle class that is sick and tired of establishment economics, establishment politics and the establishment media,” Sanders wrote. “To the degree that Mr. Trump is serious about pursuing policies that improve the lives of working families in this country, I and other progressives are prepared to work with him.” But this never came to pass, largely for reasons having to do with the radicalization of the American “progressive” movement”, and, to be sure, the Trump administration quickly pivoting to support economic policies favored by the traditional Republican donor class. Nagle and Tracey proceed to chronicle how between 2016 and 2020, Sanders moved away from traditional Democratic class based rhetoric and adopted progressives’ identity politics. |
| “The Double Horseshoe Theory of Class Politics”, by Michael Lind | SURPRISE In this essay, Lind’s key point is that “the ‘class war’ isn’t happening where you think it is.” He notes that, “it is obvious that class conflicts have set the North Atlantic world ablaze? But what are the classes?” He posits that there are actually three groups with both what he terms the overclass and the working class. By Lind’s reckoning, the former accounts for at most thirty percent of the US population. In the overclass, “the managerial elite proper consists of the functionaries of corporations, large investment banks, law firms, government agencies, both civilian and military, nonprofits, and universities. They may have professional degrees, but they are essentially organizational men and women in centralized, hierarchical, bureaucratic entities.” Another overclass group is “The professional bourgeoisie—made up of lawyers, doctors, professors, K-12 teachers, journalists, nonprofit workers, and many of the clergy—is concentrated in the teaching, helping, and research sectors. Their jobs often pay modestly but provide both status and a degree of personal autonomy that the frequently better-paid managerial functionaries in more hierarchical occupations do not possess.” The third overclass group is “the small business bourgeoisie, which consists of the owner-operators of small businesses and franchises, along with genuine contractors (as opposed to proletarian “gig workers”), both those who are self-employed and those who employ others. “In the United States (if not necessarily other Western countries), the overclass broadly defined, then, can be viewed as a compound of the classic managerial elite plus these two bourgeois classes. A four-year college diploma is a prerequisite for entry into all of these elite groups.” Lind’s thesis is that today, “American politics is little more than the internal politics of the overclass, now that the working class majority has lost the grassroots, mass-membership institutions that once gave it collective bargaining power—private sector trade unions, influential religious organizations, and local political parties. Members of the working-class majority play no role except as occasional voters. “They tend to be ignored, except during election seasons, when they are targeted by manipulative appeals based on race and gender in the case of the Democrats and religion and patriotism in the case of the Republicans.” Lind defines the dynamic of political competition and conflict, within the overclass thus: “the members of the professional bourgeoisie and the small business bourgeoisie live in terror of proletarianization. Many professionals fear they will not be able to secure high-status jobs with their educational credentials, and the small proprietors fear they will lose their businesses and be compelled to work for others. “At the risk of being overly schematic I would suggest that the “center,” “left” and “right” of America’s top-thirty percent politics can be mapped imperfectly onto the managerial elite, the professional bourgeoisie and the small business bourgeoisie.” |
| More articles appeared this month detailing concerns about an increasingly likely transition crisis following the November election in the US. | SURPRISE Previously, these concerns had mostly been focused on the potential refusal of Donald Trump to leave office if he is defeated, and to somehow challenge the legitimacy of the election. However, in “Getting from November to January”, Nils Gilman concludes that, “Wargaming shows that, short of a landslide victory for Joe Biden in the upcoming elections, we may be headed for a severe constitutional crisis.” If Biden loses, his team is likely to challenge the election results because of interference with absentee balloting, which will be critical thanks to COVID. For example, the US Postal Service has tripled the cost of mailing absentee ballots, and eliminated overtime payments to postal employees, which has slowed delivery times throughout the system. The Biden team’s goal would be to force the election to be decided by the House of Representatives, which the Democrats control. However, for this to happen, it is almost certain that the US Supreme Court would first have to rule on the legality of overturning the vote of the Electoral College. At this point, it seems highly uncertain which way the Court would rule. In sum, regardless of which candidate wins in November, a constitutional crisis is very likely to follow. |
| | |
| | |
| | |
| | |
| | |
| | |
| | |
| | |
| New Financial Markets and Investor Behavior: Indicators and Surprises | Why Is This Information Valuable? |
| “How to Lose a Billion Dollars Without Really Trying”, by Leanna Orr in Institutional Investor | Whether in the form of insurance products, equity put options, or more complicated derivatives, selling protection against losses due to adverse events is always a seductive but dangerous game. It’s seductive because it looks like easy money – collecting premium for bearing exposure to risks that have a very low level of occurring. But far more dangerous than people want to accept, because if those risk exposures are generated by a complex adaptive system (like a financial market), they have a power law distribution, with a lot of irreducible uncertainty about how large your losses could be in the far reaches of its tail. Strategically, sellers of protection should be aware that such exposures exist. Operationally, they may even have thought about how different scenarios could generate them – but knowing that in complex adaptive systems forecast accuracy degrades exponentially as the time horizon lengthens. Essentially, when you’re selling protection, there’s an underlying assumption that you will spot an exponentially growing exposure and be able to close out your positions before others do. As this analysis shows, when COVID-19 hit, a lot of big hedge funds that were long volatility (i.e., that had sold protection) lost impressively large amounts of money for their investors. If you spend enough years in financial markets, you realize that this is a plot line that repeats with depressing regularity. See also, “Fed Regulator is Fed Up with Hedge Funds’ Behavior”, about the Fed’s forced bailout of hedge funds on the wrong end of Treasury trades, by John Dizard in the Financial Times |
| “The ESG Concept Has Been Overhyped And Oversold”, by Bradford Cornell from UCLA | SURPRISE Another valuable and frequently repeated piece of investing wisdom, ignored at ones peril, is that if something seems to good to be true, it probably isn’t. In this column, professor Cornell makes that case for ESG investing. “The environmental, social and governance bandwagon is rolling. Companies are becoming ESG advocates, tempted by promises that they will become more profitable and valuable if they follow the ESG script, say the right things and spend money improving their ESG ratings. “Meantime, institutional investors, drawn by the allure of earning higher returns while keeping their consciences clean, are directing tens of billions of dollars to “good” companies with high ESG ratings. “Much as we would like to accept this virtuous story, we believe that the whole concept has been overhyped and oversold. Furthermore, it is backed by weak to non-existent evidence of promised pay-offs for either companies or investors, and fraught with internal inconsistencies that undercut its credibility” … “To assess the current dogma, we start with the premise that for a company’s social consciousness to affect its value, it has to change either the cash flows that it generates or alter the risk of those cash flows. “From that perspective, the best-case scenario for ESG is that consumers will buy more of the products and services offered by good companies, allowing these companies to increase future cash flows. That argument works for niche companies such as Patagonia, which serve a small, upscale market of socially conscious consumers. It may not for bigger companies that have to cater to larger, more price-conscious markets… “A second way that ESG and value may be positively linked is if bad companies are punished in capital markets because investors require higher expected returns to hold them, leading to lower stock prices… “The strongest evidence in favour of ESG is on the discount rate front. There are signs that “sin” stocks such as tobacco or weapons companies face higher costs of funding than good companies. But that is a double-edged sword. If, as ESG advocates argue, fund managers prefer to invest in “good” companies and reward them with higher values, investors who buy at those higher values will earn lower returns over time. “One hopeful note for investors is that there seems to be a pay-off to investing in good companies before the market recognises and prices in that goodness. But with the attention paid to ESG growing rapidly, such opportunities are likely to disappear quickly… [However], “it is impossible to have an honest discussion about ESG when its advocates believe that they occupy the moral high ground and view disagreement as immoral or unethical.” |
| “What is Certain About Uncertainty?” by Cascaldi-Garcia et al from the Board of Governors of the Federal Reserve | SURPRISE The authors present an excellent, thorough overview of what are, essentially, measures of risk. Only at the end do they focus on the distinction between risk and Knightian uncertainty. Unsurprisingly, they find few measures of the latter; those they highlight are based on individual levels of ambiguity aversion. This paper highlights a point we have been making in our writing for almost 25 years: The dominant form of doubt about the future in complex adaptive systems like political economies and financial markets is Knightian Uncertainty, not risk. Even with today’s machine learning technologies, it resists quantitative analysis (though when AI technologies acquire causal and counterfactual reasoning capabilities, that will change). Instead, it must be approached using qualitative tools, particularly over longer time horizons. To the extent that customers for such analysis desire probabilities, they must settle for ones that are unavoidably Bayesian, and not grounded in frequentist statistics. |
| “Sentiment and Uncertainty”, by Birru and Young | This paper’s findings is consistent with previous research that has found individuals’ willingness to conform to the views and behavior of a group, and hence their use of social learning and copying, all increase with uncertainty. “Sentiment should exhibit its strongest effects on asset prices at times when valuations are most subjective. Consistent with this hypothesis, we show that a one-standard- deviation increase in aggregate uncertainty amplifies the predictive ability of sentiment for market returns by two to four times relative to when uncertainty is at its mean.” |
| | |
| | |
| | |
| | |
System Tipping Points/Critical Threshold Analysis
Like Professors Andrew Lo, Doyne Farmer and others, we regard financial markets as a complex adaptive system (CAS), that exist as part of a larger macro system comprised of other CAS between which there are multiple feedback loops. These other systems include those that produce technology innovations, and economic, environmental, national security (including cyber), social, demographic, and political outcomes.
We also find that these systems tend to operate and generate effects in a rough chronological sequence, albeit with many feedback loops between them. The following chart highlights that the changes we observe in different areas at any point in time are actually part of a much more complex evolutionary process.
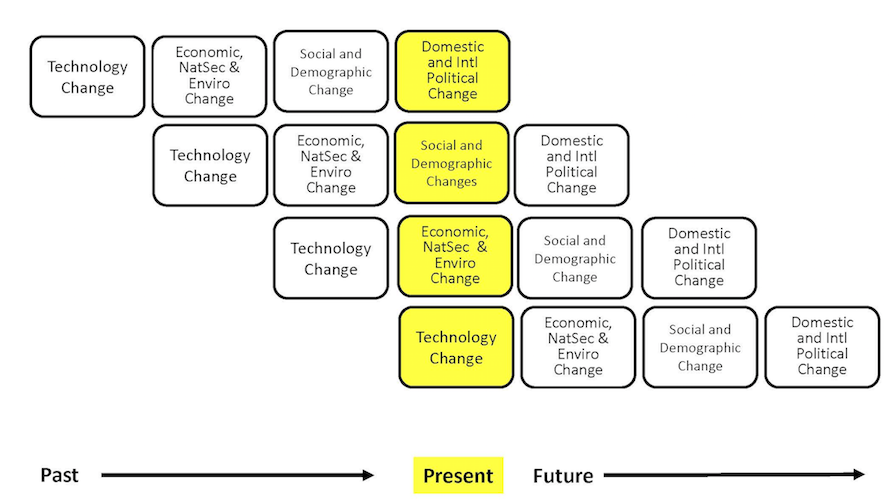
While most media coverage of these systems focused on flows (e.g., the size of the government deficit), rapid non-linear change in complex adaptive systems is often caused by a key stock (e.g., the amount of outstanding government debt) exceeding a critical threshold.
The next table highlights the key macro system stocks that we monitor.
In the next section, we will discuss information received over the past month that is related to these stocks, and which we believe is significant to our assessment of the probabilities that a critical threshold will be reached and a regime change will occur. We will conclude with our estimate, at the end of this month, of how close the macro system is to these critical thresholds, and the implications for financial market regime change probabilities.
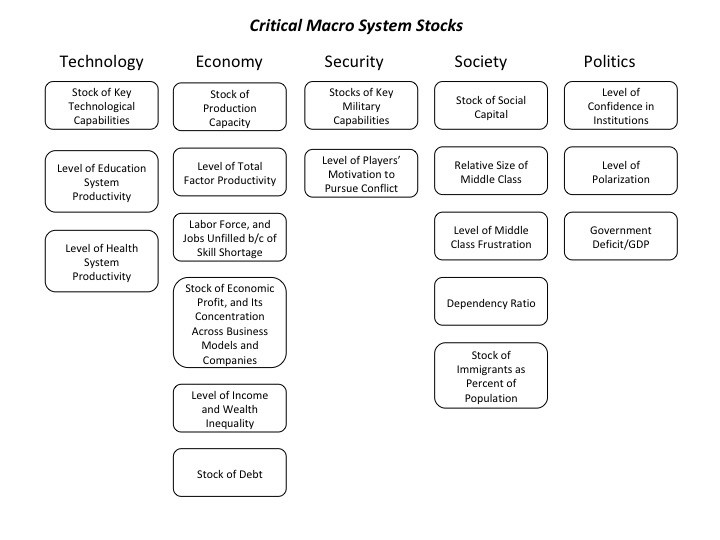
How Close is the Macro System to One or More Critical Thresholds?
As we have noted, the macro drivers of financial market regime changes typically follow a rough chronological sequence, from technology to economic, security, social, and political causes and effects. Yet there are many feedbacks loops between them, creating complex root causes for many of the critical thresholds we have identified.
Understanding the time dynamics in this complex system is critical to avoiding substantial downside investment risk.
We use the UK Met Office Warning Model to communicate our assessment of these time dynamics. We estimate the time remaining before a critical macro system threshold is reached that could trigger a regime change, which is usually accompanied by substantial changes in asset class valuations.
The model uses three increasingly serious levels of warning, from “Be Aware” (condition yellow), to “Be Prepared” (condition orange), to “Take Action” (condition red).
For our purposes, we denote as “Be Aware” (yellow) critical thresholds that we assess to be three or more years away. We estimate that “Be Prepared” (orange) thresholds could be reached within 1 to 3 years. “Take Action” thresholds are very likely to be reached within one year.
Given their nature, we also note that in our three “wildcard” areas (Environment and Energy related; Disease and Human Caused Bioevents; and Cyber and Electromagnetic Events), our forecasts have higher levels of uncertainty.
The following charts summarize our current estimate of the time remaining before different critical thresholds will be reached.
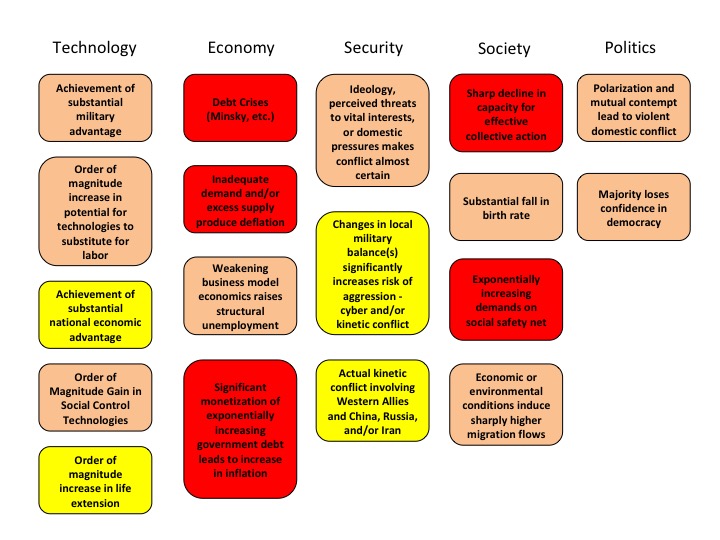
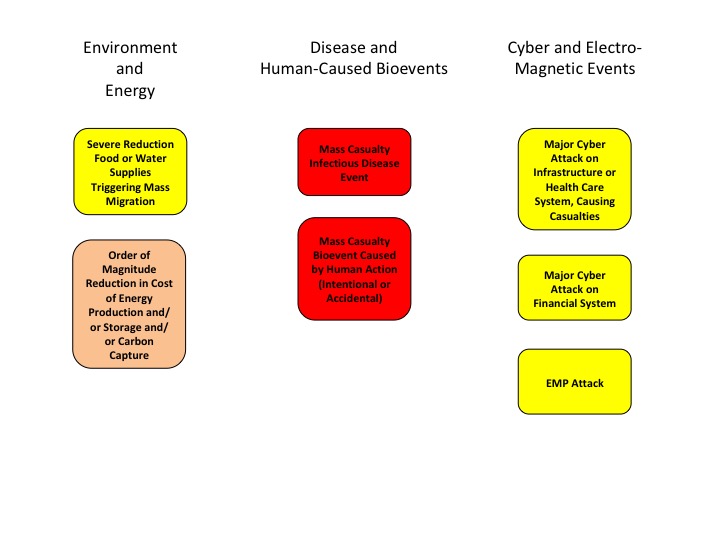
At the highest level, we believe the complex adaptive global macro system can be in one of four states, based on its degree of order versus disorder, and degree of social cooperation versus conflict. A very coarse-grained reading of history suggests that these states evolve in a predictable cycle, from ordered/cooperative, to disordered/cooperative, to disordered/conflicted, to ordered/conflicted.
We believe that the system is currently in its most uncertain state, characterized by high degrees of underlying disorder and social conflict, both domestically and internationally. Beyond some point, intensifying conflict eventually increases the degree of order in the system. That appears to be happening now, via the increasing conflict between China, Russia, and Iran and the United States and other Western nations.
If you have any questions about anything we have written in this issue, please don’t hesitate to get in touch, at contact@indexinvestor.com
Appendix: Anticipatory Thinking and Forecasting Methodologies
Our process is based on methods and tools developed over the past seven years at our affiliate, Britten Coyne Partners, which provides consulting services and education courses to executive teams and boards on strategic risk governance and management.
At The Index Investor, we engage in both anticipatory thinking to identify what could happen (e.g., different macro regimes and related events), and forecasting, to estimate the probability that events and regimes will happen, and the impact they will have if they do (e.g., on macro variables and broad asset class returns).
With respect to what could happen, we are acutely conscious of the conclusion reached by a 1983 CIA study of failed forecasts: "each involved historical discontinuity, and, in the early stages…unlikely outcomes. The basic problem was…situations in which trend continuity and precedent were of marginal, if not counterproductive value."
When it comes to forecasting, we know that in complex socio-technical systems that are constantly evolving, the accuracy of statistical or machine learning based forecasting methods declines exponentially as the time horizon lengthens, since the historical data set on which they were trained will (depending on the speed and effectiveness of any retraining cycle) bear less and less resemblance to the distribution of outcomes the system is likely to produce in the future.
Under these circumstances, forecast accuracy over longer time horizons depends on causal and counterfactual reasoning about the possible future effects of multiple interacting trends and uncertainties that are hard to quantify.
And we are acutely aware of the economist Rudi Dornbusch's famous warning: "Crises take a much longer time coming than you think, then happen much faster than you would have thought."
Our forecasting process also draws on lessons Tom Coyne learned from spending four years as a member of the Good Judgment Project team, which won the Intelligence Advanced Research Projects Activity’s forecasting tournament with forecast accuracy that was more than 50% better than the tournament's control groups (the team's experience is described in Professor Philip Tetlock's book, “Superforecasting").
Our analysis focuses on the probability of the global macro system being in four possible macro regimes 12 and 36 months from the date of our forecast: (1) Normal Times, where equity asset classes perform well; (2) a High Uncertainty regime that is usually short and transitory, where asset classes like short-term government bonds perform best and equities suffer significant declines; (3) High Inflation (which we deem 5% or more, year-on-year), where commercial property, real return bonds and other traditional hedges are favored; and (4) Persistent Deflation (a year-on-year decline in the US CPI), which up to now has only been seen in Japan, and in which the relative performance of different asset classes remains uncertain, but will likely favor high quality bonds and the consumer staples equity sector.
In response to subscriber requests, we have added a 36-month regime forecast to our existing 12 month forecast. The logic is that, in a complex evolving system like global macro, a longer forecast horizon gets beyond the “detection range” of algorithmic forecasting approaches, and therefore raises probability that a manager/investor can gain an edge in identifying emerging threats and opportunities.
That said, because evolving (i.e., “non-stationary”) complex systems populated by highly connected human agents are also capable of sudden non-linear changes (with which are hard for algorithmic approaches to predict), we are also keeping our 12 month forecast.
Our forecasting methodology starts with base rate/reference case data about the historical probability of large changes in equity and bond valuations. We then analyze the current situation from both a quantitative and qualitative perspective. In the latter, we focus on the key endogenous drivers of macro regime change, including technological, economic, national security, social, and political trends and uncertainties. We also focus on three potential sources of exogenous shocks that could also produce a macro regime change, caused by environmental, disease, and cyber related events.
While most of our attention typically focuses on various flows (e.g., economic growth, change in the price level, sales, earnings, job creation, etc.), endogenously caused regime changes result when those flows push key stocks beyond a critical threshold or tipping point, often setting off non-linear reactions across multiple areas. As noted by Hyman Minsky and others, a classic example is the steady accumulation of outstanding debt until it reaches the point where it can no longer be serviced and triggers a crisis.
Base Rate Data
Since the end of World War Two, there have been fifteen months where a downturn in the US equity market began that eventually reduced asset class value by 20% of more. That is a hazard rate of about 1.75% per month. Put differently, in any given month there is a 98.25% probability that a 20%+ downturn won’t occur, or, in a given year, an 81% probability.
However, as the time without a 20%+ downturn extends, the compound probability that one will not occur shrinks. At the end of August 2018, it is more than nine years since the last equity market decline of 20% or more. The probability of that happening is only 15%.
To estimate the base rate for a 20% fall in bond prices (which historically has been caused by a sharp increase in inflation, as we saw in the late 1970s and early 1980s), we analyzed monthly historical AAA bond yields since 1919. For consistency, we used them to calculate the price of a ten-year zero coupon bond. We then calculated the probability of a price decline of 20% or more over three different holding periods: 12, 18, and 24 months. In any month, the annualized probability of a decline of 20% or more over the subsequent 12 months is 12%; over 18 months, 20%, and over 24 months, 25%.
Market Stress Indicators Methodology
We view financial markets as a complex adaptive system. The size of changes generated by such a system follows a power law rather than a normal (Gaussian) distribution. The critical point is that large changes are much more common in complex adaptive systems than most people’s intuition leads them to believe.
While predicting the behavior of complex adaptive systems remains far more art than a science, various researchers have found that large changes in such systems are often preceded by subtle warning signs, as stress accumulates within them. While this research is not definitive, we believe that five warning signs are worth monitoring as potential indicators of growing stress within financial markets that could suddenly give rise to large changes in asset class valuations.
Our first indicator is the month-to-month autocorrelation of broad asset class returns (i.e., the relationship of this month’s returns to last month’s). A system under increasing stress loses resiliency, causing it to take longer to recover from perturbations; hence, autocorrelation increases as it approaches a critical transition (see, “Early Warning Signals for Critical Transitions” by Scheffer, et al).
The second market stress indicator we monitor is the Economic Policy Uncertainty Index published by the Federal Reserve Bank of St. Louis (via its FRED economic database), which is based on research by Baker, Bloom, and Davis (see their paper, “Measuring Economic Policy Uncertainty”). The index is based on automated text analysis of leading newspapers and magazine publications, to identify the frequency with which words and phrases are used that indicate uncertainty.
In humans’ evolutionary past, when uncertainty increased the probability of survival was enhanced by staying close to a group. All of us still have that instinct. Research has found that as uncertainty increases, we have an unconscious bias towards higher conformity of our own views with those of a larger group (i.e., reduction in cognitive diversity). Behaviorally, heightened uncertainty induces more “social copying” of others, likely due to both conformity bias and the rational belief that others may be acting on the basis of superior information. This increase in conformity and copying makes a social system more ordered as uncertainty increases, and also reduces its responsiveness to perturbations (i.e., increases autocorrelation) because of delays in the social copying process.
The key point is that increasing uncertainty induces more, not less order in social systems, and in so doing primes them for sudden non-linear change.
Our third market stress indicator is the spread between the yield on AAA rated bonds and the 10-year US Treasury. This is a proxy for the level of investor concern about financial system funding liquidity.
Our fourth market stress indicator is the yield spread between speculative BB rated bonds and the ten-year US Treasury. Throughout history, excessive credit growth has been a root cause of many financial crises. An indicator of such growth is falling credit spreads, particularly in the case of riskier borrowers. In contrast, rising BB spreads indicate growing investor concern about the consequences of such growth, and the financial distress lower rated companies could experience in an economic downturn.
Our fifth market stress indicator is what we term the “political risk premium” that is implicit in the price of gold. Our starting point for estimating this premium is the three different roles that gold plays. First, gold is a store of value in a world of fiat currencies. When the rate of money supply growth exceeds the growth of nominal GDP, gold’s price should increase to maintain its purchasing power. Between 2007 and 2017, the US money supply (M2) grew by about 86%, while nominal US GDP grew by 35%. The stock of gold grew by 18%, based on mine production over this period. We therefore infer that 33% of the increase in the price of gold represented the maximum potential gold price change that could be attributed to a desire to hedge inflation risk (86% less 35% less 18%).
Second, gold is a unit of account. We take this to mean that the annual change in GDP expressed in terms of physical gold (i.e., nominal GDP divided by the price of gold) should equal the change in real GDP calculated using the GDP price deflator to account for actual inflation over the period. A key challenge is the point at which to start this calculation.
We chose the price of gold in 1995/1996. In that period, the change in real global GDP measured using the IMF’s price deflator just about equaled the change in GDP measured in terms of physical gold. We interpret that coincidence as indicating that at that point in time, concerns about future inflation and political risk were minimal, and the change in the price of gold was mostly driven by its role as a unit of account. We calculated a subsequent series of gold prices that would produce the same change in “gold GDP” as the actual real GDP as calculated by the IMF. Between 2007 and 2017, “gold as a unit of account” warranted a 21% increase in its price.
Gold’s third role is as a hedge against inflation and what we term “political disaster” risk. We subtract the 21% estimated compensation for actual inflation from the 33% “gross” inflation risk hedge to derive an apparent 12% increase in the gold price that reflected the true risk premium to hedge against possible future inflation. However, between 2007 and 2017 the price of gold actually increased by 81%. This implies that 48% of this (81% less 21% less 12%) represented a premium for some other type of uncertainty at the end of 2017. The interesting question is the nature of the uncertainty for which gold is believed by some investors to be a superior hedge than traditional ports in a storm like short-term US government securities, or similar securities issued by other developed countries.
The logical inference is that the uncertainty in question must reflect a situation in which short term US Treasuries would be a less effective hedge than gold. This could be a world of widespread hyperinflation, capital controls, and/or radical changes in nations’ governments (of course, this would also imply a preference for investing in gold coins rather than bullion, as while the latter may be a store of value, it is far less convenient as a means of paying for transactions).
To put this in further perspective, this gold price “disaster risk” premium sharply increased from 2008 to 2012, then declined before sharply increasing again after 2016. Arguably, a significant part of the former increase reflects concerns about the potential inflationary consequences of dramatic quantitative easing by central banks. But this is not likely to be the case after 2016.